For the Sunburst Chart, apart from the standard chart customizations, there is a script which helps the user to customize the color of the chart based on the value.
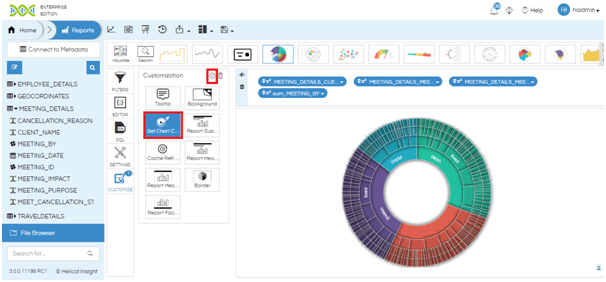
Step 1: Create a report with Sunburst chart visualization.
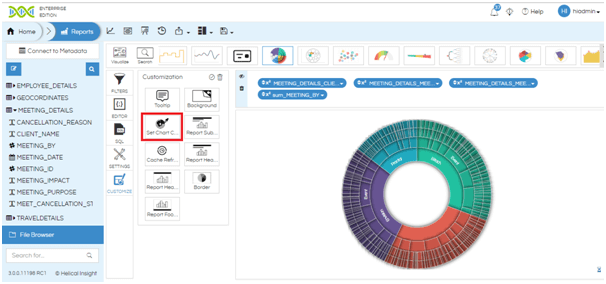
Step 2: Double Click on the “Set Chart Colour” button. A popup will appear.
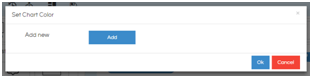
Step 3: Click on Add.
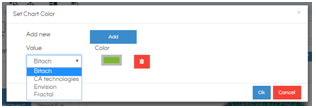
Step 4: Select the Value of the dimension and the corresponding color. You can add more values by clicking on Add.
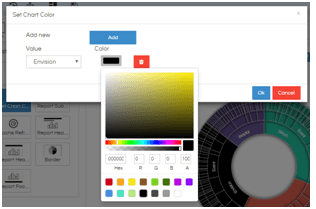
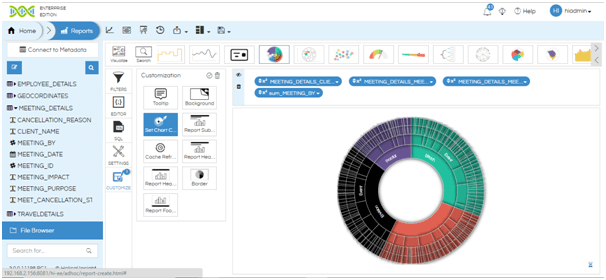
Step 5: Click on OK. You will see that the “Set Chart Colour” button is highlighted.
Step 6: Click on the tick button at the top right column of the customization tab. The customization is applied.
For more information you can email on support@helicalinsight.com
