In this blog we are going to cover the points related to the usage of image component. The image component can be used to add logos, icons, images etc related to the data being displayed etc. This blog has been created with version 6.0 of Helical Insight Enterprise Edition in mind.

Note: As of now the image file types which are supported are JPEG, SVG, JPG and PNG only.

An image can be fetched directly from the URL (refer to Point l) or it can be uploaded in the Helical Insight file browser repository from where it can be used. Below the method of uploading an image is explained.

  1. Click on the Home Button present at the top left of the blue band.

    Using Image component in Canned Reporting

  2. Click on File Browser present at the bottom left of the screen

    Using Image component in Canned Reporting

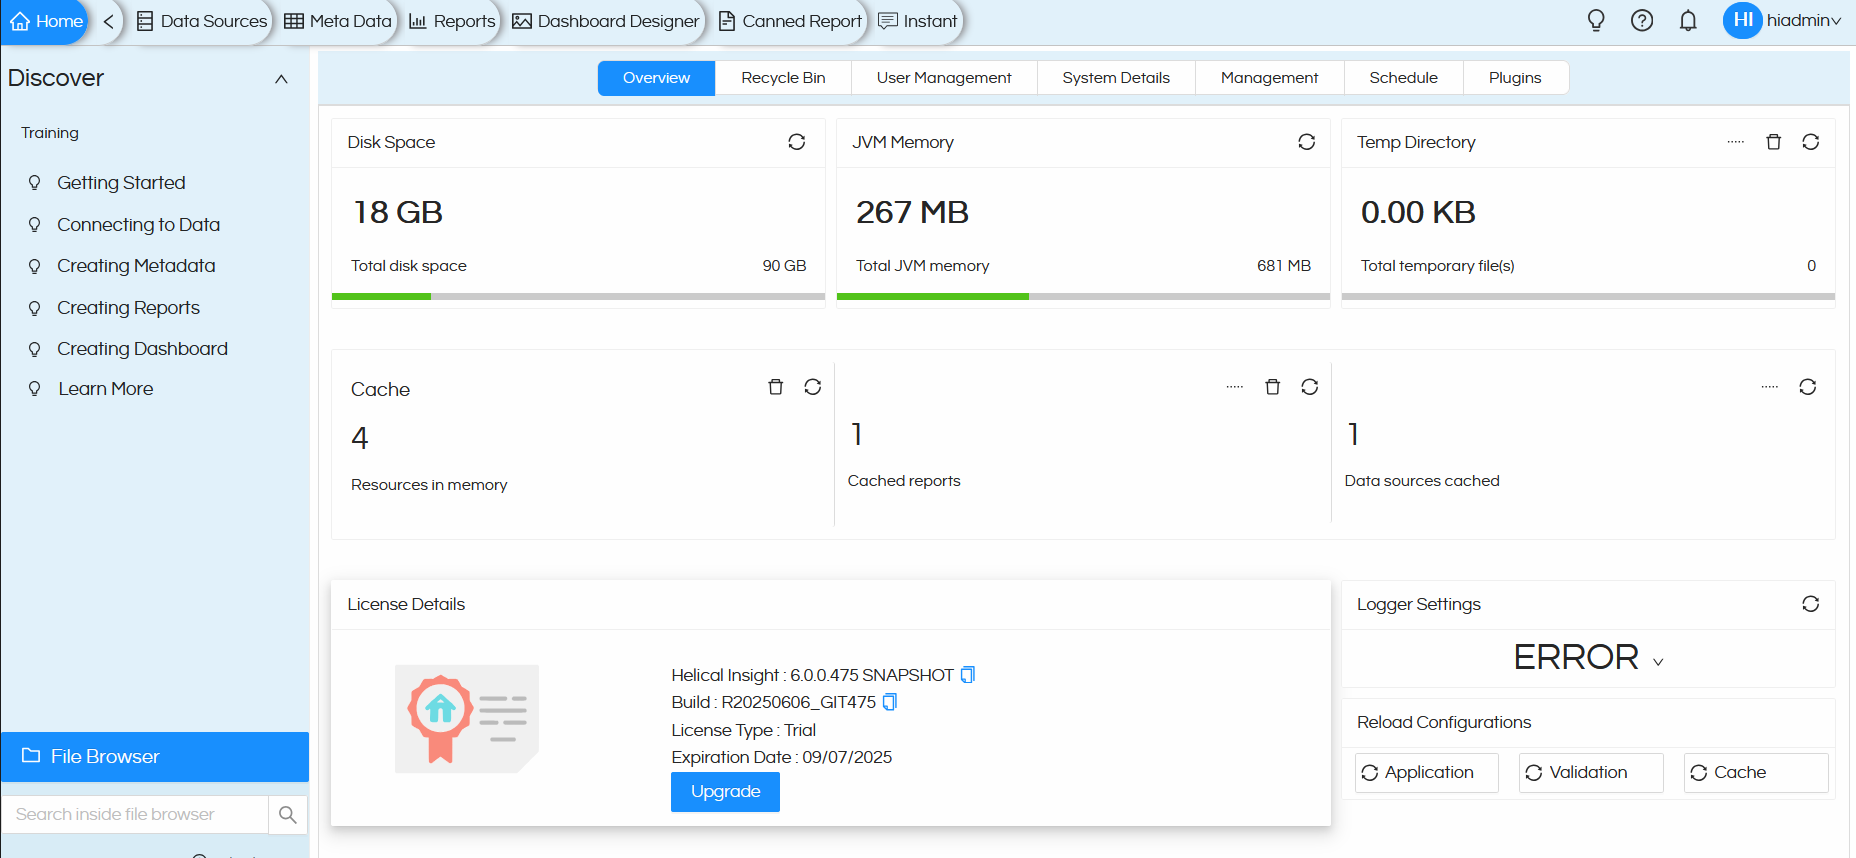
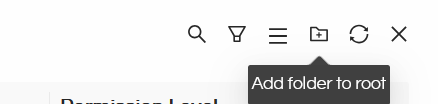
  3. When clicked File Browser will open. You can create a New Folder by using the top right option in the opened File Browser.

    Using Image component in Canned Reporting

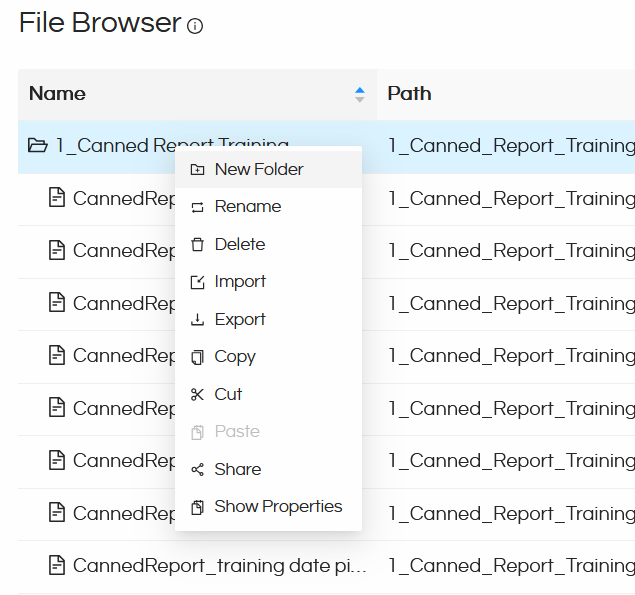
    Any created folder can also have a subfolder, for that you can select any folder, right click on it and in the popup option you can use New Folder option.

    Using Image component in Canned Reporting

  4. In the created New Folder or subfolder, you can right click and you will get Import option.

    Using Image component in Canned Reporting

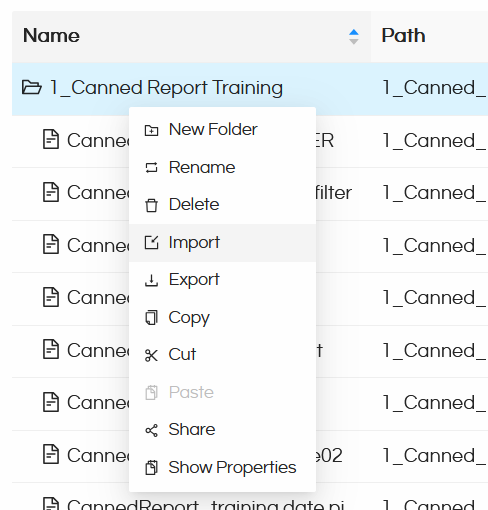
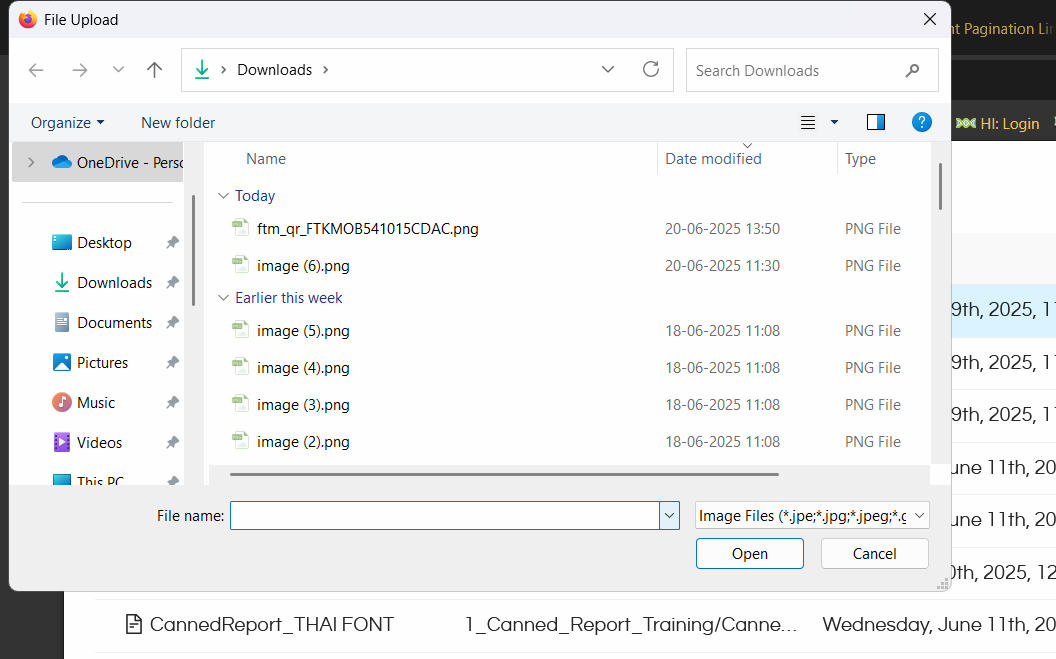
  5. Clicking on Import will open a file browser allowing you to upload any file. Now select the image that you would like to import and use while designing the canned report.

    Using Image component in Canned Reporting

    Once the image is imported it will show that notification message.

  6. Now in the below steps we have covered how to use image component in the canned reports.

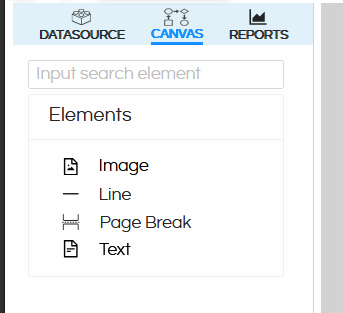
  7. Open Canned Report Module. Go to Canvas
  8. Drag the Image component from the left side onto the Canvas

    Using Image component in Canned Reporting

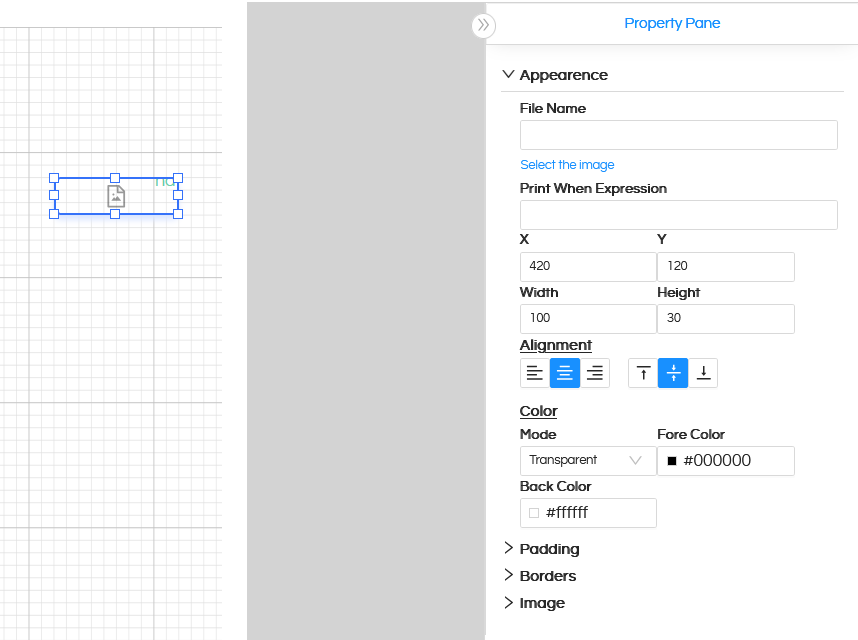
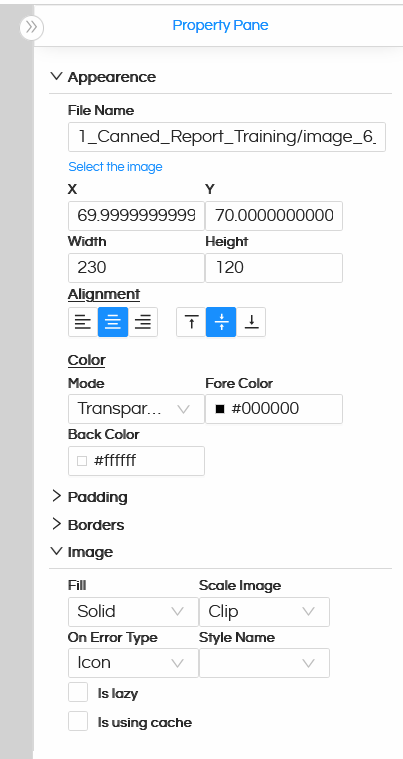
  9. You can click on the dragged image component, and on the right side in the Property Pane we can see a lot of that image related configuration options.

    Using Image component in Canned Reporting

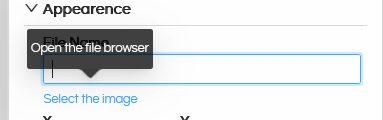
  10. Click on “Select the image” which will open the File Browser.

    Using Image component in Canned Reporting

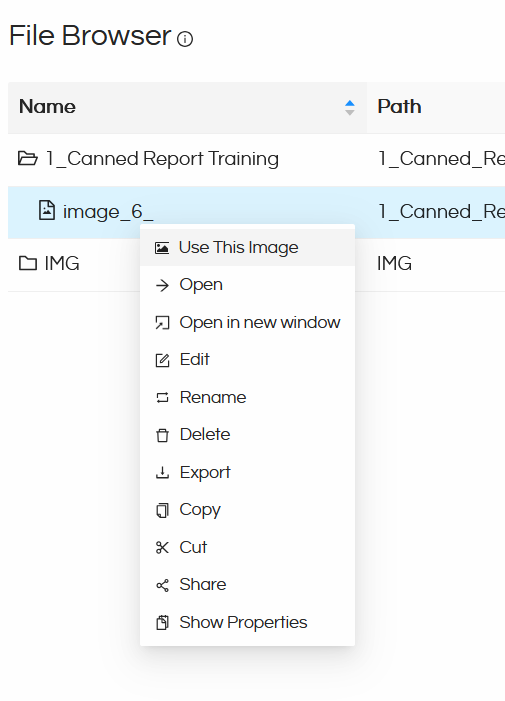
  11. Navigate to the respective Folder where you have uploaded the file. Select it, right click on it and use the option “Use this Image

    Using Image component in Canned Reporting

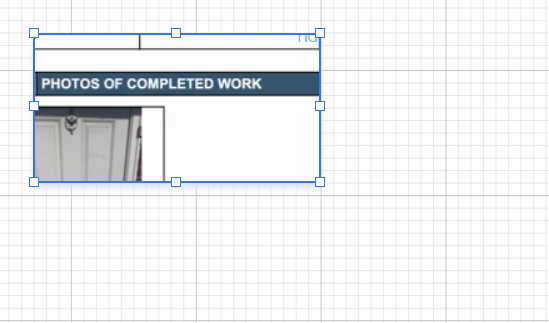
  12. Image will get added as shown.

    Using Image component in Canned Reporting

  13. Alternatively, it is also possible to directly provide the image URL in the placeholder field
    (e.g. https://www.helicalinsight.com/wp-content/uploads/2022/08/helical-insight-logo-1-2.png).

Further, Property options can be used which are explained below.

  • XY coordinates and Height Width: You can define the X and Y coordinates and the height and width of the image. Please note that the height and width of the image should be equal for proper rendering.
  • Alignment: If the scale type for the image is Clip or RetainShape and the actual image is smaller than its defined size in the report template or does not have the same proportions, the image might not occupy all the space allocated to it in the report template. In these conditions the image can be both horizontally and vertically aligned within its report element. Two attributes are responsible for the image alignment:
    • Vertical – specifies the vertical alignment. Possible values are: Top, Middle, Bottom
    • Horizontal – specifies the horizontal alignment. Possible values are: Left, Center, Right.
  • Padding: Defines the padding between the container and the element. You can define the top, bottom, right and left padding
  • Border: Top, bottom, left and right border style, weight and type for the image can be defined.
  • Image: When clicked and expanded, Image category has got the below list of sub options.
    • Evaluation Time – Specify the moment when the image expression gets evaluated. The image expression can be processed at the end of present band or page, group, report, column, specific band etc.
    • Eval Group – Select the group based on which the evaluation time will be processed. This is used when the Evaluation Time is set to Group
    • Style Name – Used when styles have been defined using Page Properties.
    • Fill – Fill type of the image background – Solid is the default.
    • Scale Image – indicates how should be rendered the image when its actual size does not fit the size of the image report element. This is because in a lot of situations images are loaded at runtime and there is no way to know their exact size when creating the report template. Possible values for this attribute are:
      • Clip – if the actual image is larger than the image element size, it will be cut off so that it keeps its original resolution, and only the region that fits the specified size will be displayed.
      • FillFrame – if the dimensions of the actual image do not fit those specified for the image element that displays it, the image is forced to obey them and stretch itself so that it fits in the designated output area. It will be deformed if necessary.
      • RetainShape – if the actual image does not fit into the image element, it can be adapted to those dimensions while keeping its original undeformed proportions.
      • RealHeight – the image can be stretched vertically to match the actual image height, while preserving the declared width of the image element.
      • RealSize – the image can be stretched vertically to match the actual image height, while adjusting the width of the image element to match the actual image width.
    • On Error Type: Defines what should be displayed if there is error in rendering the image
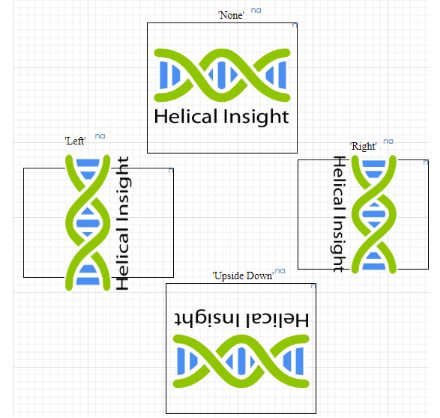
    • Rotation: Defines the rotation of the image on loading.

      Using Image component in Canned Reporting

    • Position: Position of the image origin
    • Stretch: In case of image overflow, how the container or element should be stretched.

Others:

  • Print Repeated Values: Prints values that are repeated
  • Remove Line when Blank: If the image is blank, then no line should be printed.
  • Is Lazy – flag that specifies whether the image should be loaded and processed during report filling or during exporting, in case that the image is not available at fill time. By default this flag is set to false. When it is set to true, an image path String is stored at fill time instead of the image itself, and during the exporting process the image will be loaded from the location read from this path String.
  • Is Using Cache – flag that indicates if an image should be loaded each time it gets displayed in a report, or if it should be loaded only once and then stored in a memory cache for better performance. For images with static content applying the caching mechanism is strongly recommended. When one set the isUsingCache attribute to true, the reporting engine will try to recognize previously loaded images using their specified source
  • Print in First whole band – Used when print repeated values is false. The image is printed in a whole band on the page
  • Print when detail overflows – If the detail overflows the container, then whether it should be printed on the next page.

Using Image component in Canned Reporting

Please reach out to support@helicalinsight.com in case of any other questions.

Leave a Reply

Helical Insight’s self-service capabilities is one to reckon with. It allows you to simply drag and drop columns, add filters, apply aggregate functions if required, and create reports and dashboards on the fly. For advanced users, the self-service component has ability to add javascript, HTML, HTML5, CSS, CSS3 and AJAX. These customizations allow you to create dynamic reports and dashboards. You can also add new charts inside the self-service component, add new kind of aggregate functions and customize it using our APIs.
Helical Insight, via simple browser based interface of Canned Reporting module, also allows to create pixel perfect printer friendly document kind of reports also like Invoice, P&L Statement, Balance sheet etc.
If you have a product, built on any platform like Dot Net or Java or PHP or Ruby, you can easily embed Helical Insight within it using iFrames or webservices, for quick value add through instant visualization of data.
Being a 100% browser-based BI tool, you can connect with your database and analyse across any location and device. There is no need to download or install heavy memory-consuming developer tools – All you need is a Browser application! We are battle-tested on most of the commonly used browsers.
We have organization level security where the Superadmin can create, delete and modify roles. Dashboards and reports can be added to that organization. This ensures multitenancy.
A first-of-its-kind Open-Source BI framework, Helical Insight is completely API-driven. This allows you to add functionalities, including but not limited to adding a new exporting type, new datasource type, core functionality expansion, new charting in adhoc etc., at any place whenever you wish, using your own in-house developers.
It handles huge volumes of data effectively. Caching, Pagination, Load-Balancing and In-Memory not only provides you with amazing experience, but also and does not burden the database server more than required. Further effective use of computing power gives best performance and complex calculations even on the big data even with smaller machines for your personal use. Filtering, Sorting, Cube Analysis, Inter Panel Communication on the dashboards all at lightning speed. Thereby, making best open-source Business Intelligence solution in the market.
With advance NLP algorithm, business users simply ask questions like, “show me sales of last quarter”, “average monthly sales of my products”. Let the application give the power to users without knowledge of query language or underlying data architecture
Our application is compatible with almost all databases, be it RDBMS, or columnar database, or even flat files like spreadsheets or csv files. You can even connect to your own custom database via JDBC connection. Further, our database connection can be switched dynamically based on logged in users or its organization or other parameters. So, all your clients can use the same reports and dashboards without worrying about any data security breech.
Our application can be installed on an in-house server where you have full control of your data and its security. Or on cloud where it is accessible to larger audience without overheads and maintenance of the servers. One solution that works for all.
Different companies have different business processes that the existing BI tools do not encompass. Helical Insight permits you to design your own workflows and specify what functional module of BI gets triggered