In this blog, we will learn how to implement Cover page in the canned reporting module of Open Source BI helical Insight. In the future versions of Helical Insight, we are also going to add the options of subreport as well which will make it more simpler.

The cover page serves as the introductory section of the report, providing essential information such as the report title, description, date, author details, and any relevant metadata before the main data section begins

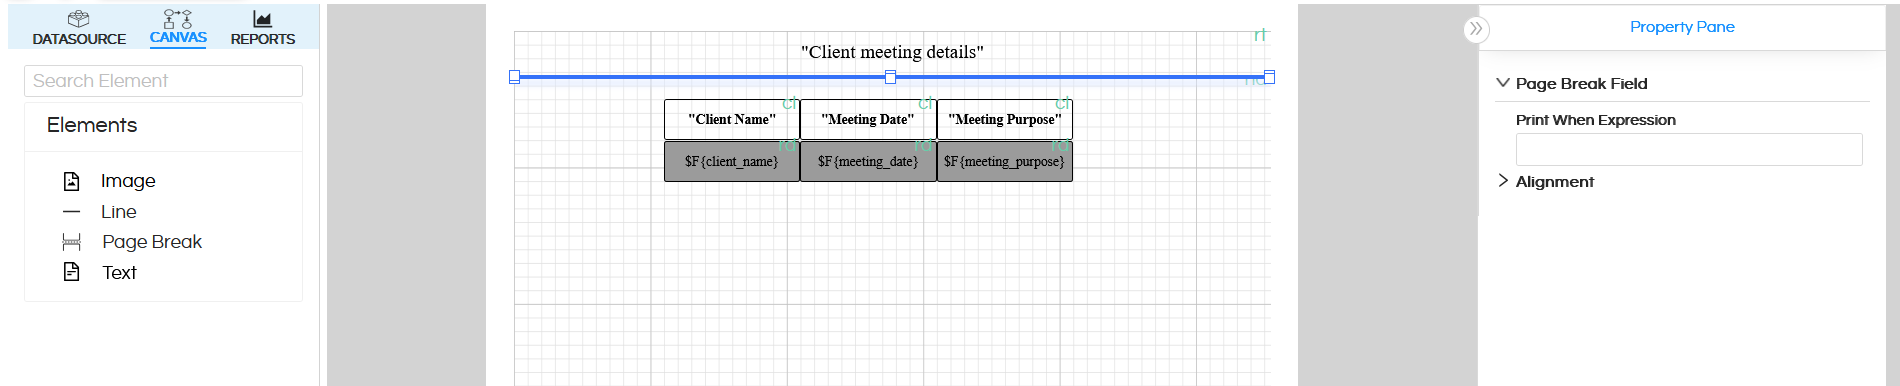
In this setup, all the cover-related information is placed at the top of the report layout.
After the cover page content, we have added a page break from Elements to ensure that the actual data section of the report starts on a new page. After the page break, it contains all the information about the report. Refer the below image

The above created report, when you export, both PDF Excel etc all the exports will have page break. But in many cases what might happen is that we may want page break to only appear in PDF and not in excel. If you have that kind of requirement please read further to understand how to implement the same.

To make the cover page appear only in the appropriate export formats, I created a parameter by clicking the ‘+’ icon.

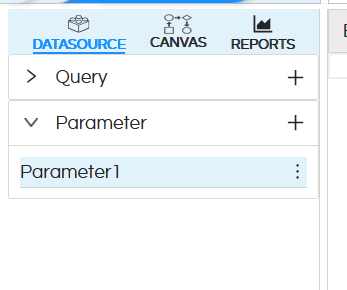
After that, you can edit the parameter name by clicking the three dots — you’ll get an option to edit it.

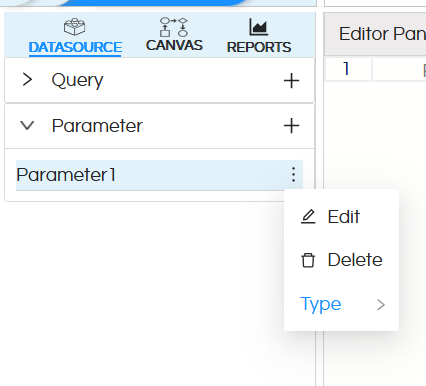
Here, I’ve named my parameter ExportFormat.

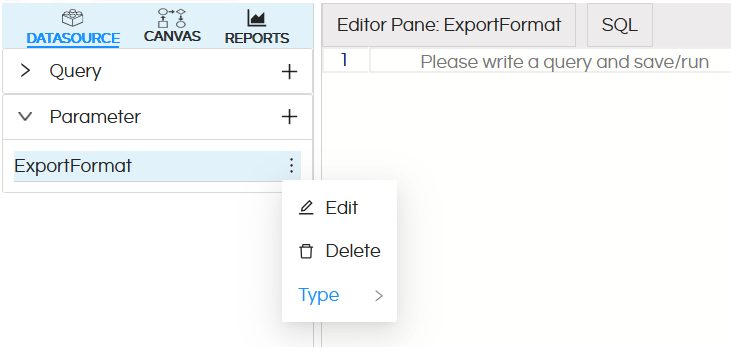
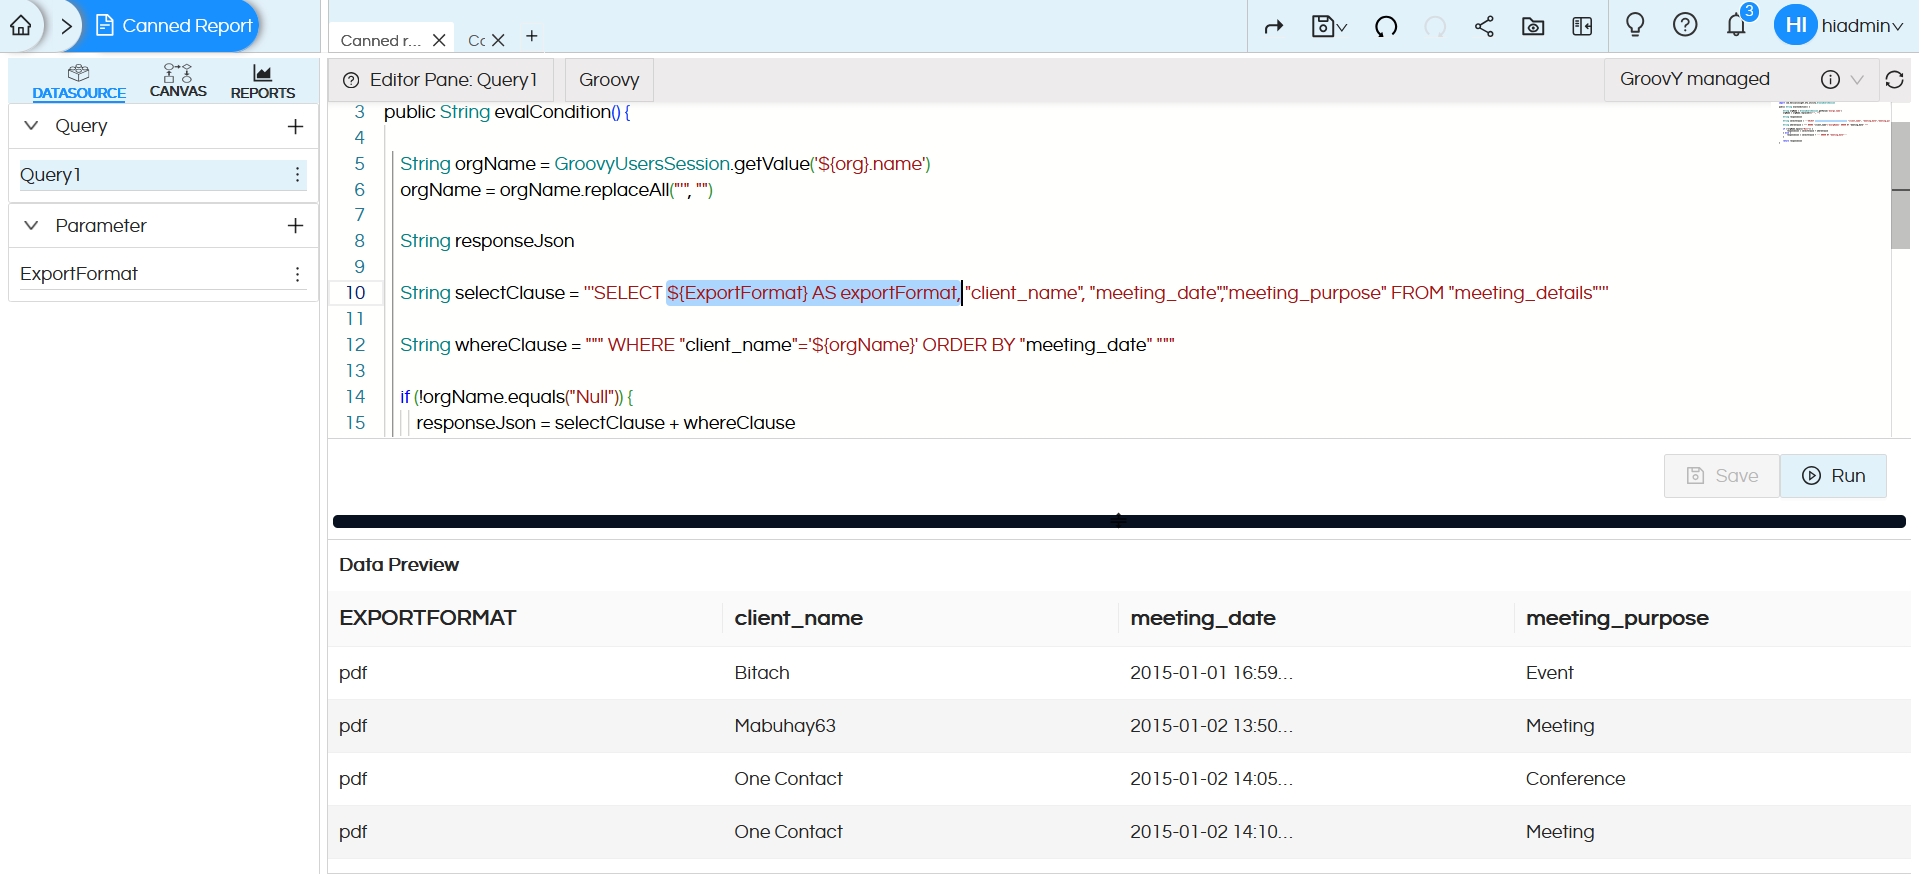
Check the above image — I have added the parameter in the query to make it available in the canvas.

This parameter helps control which parts of the report are displayed, depending on the parameter type.

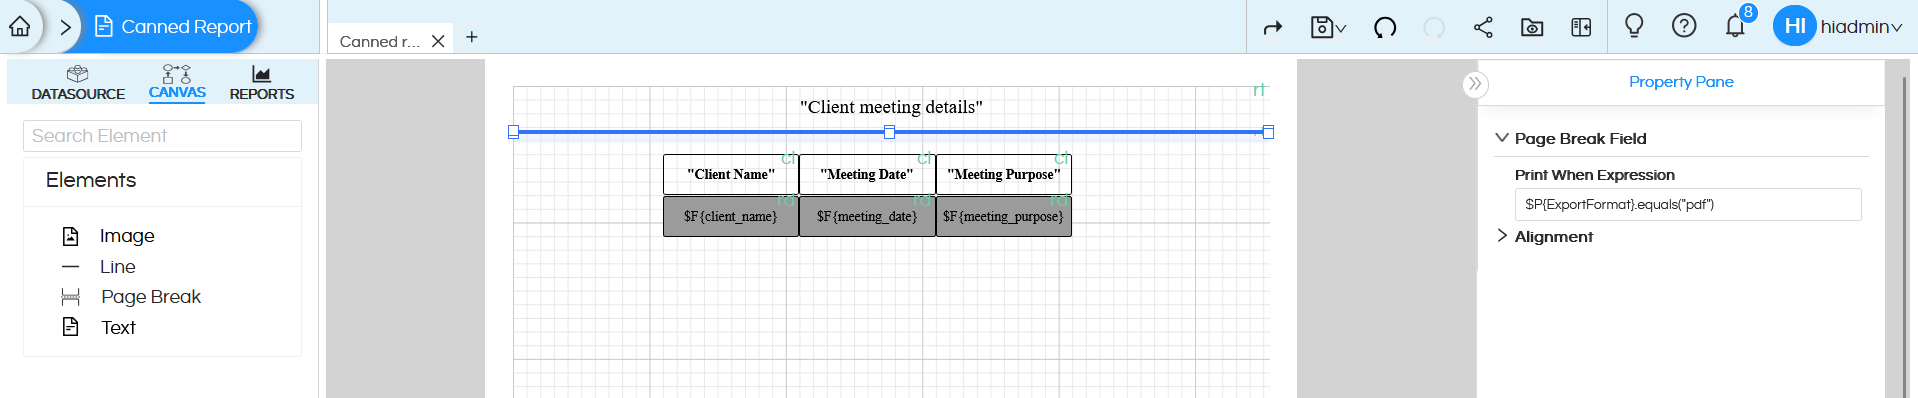
As shown in the image below, I used the condition $P{ExportFormat}.equals("pdf") for the Page Break element and also for the Title. This condition ensures that the cover page — which includes the report title is present when the export happens in PDF format, the cover page is displayed.

When the export format is xlsx, the cover page is hidden, ensuring that Excel outputs contain only the data portion without unnecessary visual elements.

The first page (cover page) displays the report title,
A page break is then applied to separate the content.
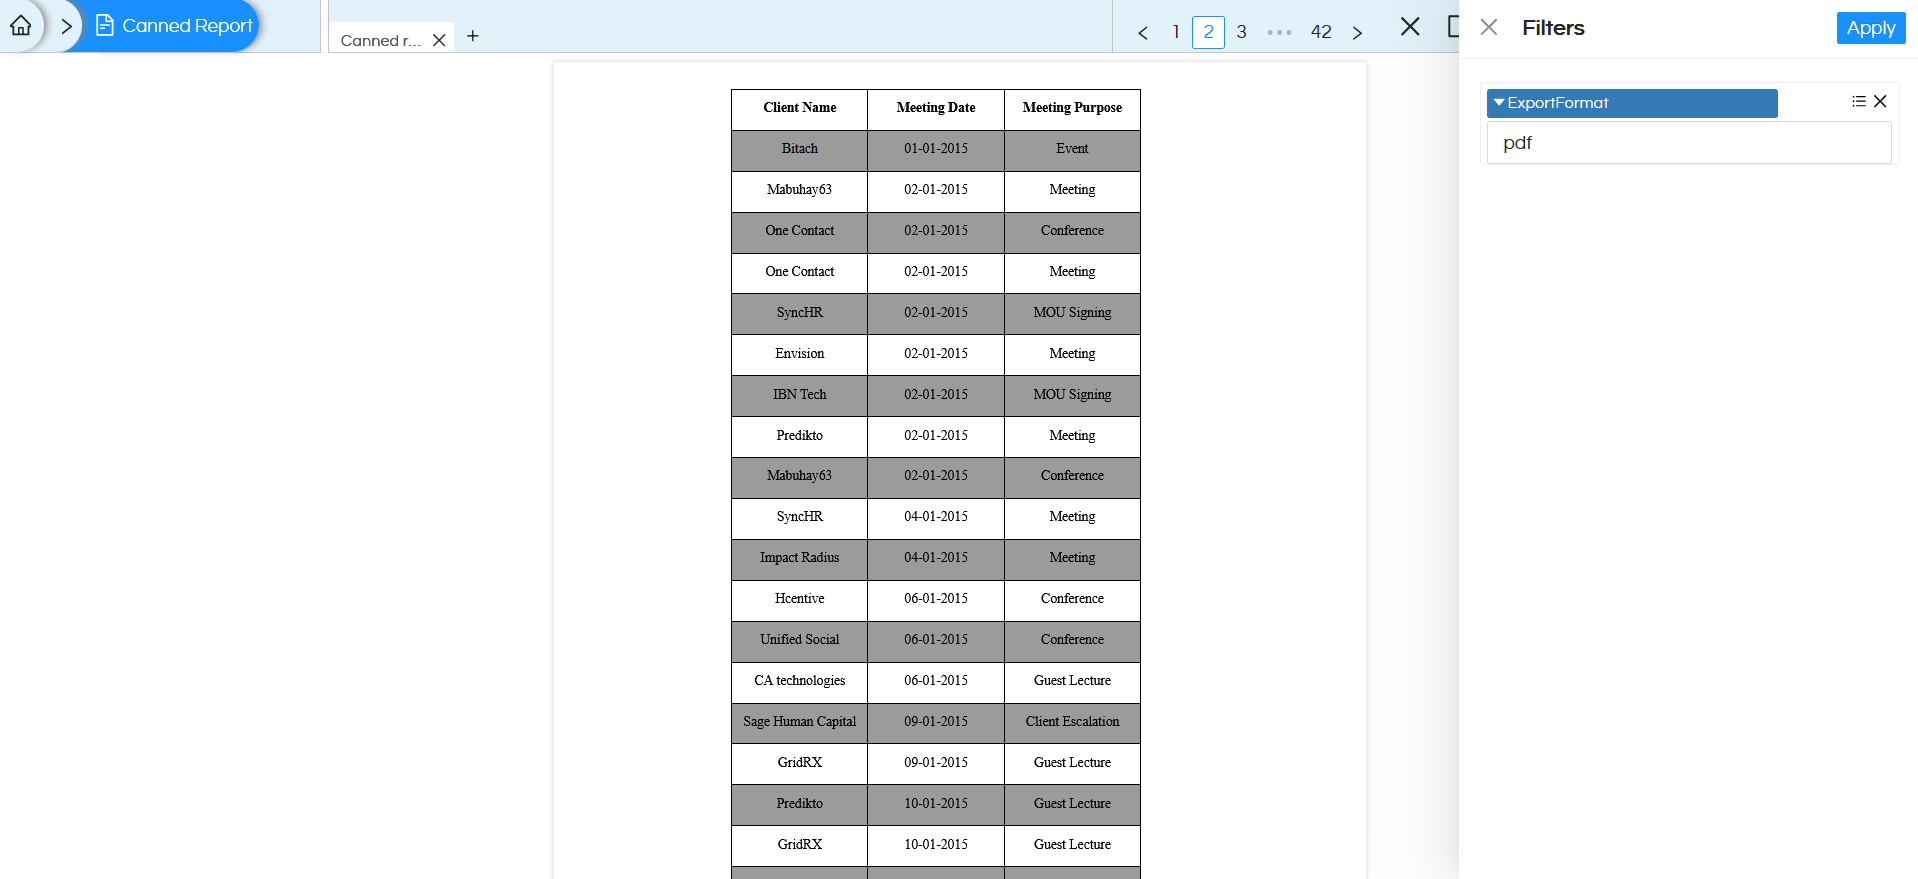
The second page displays the actual report data

After completing the Canvas configuration click on the Preview option to execute and visualize the report.

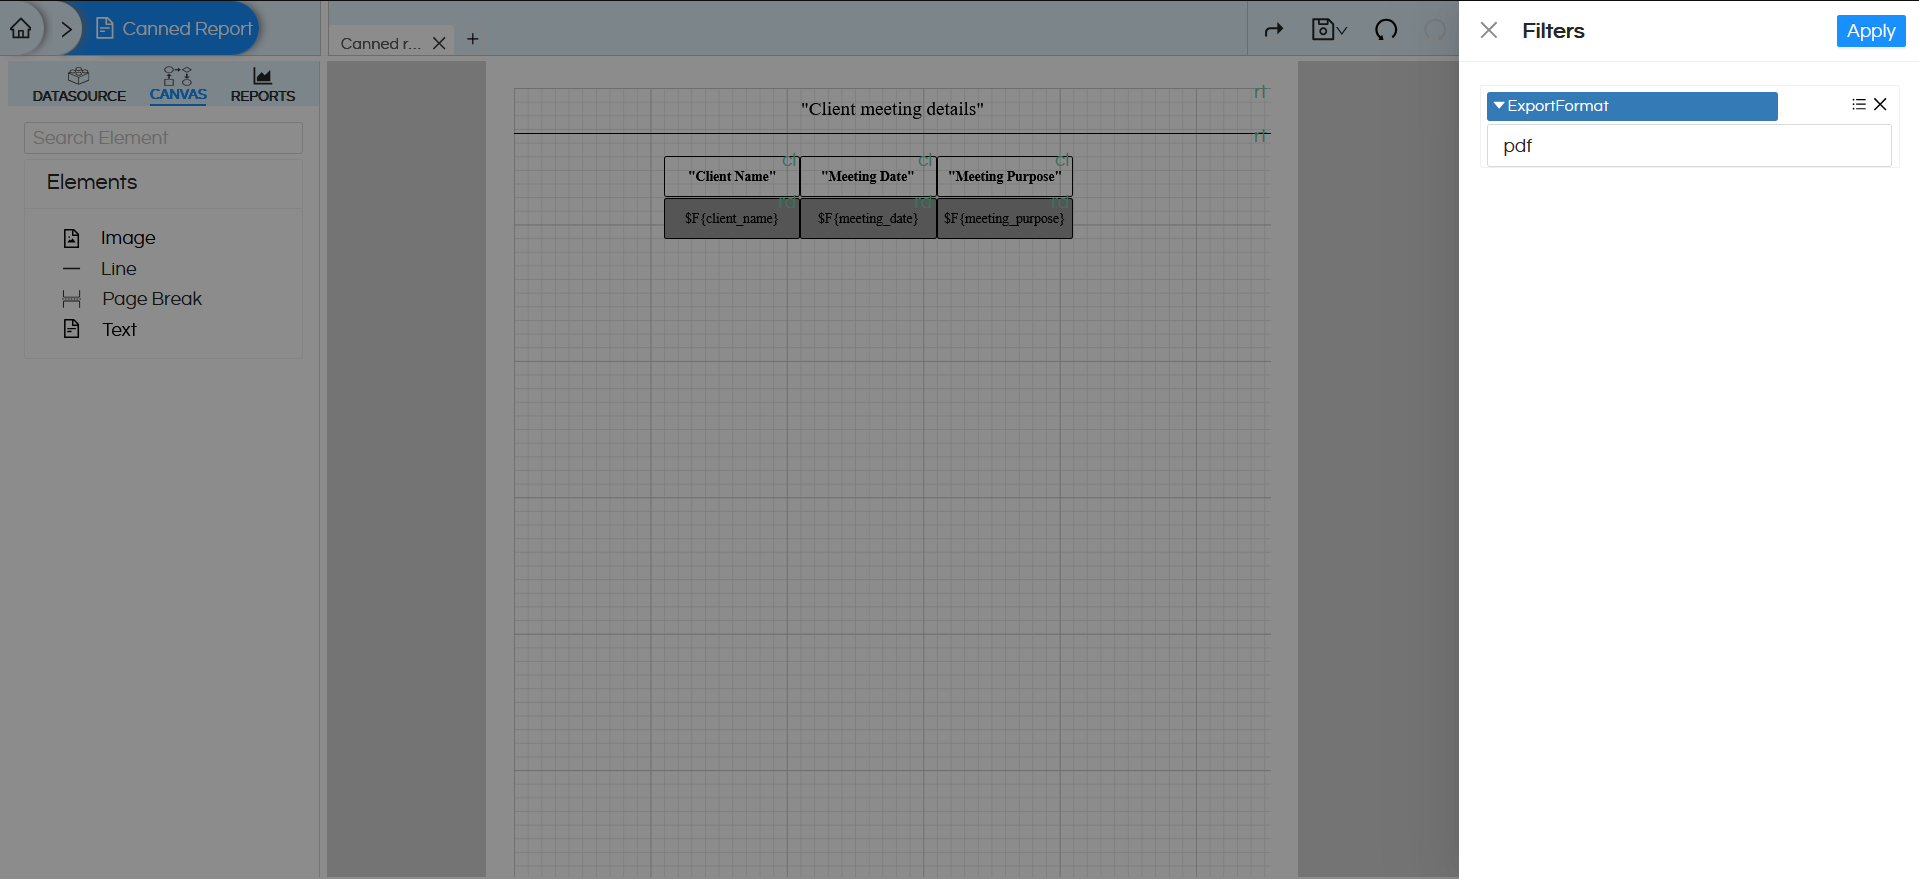
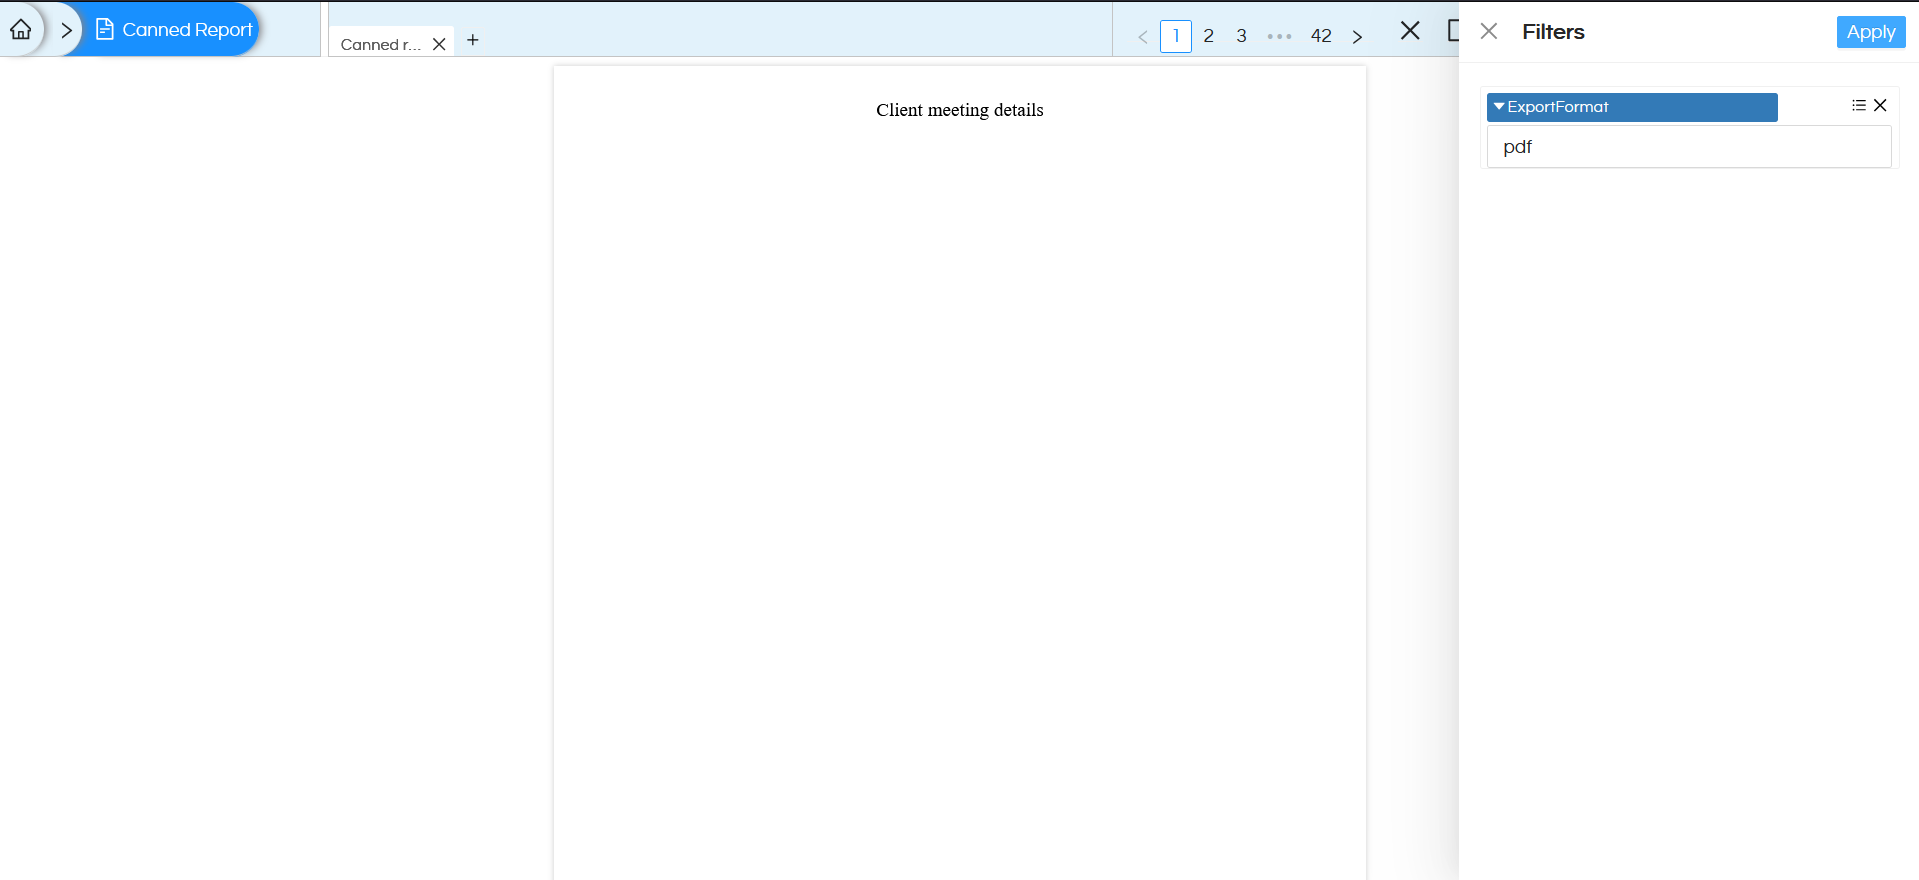
After clicking Preview, the Filter section will appear with the ExportFormat parameter as an input field.
In this step, I entered “pdf” as the export type to verify the Cover Page functionality.

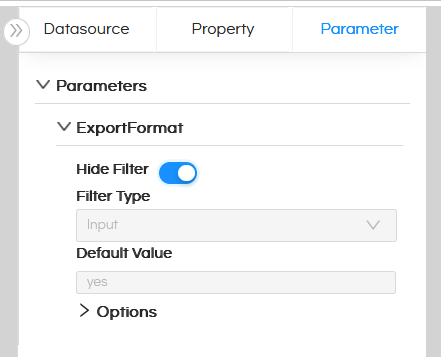
We can also hide the parameter from the user interface by assigning a default value to it.
By setting a default value, the parameter is automatically populated during report execution and does not require manual input from the user.

By passing pdf, the report displays the cover page (containing the title information) on the first page, followed by the data section on the next page.

Overall, the cover page adds a structured and polished look to the report.

It is also possible to pass the filtername and filtervalue, rather than from UI, directly into the report URL as well. Hence here we are passing ExportFormat is PDF or XLS from the UI, rather it can be passed from some other 3rd party application as well, This is helpful when we are implementing embedding. Hence imagine that you have embedded the report in your application, and you can have an export to PDF, export to Excel kind of buttons which can trigger such required exports with required page breaks. Refer here to learn more :
https://www.helicalinsight.com/passing-filter-values-in-url-in-helical-insight/

Leave a Reply

Helical Insight’s self-service capabilities is one to reckon with. It allows you to simply drag and drop columns, add filters, apply aggregate functions if required, and create reports and dashboards on the fly. For advanced users, the self-service component has ability to add javascript, HTML, HTML5, CSS, CSS3 and AJAX. These customizations allow you to create dynamic reports and dashboards. You can also add new charts inside the self-service component, add new kind of aggregate functions and customize it using our APIs.
Helical Insight, via simple browser based interface of Canned Reporting module, also allows to create pixel perfect printer friendly document kind of reports also like Invoice, P&L Statement, Balance sheet etc.
If you have a product, built on any platform like Dot Net or Java or PHP or Ruby, you can easily embed Helical Insight within it using iFrames or webservices, for quick value add through instant visualization of data.
Being a 100% browser-based BI tool, you can connect with your database and analyse across any location and device. There is no need to download or install heavy memory-consuming developer tools – All you need is a Browser application! We are battle-tested on most of the commonly used browsers.
We have organization level security where the Superadmin can create, delete and modify roles. Dashboards and reports can be added to that organization. This ensures multitenancy.
A first-of-its-kind Open-Source BI framework, Helical Insight is completely API-driven. This allows you to add functionalities, including but not limited to adding a new exporting type, new datasource type, core functionality expansion, new charting in adhoc etc., at any place whenever you wish, using your own in-house developers.
It handles huge volumes of data effectively. Caching, Pagination, Load-Balancing and In-Memory not only provides you with amazing experience, but also and does not burden the database server more than required. Further effective use of computing power gives best performance and complex calculations even on the big data even with smaller machines for your personal use. Filtering, Sorting, Cube Analysis, Inter Panel Communication on the dashboards all at lightning speed. Thereby, making best open-source Business Intelligence solution in the market.
With advance NLP algorithm, business users simply ask questions like, “show me sales of last quarter”, “average monthly sales of my products”. Let the application give the power to users without knowledge of query language or underlying data architecture
Our application is compatible with almost all databases, be it RDBMS, or columnar database, or even flat files like spreadsheets or csv files. You can even connect to your own custom database via JDBC connection. Further, our database connection can be switched dynamically based on logged in users or its organization or other parameters. So, all your clients can use the same reports and dashboards without worrying about any data security breech.
Our application can be installed on an in-house server where you have full control of your data and its security. Or on cloud where it is accessible to larger audience without overheads and maintenance of the servers. One solution that works for all.
Different companies have different business processes that the existing BI tools do not encompass. Helical Insight permits you to design your own workflows and specify what functional module of BI gets triggered