In this blog we will learn how to create a Point Chart in Open Source BI product Helical Insight. A point chart can also be converted into bubble chart.

To create a Point chart, you need one dimension and one measure.

In this example:

  • The dimension mode_of_payment is placed in the Columns section.
  • The measure sum_travel_cost is placed in the Rows section.

After placing these fields, select the Point option from the Chart section in the Visualization panel.

How to create a Point Chart

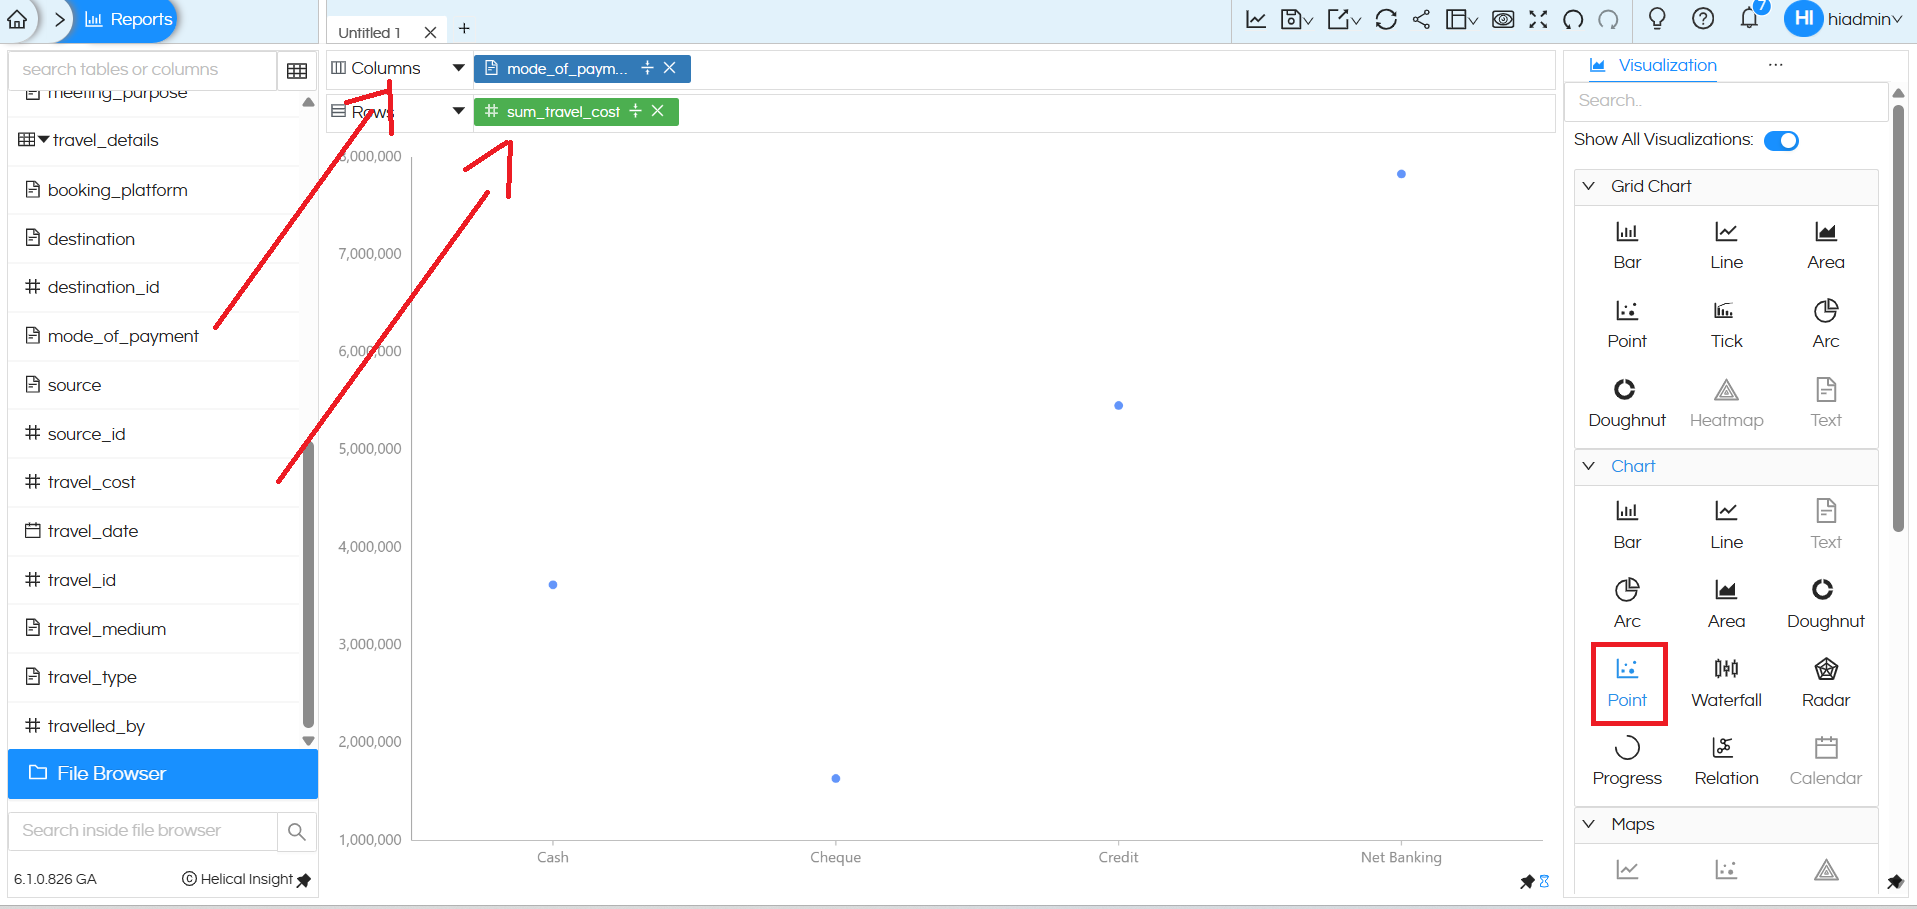
The chart then displays individual data points, where each point represents a category of the dimension, and its position on the Y-axis indicates the corresponding measure value. Point charts are useful for simple comparisons and spotting variations or outliers across categories.

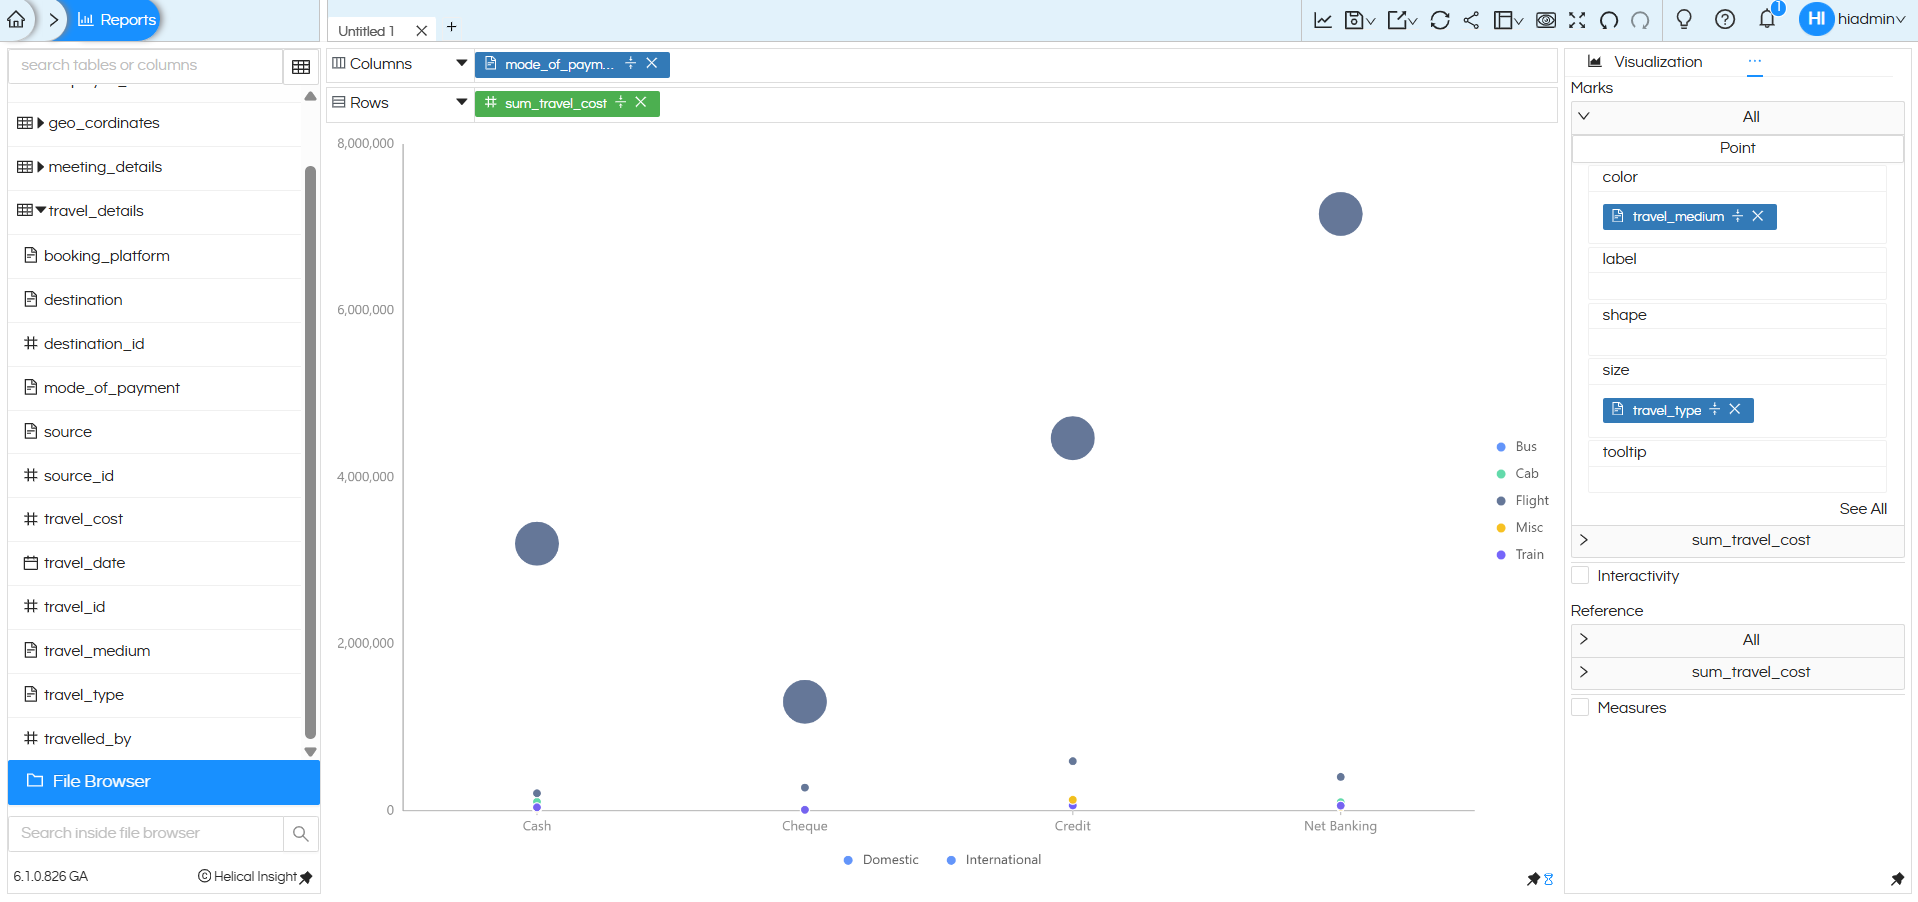
Converting Point Chart into Bubble Chart (Using Size)

In the example shown, the dimension travel_type (Domestic and International) is added to the Size option and travel_medium is added to Color in the Marks section.

Once a field is added to Size:

  • The simple points expand into circles (bubbles).
  • The size of each bubble represents the value distribution of the Size field.
  • Larger bubbles indicate higher aggregated values, while smaller bubbles represent lower values.
  • The information is also reflected in the Tooltip when hovering over the bubble.

Now the visualization represents multiple layers of information:

  • X-axis → mode_of_payment
  • Y-axis → sum_travel_cost
  • Color → travel_medium
  • Size → travel_type (Domestic / International)

This effectively converts the Point chart into a Bubble Chart, enabling richer multi-dimensional analysis while keeping the chart clean and intuitive.

How to create a Point Chart

Point/Bubble Chart Created using “Chart” Category:

A Point /bubble chart created using chart category can have one dimension in the columns, one measure and a dimension/measure in the colors section.

It will not be able to support multiple dimensions in rows and columns.

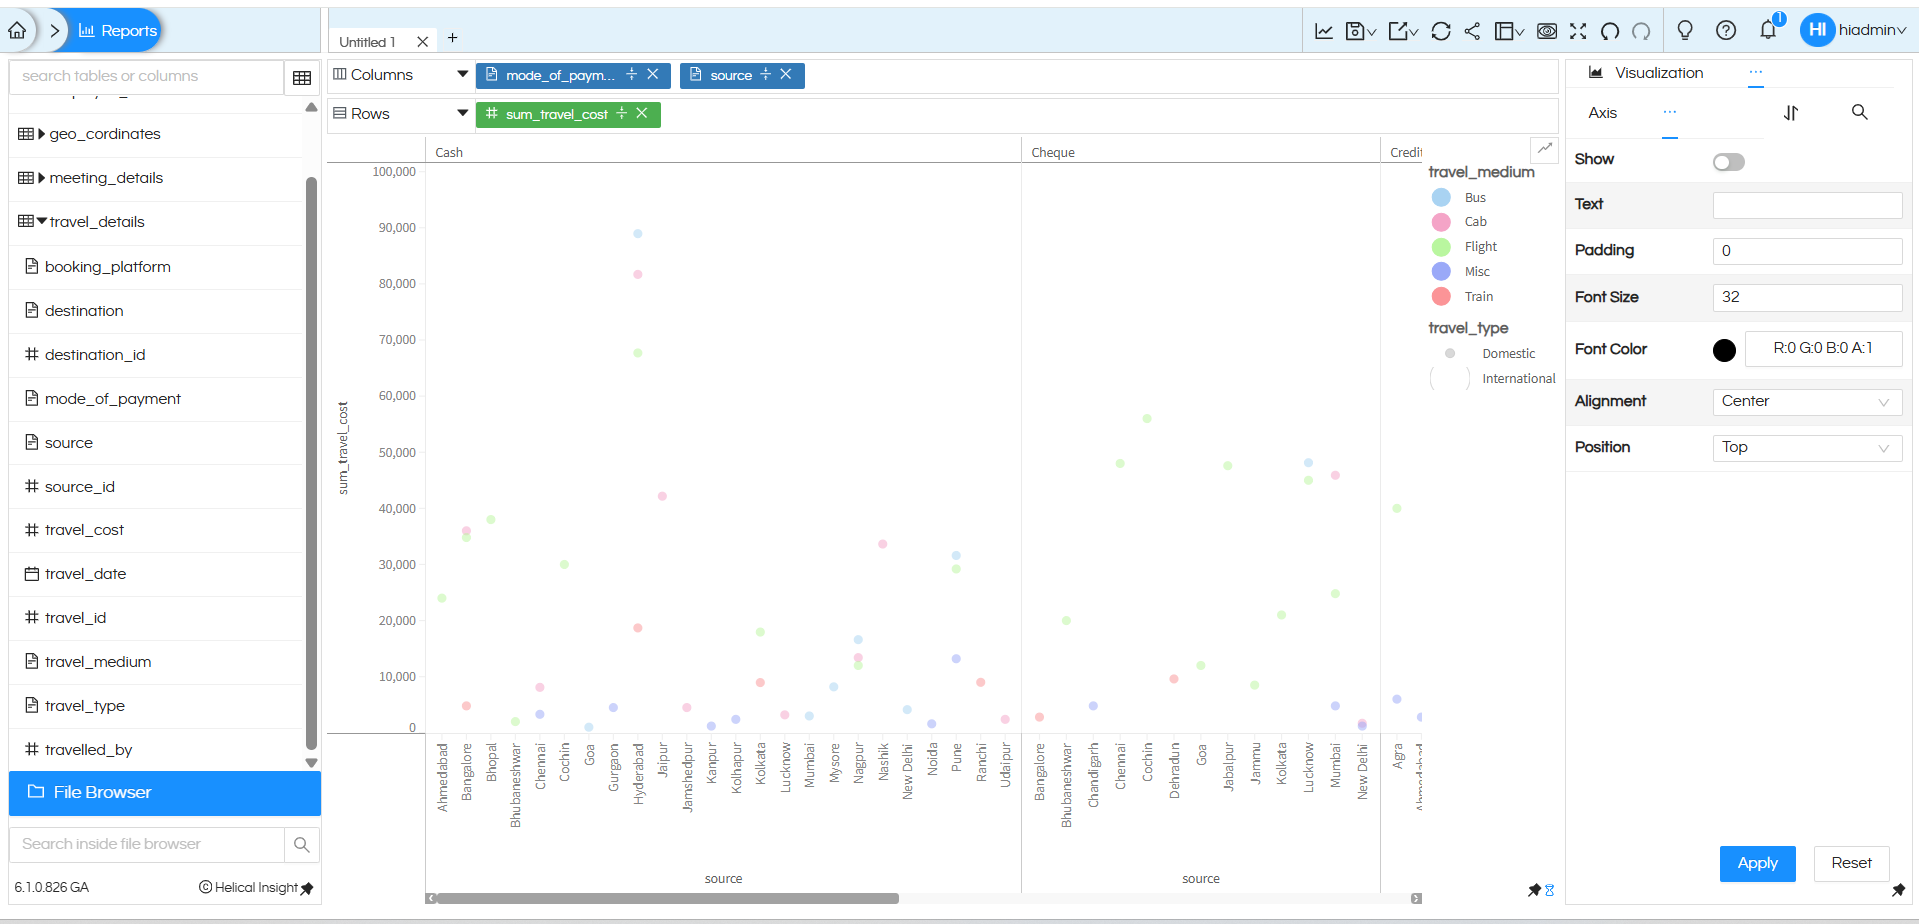
Point /Bubble Chart created using Grid Chart:

A Point/bubble chart created using Grid chart category is highly flexible. It can allow users to drag any number of dimensions in both rows and columns, and accordingly it creates a sort of matrix within which the Point/bubble chart gets populated. Thus it is much more flexible.

In this example, additional dimensions such as mode_of_payment and source are added along with the measure sum_travel_cost, and the Grid Chart Point option is selected.

Here, mode_of_payment and source are placed in the Columns section, and sum_travel_cost is placed in the Rows section. After selecting the Point option from the Grid Chart section in the Visualization panel, the system generates a grid-style point chart.

This creates a layout where the chart is divided into separate panels based on mode_of_payment (Cash, Cheque, Credit, etc.). Within each panel, points are plotted for different source values on the X-axis, and the Y-axis represents the total travel cost.

In this example:

  • The dimension travel_medium is added to the Color option in the Marks section.
  • The dimension travel_type is added to the Size option.

How to create a Point Chart

There are many other customizations available such as color palette, labels, axis formatting, drill down, drill through, caching, etc. You can refer to our other blogs to learn more about these features.

Reach out on support@helicalinsight.com in case of any more questions.

Leave a Reply

Helical Insight’s self-service capabilities is one to reckon with. It allows you to simply drag and drop columns, add filters, apply aggregate functions if required, and create reports and dashboards on the fly. For advanced users, the self-service component has ability to add javascript, HTML, HTML5, CSS, CSS3 and AJAX. These customizations allow you to create dynamic reports and dashboards. You can also add new charts inside the self-service component, add new kind of aggregate functions and customize it using our APIs.
Helical Insight, via simple browser based interface of Canned Reporting module, also allows to create pixel perfect printer friendly document kind of reports also like Invoice, P&L Statement, Balance sheet etc.
If you have a product, built on any platform like Dot Net or Java or PHP or Ruby, you can easily embed Helical Insight within it using iFrames or webservices, for quick value add through instant visualization of data.
Being a 100% browser-based BI tool, you can connect with your database and analyse across any location and device. There is no need to download or install heavy memory-consuming developer tools – All you need is a Browser application! We are battle-tested on most of the commonly used browsers.
We have organization level security where the Superadmin can create, delete and modify roles. Dashboards and reports can be added to that organization. This ensures multitenancy.
A first-of-its-kind Open-Source BI framework, Helical Insight is completely API-driven. This allows you to add functionalities, including but not limited to adding a new exporting type, new datasource type, core functionality expansion, new charting in adhoc etc., at any place whenever you wish, using your own in-house developers.
It handles huge volumes of data effectively. Caching, Pagination, Load-Balancing and In-Memory not only provides you with amazing experience, but also and does not burden the database server more than required. Further effective use of computing power gives best performance and complex calculations even on the big data even with smaller machines for your personal use. Filtering, Sorting, Cube Analysis, Inter Panel Communication on the dashboards all at lightning speed. Thereby, making best open-source Business Intelligence solution in the market.
With advance NLP algorithm, business users simply ask questions like, “show me sales of last quarter”, “average monthly sales of my products”. Let the application give the power to users without knowledge of query language or underlying data architecture
Our application is compatible with almost all databases, be it RDBMS, or columnar database, or even flat files like spreadsheets or csv files. You can even connect to your own custom database via JDBC connection. Further, our database connection can be switched dynamically based on logged in users or its organization or other parameters. So, all your clients can use the same reports and dashboards without worrying about any data security breech.
Our application can be installed on an in-house server where you have full control of your data and its security. Or on cloud where it is accessible to larger audience without overheads and maintenance of the servers. One solution that works for all.
Different companies have different business processes that the existing BI tools do not encompass. Helical Insight permits you to design your own workflows and specify what functional module of BI gets triggered