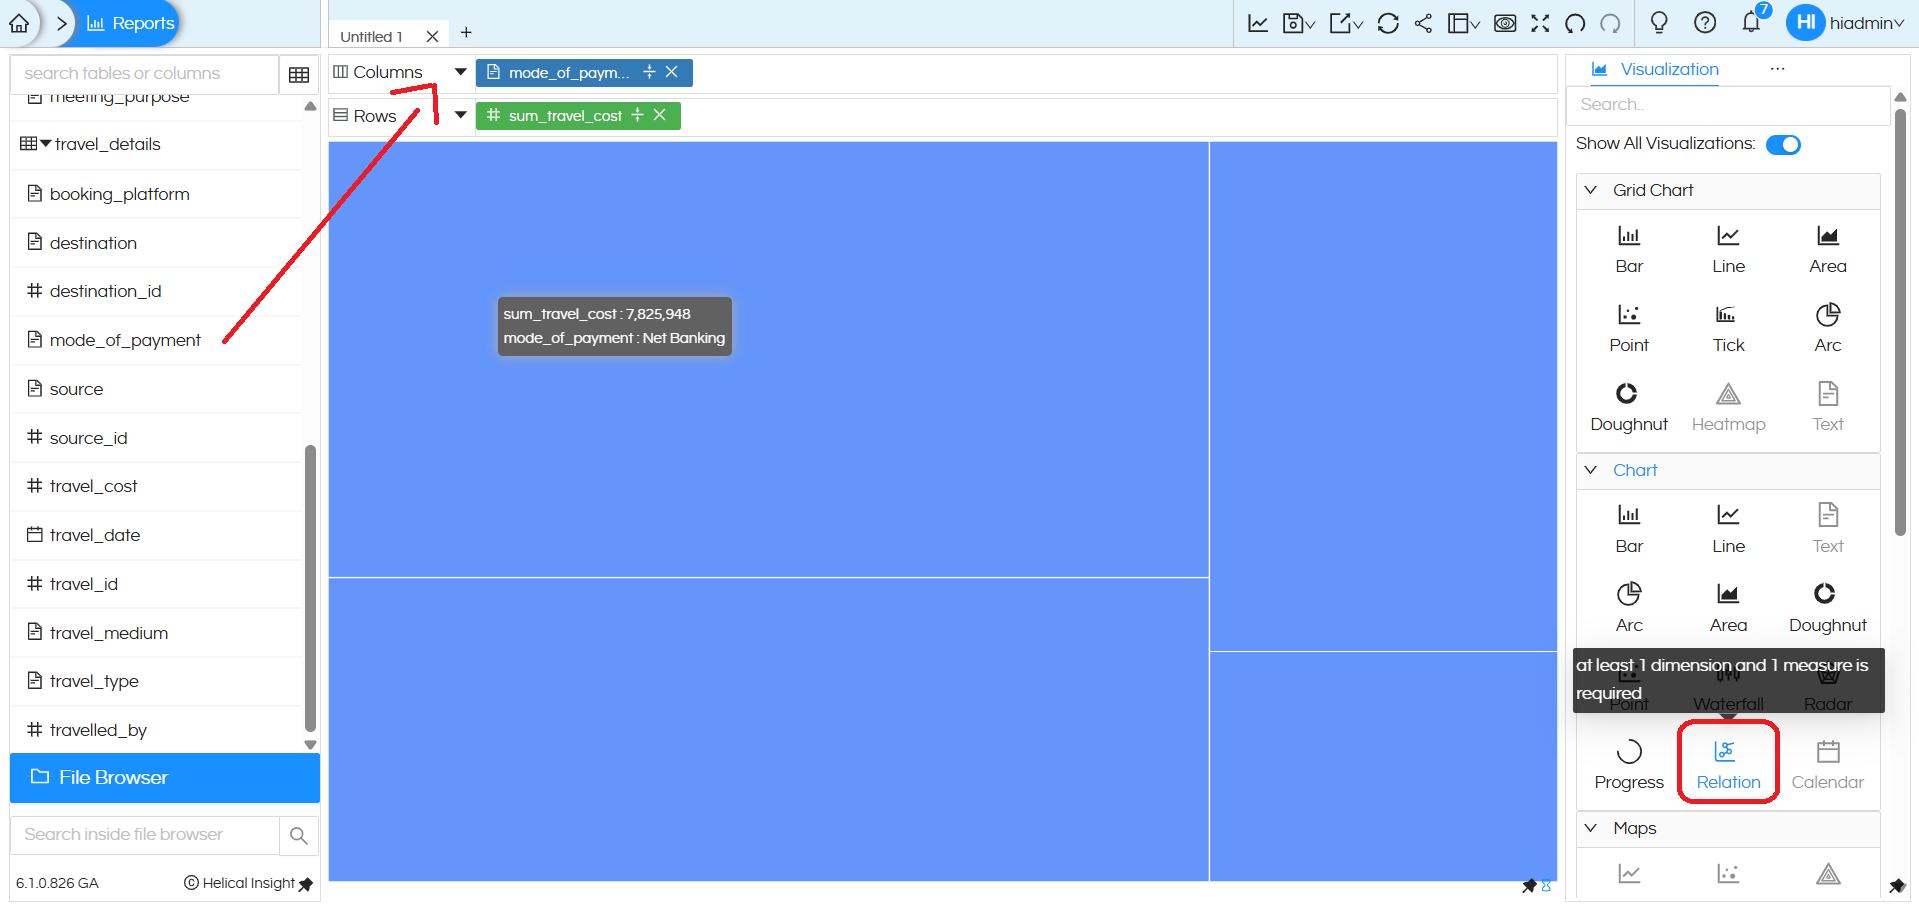
In this blog, we will learn how to use the Relation chart in Open Source BI Helical Insight. This relation chart can allow you to create charts like Treemap chart (default), Sunburst Chart, Sankey Chart and Circle Packing charts.
To create a Relation chart, you need to drag at least one dimension and one measure into the Columns and Rows sections. After placing the required fields, go to the Chart section in the Visualization panel and select the Relation chart option. The Relation chart visually represents how different dimensions are related to each other based on the selected measure, using proportional blocks and color segmentation. Please note that the Relation chart option is available only under the Chart section and not under Grid Charts, making it suitable for showing relationships in a single consolidated view.
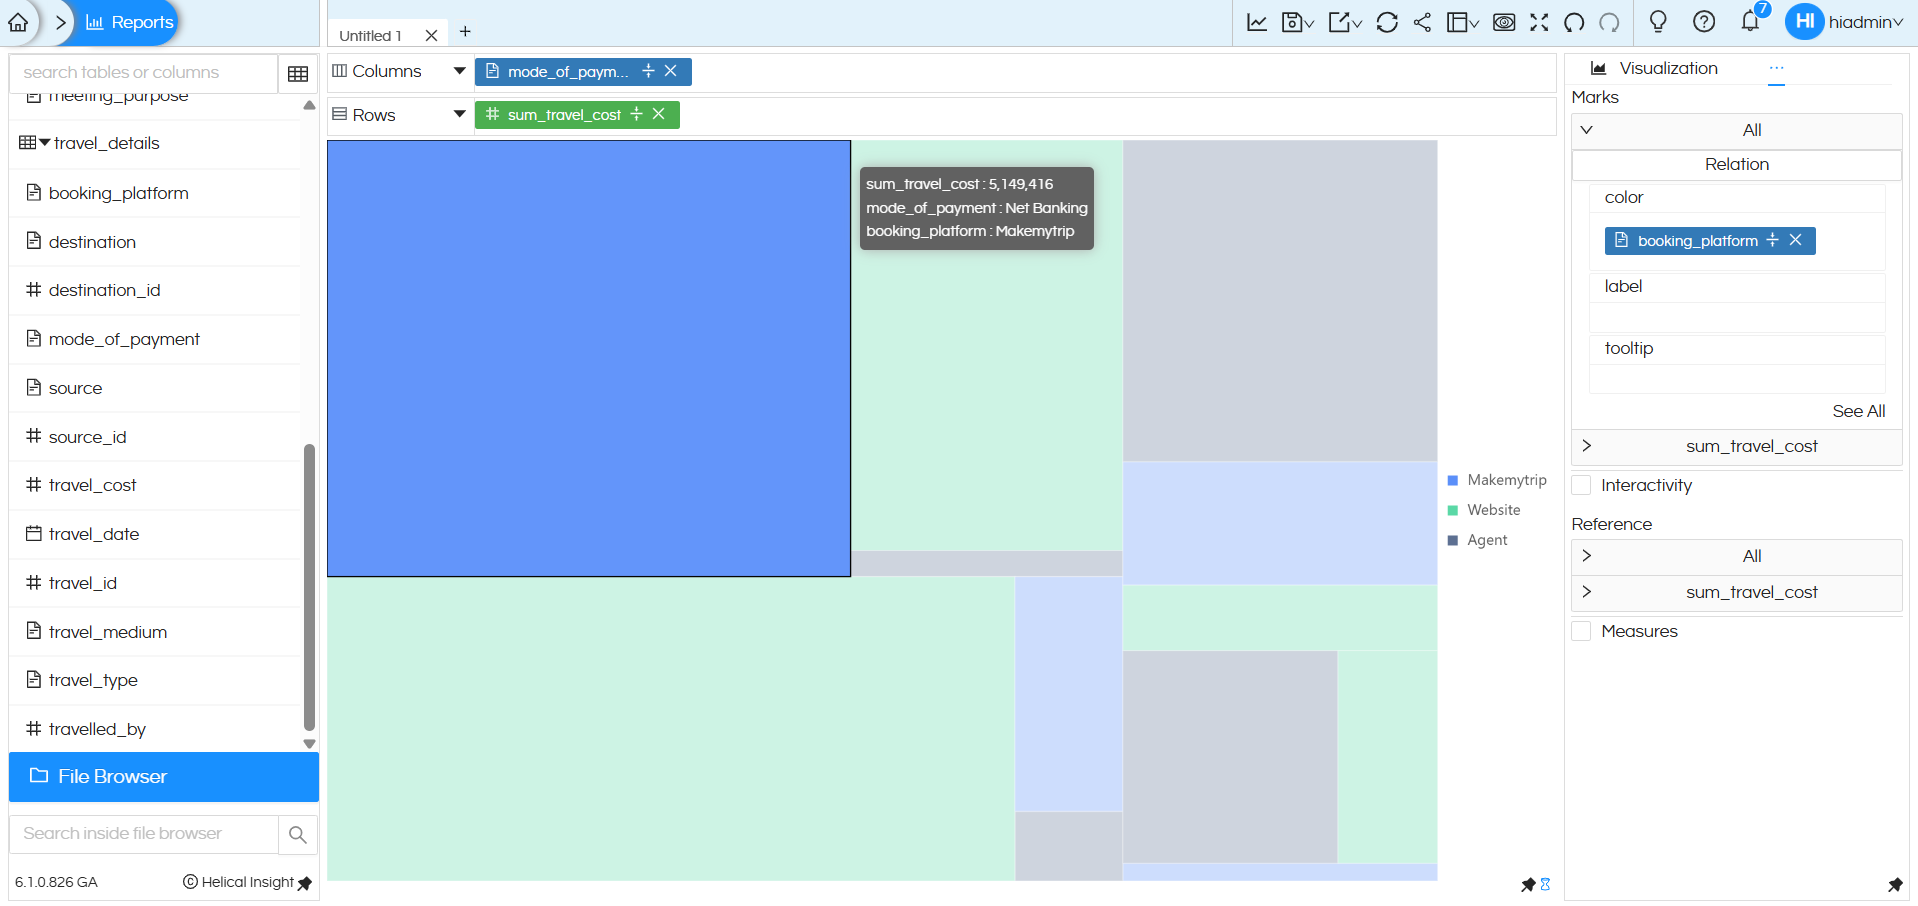
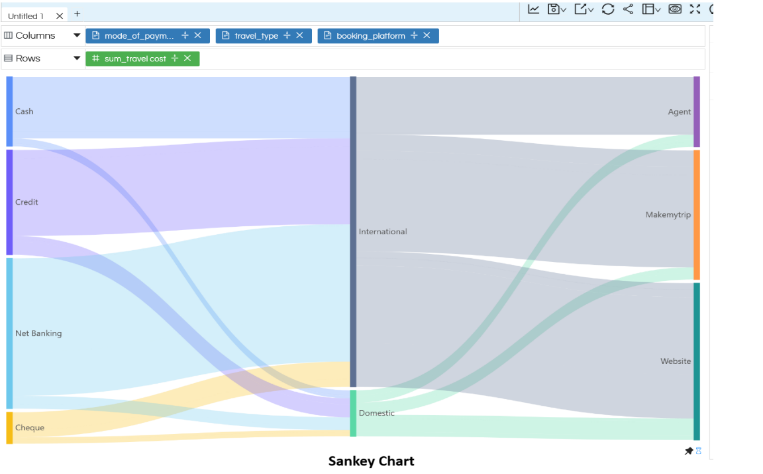
In this Relation chart, adding a field to the Marks section further enhances how relationships are displayed.
In this example, the dimension booking_platform is added to the Color option under Marks. Because of this:
- Each rectangular block in the Relation chart is color-coded by booking platform (Agent, Makemytrip, Website).
- The size of each block represents the value of the measure sum_travel_cost.
- The chart now clearly shows how the total travel cost is distributed across payment modes and booking platforms in a single view.
Using the Marks → Color option helps users visually distinguish categories, making it easier to compare contributions and understand the relationships between multiple dimensions without changing the underlying structure of the Relation chart.
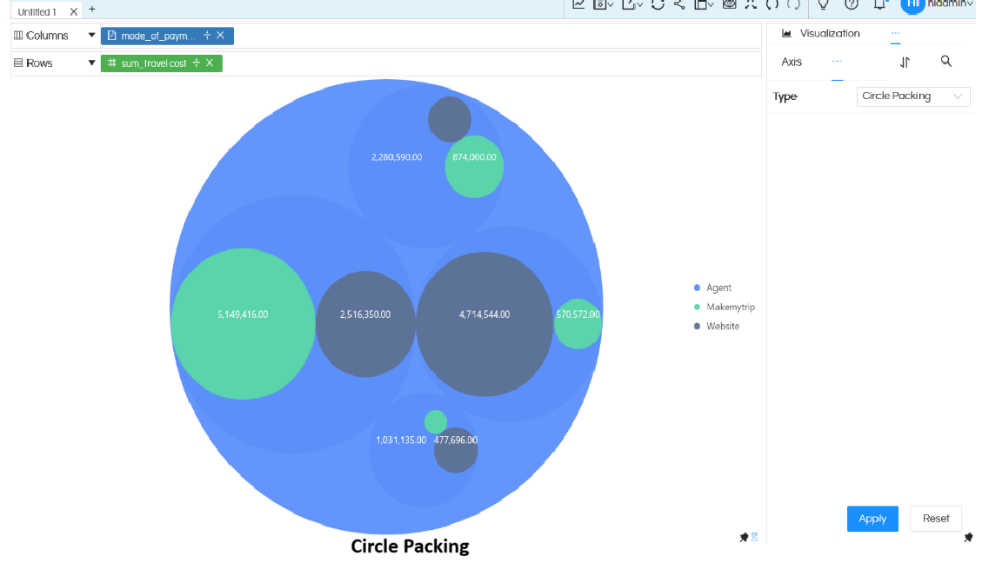
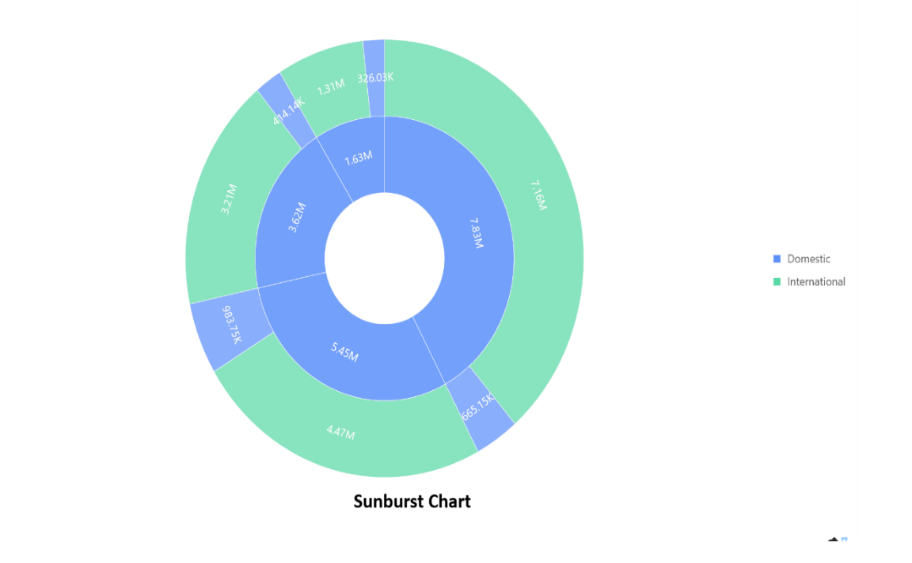
By default when we click on Relation chart, it creates Treemap. However this can also be converted into other charting options like Sunburst Chart, Sankey Chart, Treemap charts and Circle Packing charts. Please refer to the below link to learn about that.
https://www.helicalinsight.com/usage-of-relation-charts/ (need to change first photos in this link)
There are a lot of other customizations like color palette, data format, caching, axis, drill down, drill through etc which can also be used. You can refer to our other blogs to learn about the same.
Reach out to us on support@helicalinsight.com in case of any more questions.
