In Open Source BI Helical Insight, the Shape property in map charts is used to control how data points (locations) are visually represented. This helps in differentiating data clearly on the map using various shapes.

How to Access the Shape Property

To access the Shape property in a map chart:

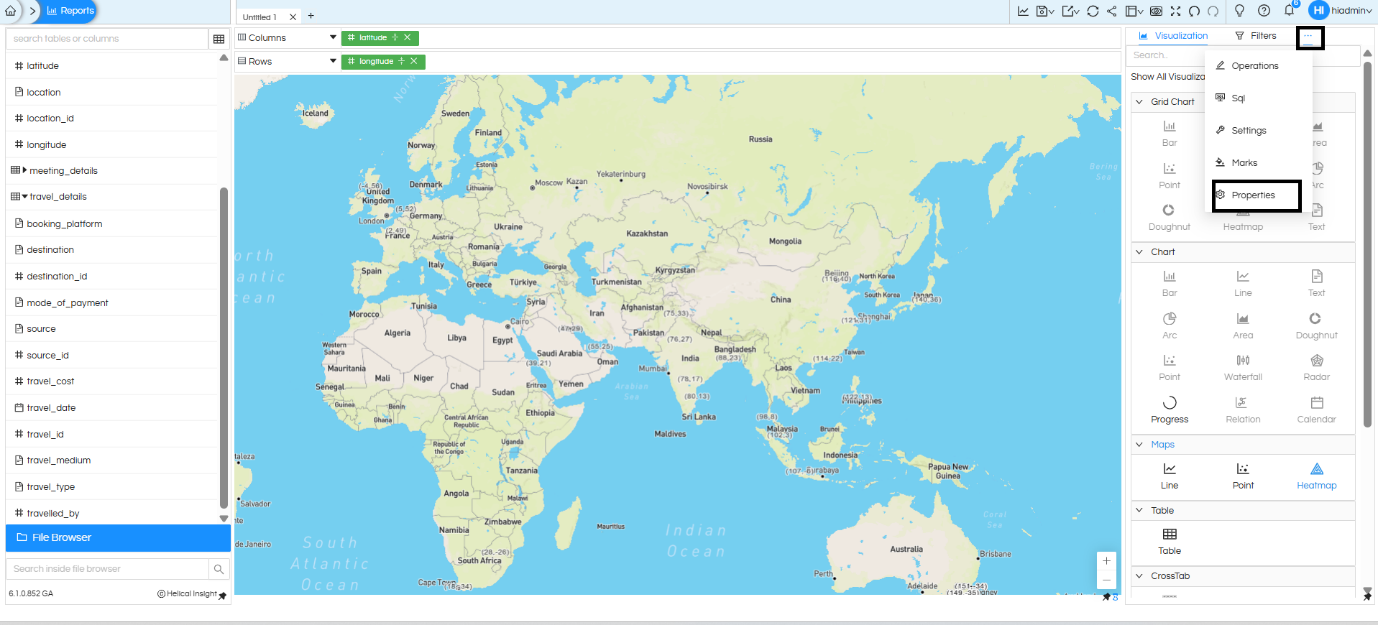
  • Hover on the Meatball icon (three dots) beside the Filters option and click on Properties.
  • Usage of Shapes in Maps

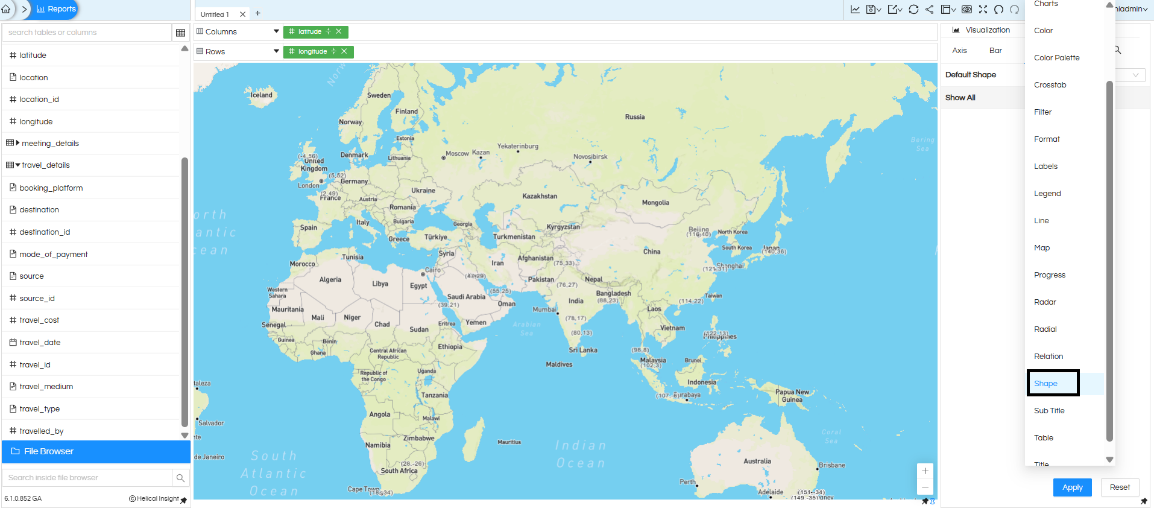
  • In the Properties panel, locate the Bar section.
  • Hover on the Meatball icon beside Bar.
  • From the options, select Shape.
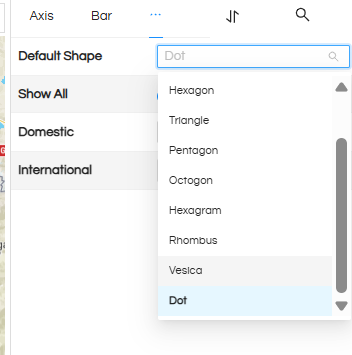
  • Usage of Shapes in Maps

Default Shape

The Default Shape option allows you to set a common shape for all data points in the map.

If no Shape field is added in the Marks section, the selected default shape (such as Dot, Triangle, Hexagon, etc.) will be applied to all points.

View this video to get idea about Marks: https://www.youtube.com/watch?v=O_RG0W-l01M&t=33s

However, if a Shape field is used in Marks, then the Default Shape setting will be ignored, and shapes will be assigned based on the data.
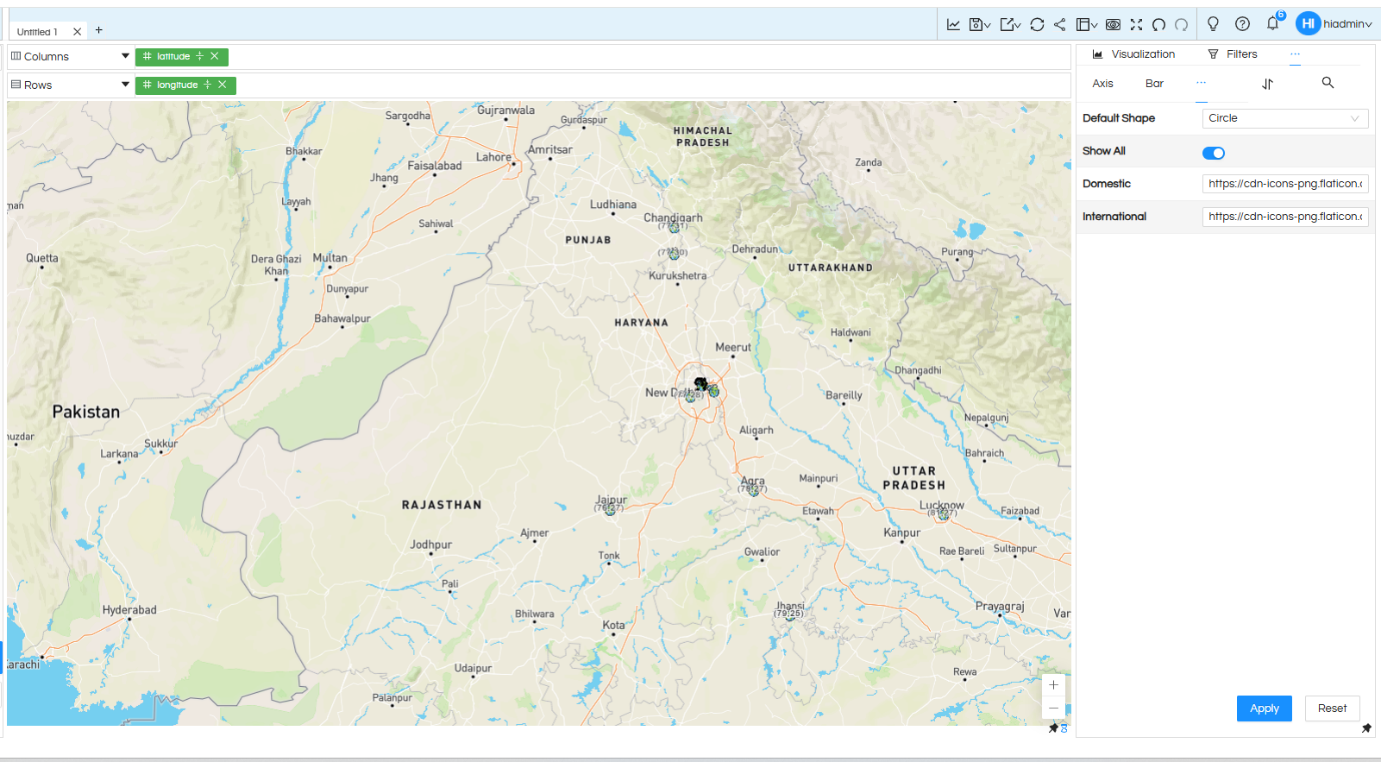
Usage of Shapes in Maps

Show All

The Show All option is used to display all possible values from the Shape field in the map visualization.

To use this feature, you must enable the Show All toggle. Once enabled, all shape categories will be displayed, even if some data points are not present in the dataset.

There are a few important conditions:

  • URLs must be provided for all values in the Shape field.
  • If any value is missing a URL, the report will not generate properly.
  • After adding or updating URLs, the report must be regenerated for the changes to take effect.
  • Usage of Shapes in Maps

Summary

The Shape property enhances map visualization by allowing either a uniform shape across all data points using Default Shape or a categorized representation using the Shape field. The Show All option ensures complete visibility of all categories but requires proper configuration, including providing URLs for every value and regenerating the report.

Leave a Reply

Helical Insight’s self-service capabilities is one to reckon with. It allows you to simply drag and drop columns, add filters, apply aggregate functions if required, and create reports and dashboards on the fly. For advanced users, the self-service component has ability to add javascript, HTML, HTML5, CSS, CSS3 and AJAX. These customizations allow you to create dynamic reports and dashboards. You can also add new charts inside the self-service component, add new kind of aggregate functions and customize it using our APIs.
Helical Insight, via simple browser based interface of Canned Reporting module, also allows to create pixel perfect printer friendly document kind of reports also like Invoice, P&L Statement, Balance sheet etc.
If you have a product, built on any platform like Dot Net or Java or PHP or Ruby, you can easily embed Helical Insight within it using iFrames or webservices, for quick value add through instant visualization of data.
Being a 100% browser-based BI tool, you can connect with your database and analyse across any location and device. There is no need to download or install heavy memory-consuming developer tools – All you need is a Browser application! We are battle-tested on most of the commonly used browsers.
We have organization level security where the Superadmin can create, delete and modify roles. Dashboards and reports can be added to that organization. This ensures multitenancy.
A first-of-its-kind Open-Source BI framework, Helical Insight is completely API-driven. This allows you to add functionalities, including but not limited to adding a new exporting type, new datasource type, core functionality expansion, new charting in adhoc etc., at any place whenever you wish, using your own in-house developers.
It handles huge volumes of data effectively. Caching, Pagination, Load-Balancing and In-Memory not only provides you with amazing experience, but also and does not burden the database server more than required. Further effective use of computing power gives best performance and complex calculations even on the big data even with smaller machines for your personal use. Filtering, Sorting, Cube Analysis, Inter Panel Communication on the dashboards all at lightning speed. Thereby, making best open-source Business Intelligence solution in the market.
With advance NLP algorithm, business users simply ask questions like, “show me sales of last quarter”, “average monthly sales of my products”. Let the application give the power to users without knowledge of query language or underlying data architecture
Our application is compatible with almost all databases, be it RDBMS, or columnar database, or even flat files like spreadsheets or csv files. You can even connect to your own custom database via JDBC connection. Further, our database connection can be switched dynamically based on logged in users or its organization or other parameters. So, all your clients can use the same reports and dashboards without worrying about any data security breech.
Our application can be installed on an in-house server where you have full control of your data and its security. Or on cloud where it is accessible to larger audience without overheads and maintenance of the servers. One solution that works for all.
Different companies have different business processes that the existing BI tools do not encompass. Helical Insight permits you to design your own workflows and specify what functional module of BI gets triggered