In this document we have covered a use case wherein you can provide a drop down to an end user. Based on the values that he selects there, only those reports becomes visible in the dashboard.
Implementation Steps:
1. When creating the dashboard, set up placeholders for the reports you want to display.
2. The number of reports visible at a time is determined by the number of placeholders you configure.
3. Open the dashboard in edit mode, right-click on an empty area, select Add, and then choose HTML from the options
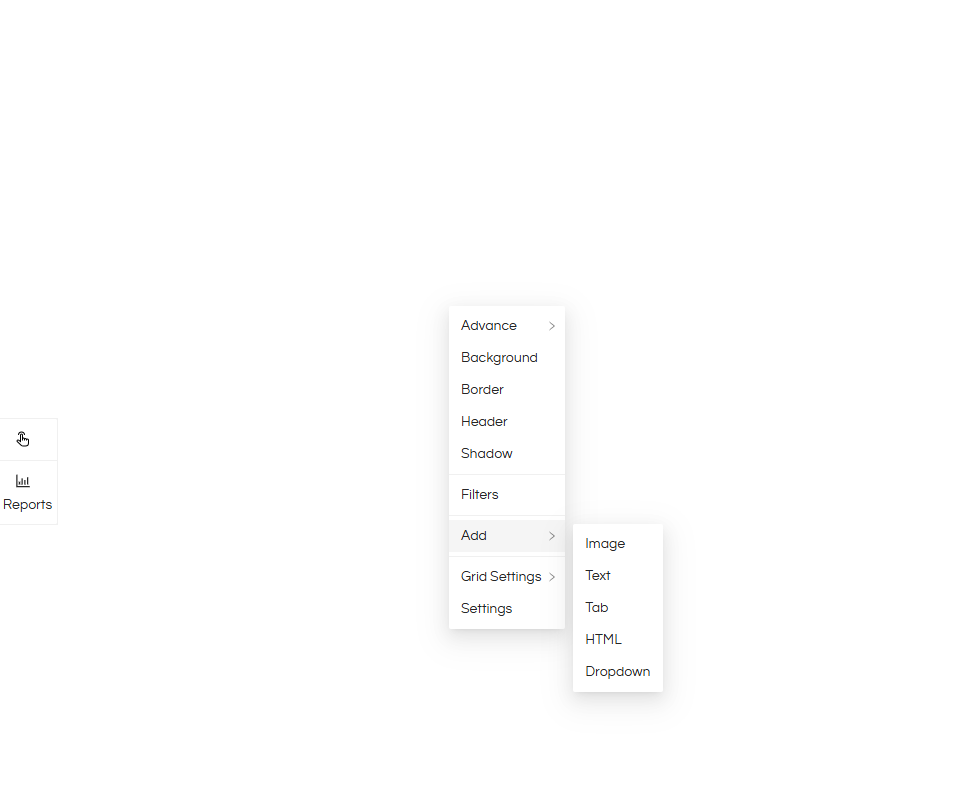
4. The number of HTML panels you need to add depends on how many reports you want to display at a time, plus one additional panel for the dropdown.
For example, if you want to show 5 reports, add a total of 6 HTML panels.
5. Leave the top HTML panel for the dropdown, and arrange the remaining panels below it in the layout you want the reports to appear.
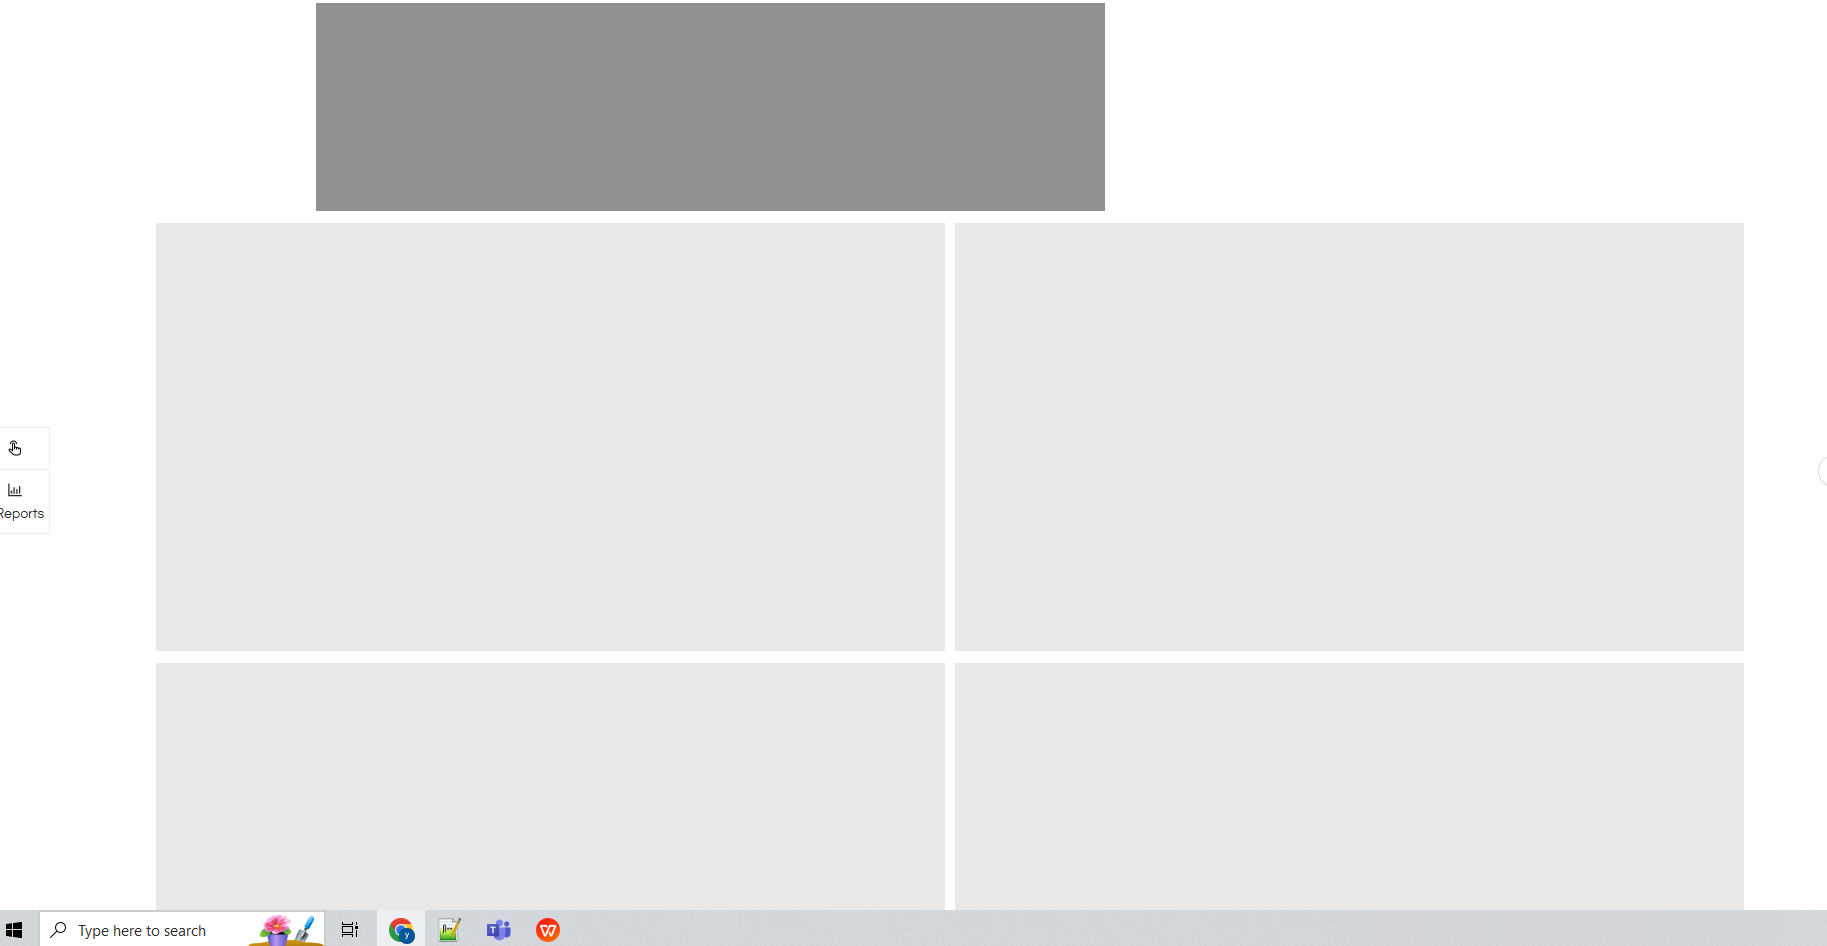
Note : Used background color for better readability. For applying background color you can right click on that component, select Background and apply color of your choice. This step is optional.
6. Once the panel arrangement is complete, note down the IDs of all the panels where the reports will be displayed (i.e., the light gray containers shown in the image above). To get id’s, right click on those panels and go to Advance > CSS
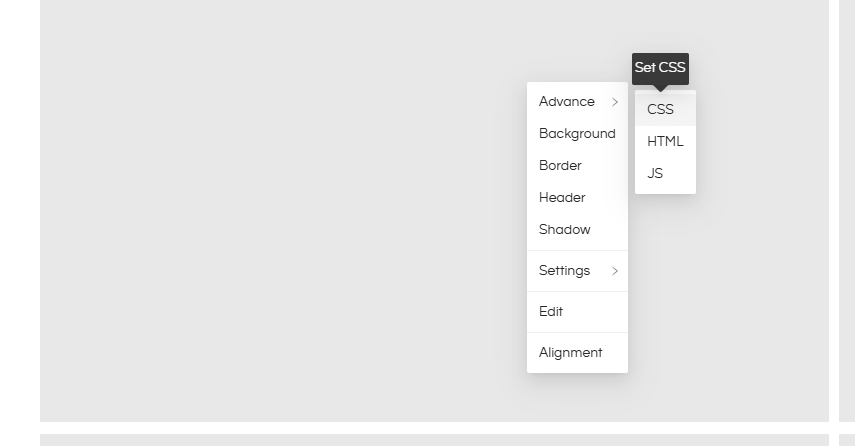
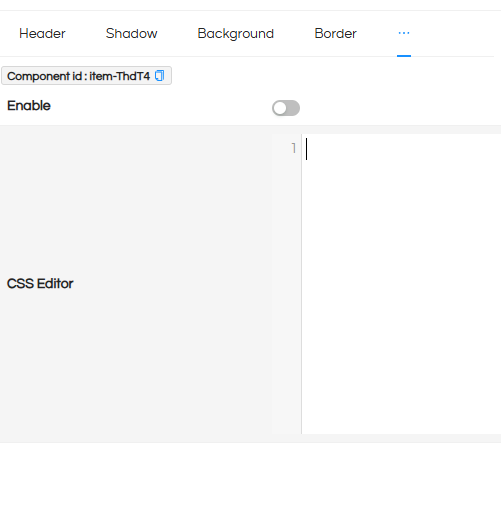
Component id is the ‘id’ we are looking for.
7. Store the id’s of all the panels somewhere, we are going to use them in the code.
Creation of DropDown:
8. Right click on the top most div which was created, go to Advance and in that go to HTML and paste the below code.
<div class="dropdown" id="reportDropdownWrapper">
  <div class="dropdown-toggle">Select reports</div>
  <div class="dropdown-options" id="dropdownOptions">
    <!-- Dynamic options will be inserted here -->
  </div>
  <button id="applyButton" style="margin: 10px; padding: 5px 10px;">Apply</button>
</div>
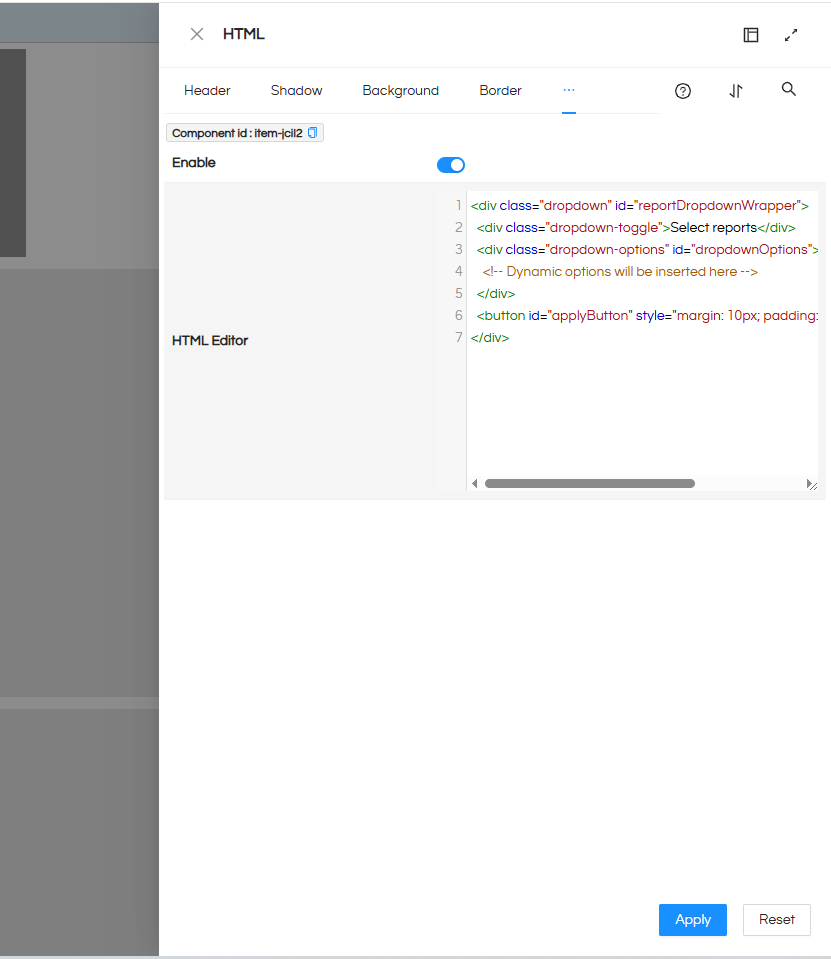
Toggle the enable button and click on Apply button.
9. Now after that go to CSS section of same panel and paste the below code for styling.
.dropdown {

  position: relative;

  display: inline-block;

  width: 300px;

  display : flex;

}
.dropdown-toggle {
padding: 10px;
border: 1px solid #ccc;
cursor: pointer;
background: #fff;
flex : 1 ;
}
.dropdown-options {
display: none;
position: absolute;
background-color: #fff;
border: 1px solid #ccc;
width: 100%;
z-index: 1;
max-height: 200px;
overflow-y: auto;
}
.dropdown-options label {
display: block;
padding: 8px;
cursor: pointer;
}
.dropdown-options input {
margin-right: 8px;
}
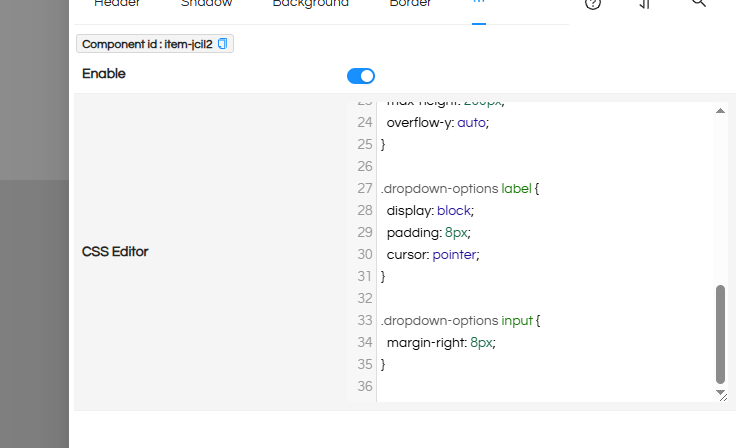
Toggle the Enable button and click on Apply button once done with pasting the code.
10. Now again Go to JS section of same and paste the below code.
var reportDivIds = ['#html-item-pKhqD', '#html-item-oZ8Dw', '#html-item-4qD5n', '#html-item-53U1L'];

var removedDivs = {};

var fileResources = [];

var api_base_url = 'https://216.48.177.235:8443/bi-ee'

// Toggle dropdown visibility
document.querySelector('.dropdown-toggle').addEventListener('click', function() {
  var dropdown = document.getElementById('dropdownOptions');
  dropdown.style.display = dropdown.style.display === 'block' ? 'none' : 'block';
});

// Apply selection and update divs with iframes
document.getElementById('applyButton').addEventListener('click', function() {
  var selectedReports = Array.from(document.querySelectorAll('#dropdownOptions input:checked'))
  .map(function(input) {
    return {
      file_name: input.value, // The file name (value of the checkbox)
      path: input.dataset.path // The path stored in the data-path attribute
    };
  });

  console.log('Selected Reports:', selectedReports);  // Debugging: log selected reports

  // Loop through the report containers (divs)
  reportDivIds.forEach(function(selector, index) {
  var div = document.querySelector(selector);

  // Try restoring if not found and was previously removed
  if (!div && removedDivs[selector.substring(6)]) {
    var restoredDiv = removedDivs[selector.substring(6)];
    document.querySelector('.react-grid-layout.layout').appendChild(restoredDiv);
	div = document.querySelector(selector);

  }

  if (!div) return;

  if (index < selectedReports.length) {
    var report = selectedReports[index];
	console.log(report ,'reportName');
    var iframeUrl = `${api_base_url}/#/report-viewer?dir=${report.path}&file=${report.file_name}&mode=dashboard`;

    if (!div.querySelector('iframe')) {
      var iframe = document.createElement('iframe');
      iframe.src = iframeUrl || 'about:blank';
      iframe.style.width = '100%';
	  iframe.style.height = '100%';
	  div.style.height = '400px';
      div.appendChild(iframe);
    } else {
      div.querySelector('iframe').src = iframeUrl || 'about:blank';
    }
  } else {
	var removableDiv = document.getElementById(selector.substring(6));
	removedDivs[removableDiv.id] = removableDiv;
    removableDiv.remove()
	layoutHeightAdjusting()

  }
});

  // Close dropdown after applying
  document.getElementById('dropdownOptions').style.display = 'none';
});

// Close dropdown if clicked outside
document.addEventListener('click', function(event) {
  var wrapper = document.getElementById('reportDropdownWrapper');
  if (!wrapper.contains(event.target)) {
    document.getElementById('dropdownOptions').style.display = 'none';
  }
});


setTimeout(()=>{
  reportDivIds.forEach(function(selector) {
    var div = document.querySelector(selector);
    if (div) {
      var removableDiv = document.getElementById(selector.substring(6));
		removedDivs[removableDiv.id] = removableDiv;
		removableDiv.remove()
    }
  });

  layoutHeightAdjusting()
})

 // Global variable to store file info

    fetch(`${api_base_url}/getSolutionResources`)
      .then(function(response) {
        return response.json();
      })
      .then(function(data) {
        function traverse(node) {
          if (node.type === 'file' && node.name.endsWith('.hr')) {
            fileResources.push({
              path: node.path,
              file_name: node.name
            });
          }

          if (Array.isArray(node.children)) {
            node.children.forEach(traverse);
          }
        }

        data.forEach(traverse);
		generateDropdownOptions();
        console.log('fileResources:', fileResources); // Use the variable here
      })
      .catch(function(error) {
        console.error('Fetch or parse error:', error);
      });


function generateDropdownOptions() {
    const dropdownOptions = document.getElementById('dropdownOptions');

    fileResources.forEach(function(file) {
      const label = document.createElement('label');
      const checkbox = document.createElement('input');
      checkbox.type = 'checkbox';
      checkbox.value = file.file_name; // Set file name as value
      checkbox.dataset.path = file.path; // Store the path in a custom data attribute

      label.appendChild(checkbox);
      label.appendChild(document.createTextNode(file.file_name));
      dropdownOptions.appendChild(label);
      dropdownOptions.appendChild(document.createElement('br')); // Add line break for each item
    });
  }


function layoutHeightAdjusting(){
	var layout = document.querySelector('.react-grid-layout.layout');
  if (layout) {
    layout.setAttribute('style', 'height: auto !important');
  }

}

window.addEventListener('resize', function() {
  layoutHeightAdjusting()
});
NOTE : The options (reports names) in the dropdown will be generated automatically by fetching all the reports that are available by using Helical Insight API.
10. This code handles the complete functionality for displaying reports dynamically. However, you may need to make a few adjustments to ensure it works with your specific dashboard setup.
Change 1 :
var reportDivIds = ['#html-item-pKhqD', '#html-item-oZ8Dw', '#html-item-4qD5n', '#html-item-53U1L'];
Replace the entries in reportDivIds with the HTML panel IDs you copied earlier at step 6.
Make sure to prefix each ID with #html-, as shown in the sample example above.
Paste them in the same sequence you want the reports to appear on the dashboard.
Change 2 :
var api_base_url = 'https://216.48.177.235:8443/bi-ee'
Replace this api_base_url with your Helical Insight application URL
Change 3(optional) :
	iframe.style.width = '100%';

	  iframe.style.height = '100%';

	  div.style.height = '400px';
Adjust the value from 400px to your desired height if there is any misalignment in the report display.
11. That’s it! Save the dashboard and open it in a new window to start using it.
12. The number of reports displayed will adjust dynamically based on the report names selected from the dropdown.
Code Explanation :
The complete code is divided into small sections for better understanding .
Section 1 – Fetching reports and generating options in the dropdown :
Code :
 fetch(`${api_base_url}/getSolutionResources`)
      .then(function(response) {
        return response.json();
      })
      .then(function(data) {
        function traverse(node) {
          if (node.type === 'file' && node.name.endsWith('.hr')) {
            fileResources.push({
              path: node.path,
              file_name: node.name
            });
          }

          if (Array.isArray(node.children)) {
            node.children.forEach(traverse);
          }
        }

        data.forEach(traverse);
		generateDropdownOptions();
        console.log('fileResources:', fileResources); // Use the variable here
      })
      .catch(function(error) {
        console.error('Fetch or parse error:', error);
      });


function generateDropdownOptions() {
    const dropdownOptions = document.getElementById('dropdownOptions');

    fileResources.forEach(function(file) {
      const label = document.createElement('label');
      const checkbox = document.createElement('input');
      checkbox.type = 'checkbox';
      checkbox.value = file.file_name; // Set file name as value
      checkbox.dataset.path = file.path; // Store the path in a custom data attribute

      label.appendChild(checkbox);
      label.appendChild(document.createTextNode(file.file_name));
      dropdownOptions.appendChild(label);
      dropdownOptions.appendChild(document.createElement('br')); // Add line break for each item
    });
  }
Explanation :
- We are fetching records using the API ${api_base_url}/getSolutionResources, where the base URL is https://216.48.177.235:8443/bi-ee, as defined earlier. This API returns all entries in the resources, but we filter them to include only the reports with a
.hrextension. - Once we have the filtered entries, we extract only the necessary information and store it in a variable called fileResources. In the next step, we use this variable to populate the dropdown options.
- After populating fileResources, we trigger the generateDropdownOptions() function. This function goes through each entry in fileResources and creates a corresponding dropdown option using the report name, which is what users see in the UI.
Section 2 – Displaying Reports based on User selection:
Code :
document.getElementById('applyButton').addEventListener('click', function() {
  var selectedReports = Array.from(document.querySelectorAll('#dropdownOptions input:checked'))
  .map(function(input) {
    return {
      file_name: input.value, // The file name (value of the checkbox)
      path: input.dataset.path // The path stored in the data-path attribute
    };
  });

  console.log('Selected Reports:', selectedReports);  // Debugging: log selected reports

  // Loop through the report containers (divs)
  reportDivIds.forEach(function(selector, index) {
  var div = document.querySelector(selector);

  // Try restoring if not found and was previously removed
  if (!div && removedDivs[selector.substring(6)]) {
    var restoredDiv = removedDivs[selector.substring(6)];
    document.querySelector('.react-grid-layout.layout').appendChild(restoredDiv);
	div = document.querySelector(selector);

  }

  if (!div) return;

  if (index < selectedReports.length) {
    var report = selectedReports[index];
	console.log(report ,'reportName');
    var iframeUrl = `${api_base_url}/#/report-viewer?dir=${report.path}&file=${report.file_name}&mode=dashboard`;

    if (!div.querySelector('iframe')) {
      var iframe = document.createElement('iframe');
      iframe.src = iframeUrl || 'about:blank';
      iframe.style.width = '100%';
	  iframe.style.height = '100%';
	  div.style.height = '400px';
      div.appendChild(iframe);
    } else {
      div.querySelector('iframe').src = iframeUrl || 'about:blank';
    }
  } else {
	var removableDiv = document.getElementById(selector.substring(6));
	removedDivs[removableDiv.id] = removableDiv;
    removableDiv.remove()
	layoutHeightAdjusting()

  }
});

  // Close dropdown after applying
  document.getElementById('dropdownOptions').style.display = 'none';
});
- This part of the code is triggered when the user clicks the Apply button after selecting the desired reports.
- Once the button is clicked, the function first checks which reports have been selected and dynamically generates the corresponding iframe URLs using the report names and paths.
- It then iterates through the target HTML panels and injects the iframes one by one so the selected reports are displayed in sequence.
- For example, if the user selects 2 reports, the function will insert iframes into the first two panels and remove the excess panels to prevent empty spaces.
- The removed panels are stored in a variable for future use, so they can be reused when new reports are selected later.
Section 3 - Minor Code Snipets :
Code :
document.querySelector('.dropdown-toggle').addEventListener('click', function() {
  var dropdown = document.getElementById('dropdownOptions');
  dropdown.style.display = dropdown.style.display === 'block' ? 'none' : 'block';
});
Explanation :
responsible for showing/hiding the options of dropdown.
Code :
setTimeout(()=>{
  reportDivIds.forEach(function(selector) {
    var div = document.querySelector(selector);
    if (div) {
      var removableDiv = document.getElementById(selector.substring(6));
		removedDivs[removableDiv.id] = removableDiv;
		removableDiv.remove()
    }
  });

  layoutHeightAdjusting()
})
Explanation :
Triggered at the very starting to clear all the divs and store in a variable to use again when reports are selected.
Code :
function layoutHeightAdjusting(){
	var layout = document.querySelector('.react-grid-layout.layout');
  if (layout) {
    layout.setAttribute('style', 'height: auto !important');
  }

}

window.addEventListener('resize', function() {
  layoutHeightAdjusting()
});
Explanation :
- layoutHeightAdjusting() responsible for removing extra space in the dashboard when all the selected reports can be seen without any scroll.
- This will tigger every time apply button is clicked and when screen size is changed.
