In this blog we are going to cover how to use a drop down option from which an end user can select a single value and use. Based on the value selected, the report data can accordingly get filtered out. The values of the drop down are populated by the SQLQuery. SQL query is executed at runtime, and the resulting list of values is displayed as selectable options. The user can select only one value from the list.

This blog is relevant for the canned reporting module of Open Source BI product Helical Insight version 6.0 onwards.

Steps to report with single select parameter in a Helical Insight canned report :

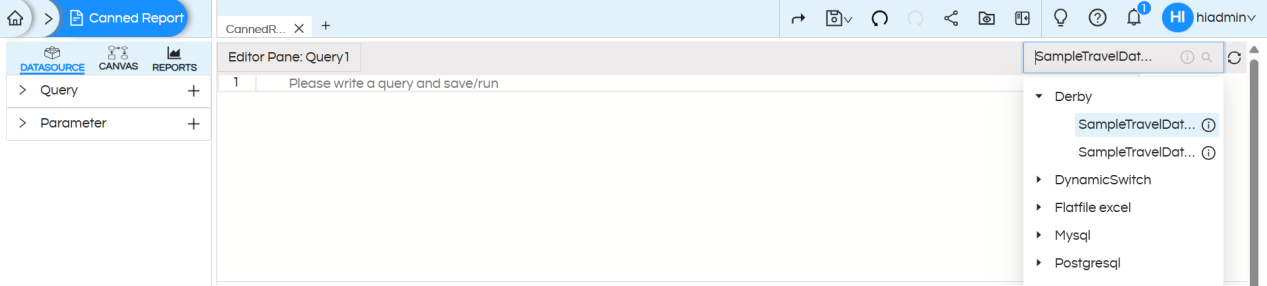
STEP 1: Go to Datasource and select the desired connection. Read more here about how to connect to datasources. You can write the SQLQuery here and then in the canvas those fields can be used to create the report.

Using Single Select Drop Down Input Parameter/Filter

STEP 2 : Write the required SQL for the report creation here. No need to put the where clause right now. In later steps when we are adding filter then we will explain about the where clause as well.

SQL :

SELECT * FROM "travel_details"

Using Single Select Drop Down Input Parameter/Filter

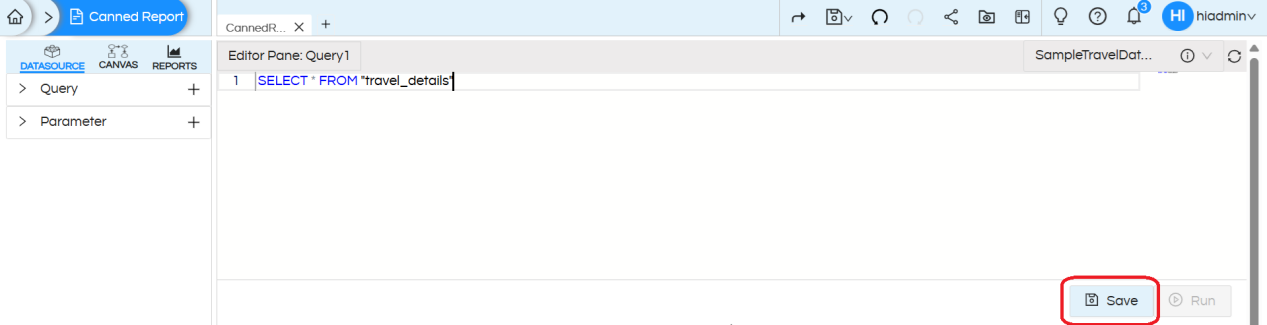
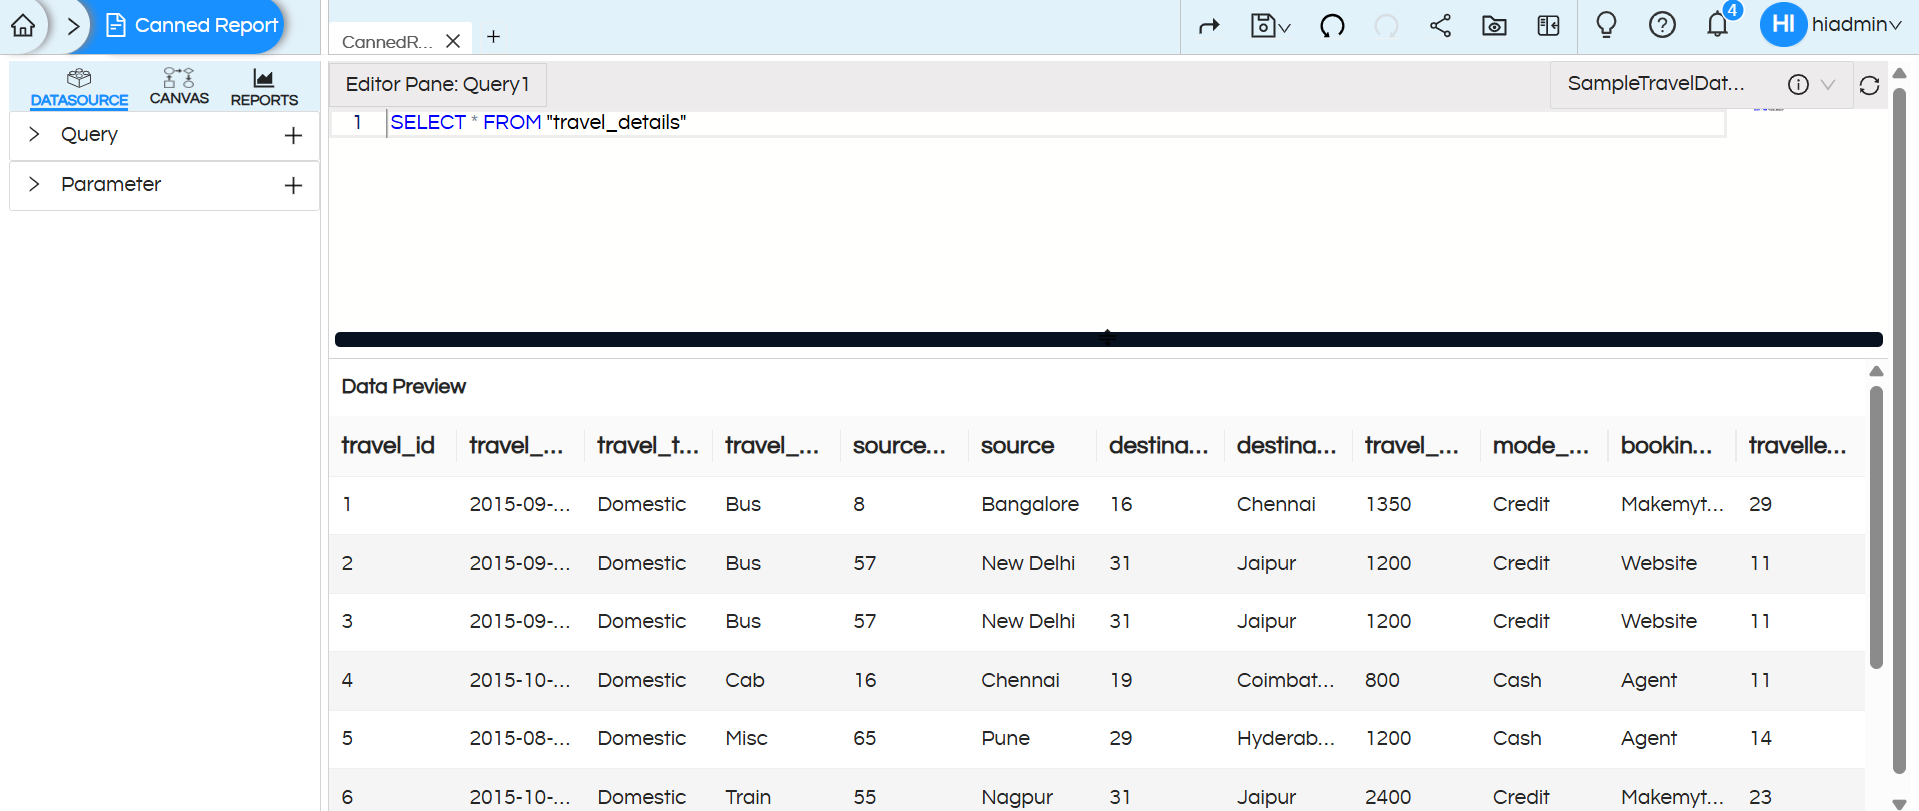
STEP3 : After providing the SQL query, click on Save and then Run. You will see the first 10 records of the result set.

Using Single Select Drop Down Input Parameter/Filter

STEP 4: Add an input parameter

In the Datasource page itself, click on Parameter section, click on the + (plus) symbol to add a parameter. Each time you click, it adds a new parameter named parameter1, parameter2, parameter3, and so on.

On the right corner of its name, you can also see three dots, which give the following options:

  • Edit — You can rename the parameter from parameter1 to your choice of name.
  • Delete — You can delete the parameter.
  • Type — You can choose the parameter type:
    • a. String: Accepts text input for filtering or searching dimensions (e.g., customer name = “John”).
    • b. Collection: Allows selecting multiple values from a list to slice or filter data (e.g., regions = [East, West])
    • c. Numeric: Accepts numbers to filter or calculate measures (e.g., sales > 1000).

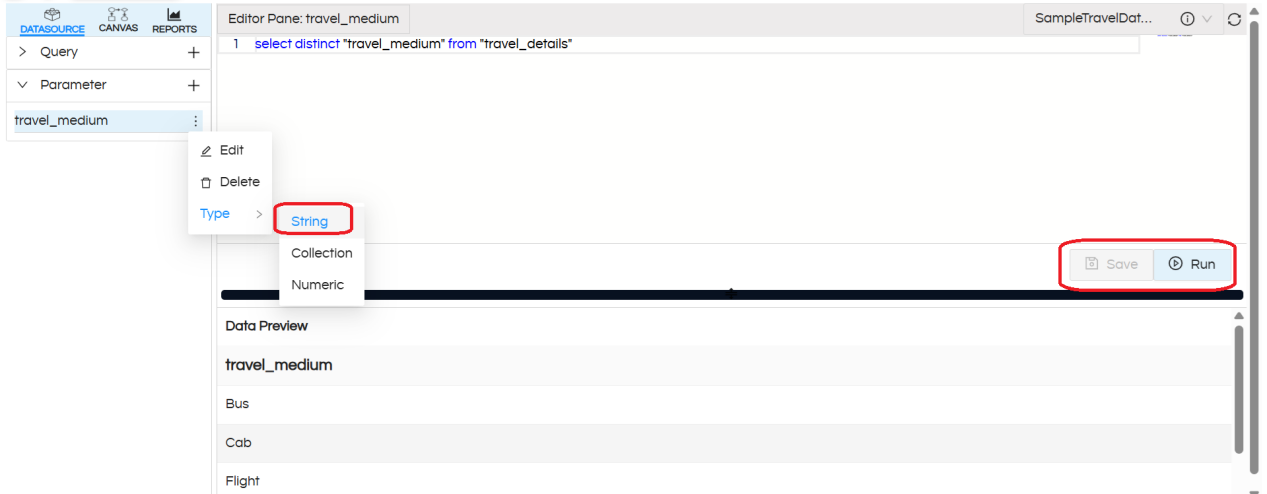
In this example, we have given the parameter name as “travel_medium” and set the type to String (as we are creating single select parameter).

Now in the SQLplaceholder, write the SQL which will be responsible for updating the dropdown values of the input parameter/filter. Then, click Save and then Run — it returns the first 10 records of the result set.

Parameter SQL :

select distinct "travel_medium" from "travel_details"

If you would like the dropdown values should appear in ascending/descending fashion, accordingly modify this SQL. The SQL should be the native SQL of the db to which you are connecting.

Using Single Select Drop Down Input Parameter/Filter

STEP 5: Add where clause to the main report query

Earlier in Step 2 we had written a main report query. Now we will add where clause in the report query section allowing it to receive the values set by a user.

For using the values returned by the parameter, use the parameter name with $ sign and within {}. Syntax – ${parameter_name} (in our case the parameter name we kept travel_medium, hence in our case ${travel_medium})

For multi-select parameters, use IN keyword for comparison in the where clause as array is returned.

Save the query and execute it, you will get a parameter prompt as below. There you need to provide some parameter value to validate SQL with dynamic parameter value.

Report SQL :

SELECT * FROM "travel_details" WHERE "travel_medium" = ${travel_medium}

Using Single Select Drop Down Input Parameter/Filter

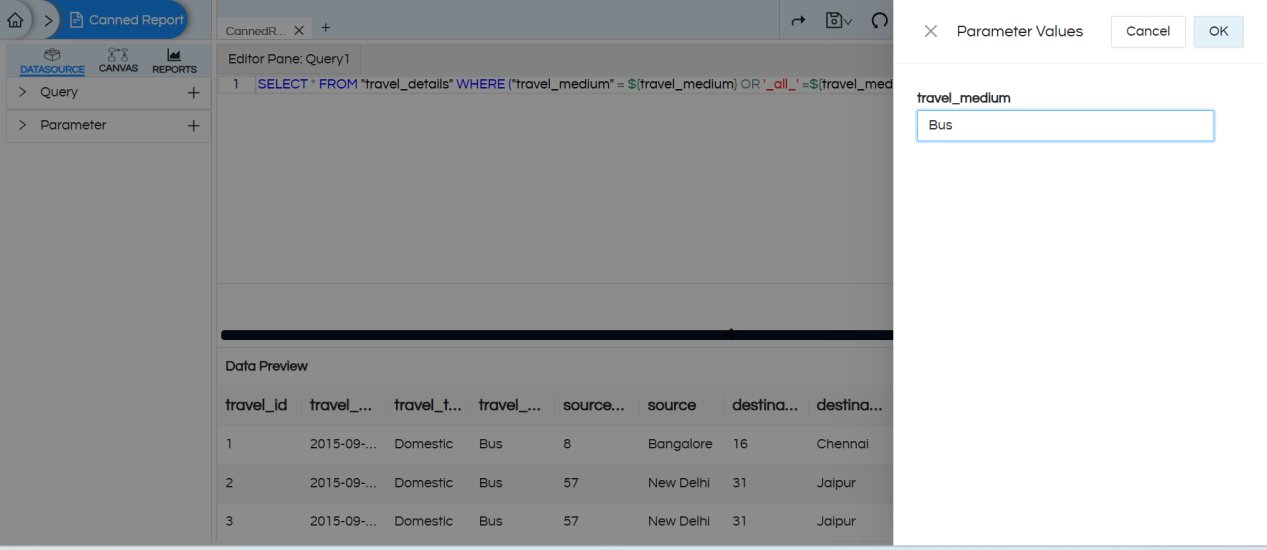
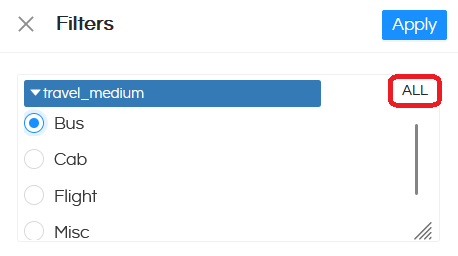
Handling the “ALL” Option in Filter UI :

In the filter UI, the option shown to the user is ALL, but internally the value passed to SQL is _all_. Since the database column does not actually contain _all_, a direct equality check would return no records.

To handle this, the SQL condition is written as:

Report SQL with ALL Handling :

SELECT * FROM "travel_details" 
WHERE ("travel_medium" = ${travel_medium} OR '_all_' = ${travel_medium})
  • If a specific value is selected, only matching records are returned.
  • If ALL is selected (internally _all_), the second part of the condition '_all_' = '_all_' always evaluates to true, so all rows are returned.

Using Single Select Drop Down Input Parameter/Filter

STEP 6 : Parameter configuration (specifying the parameter type)

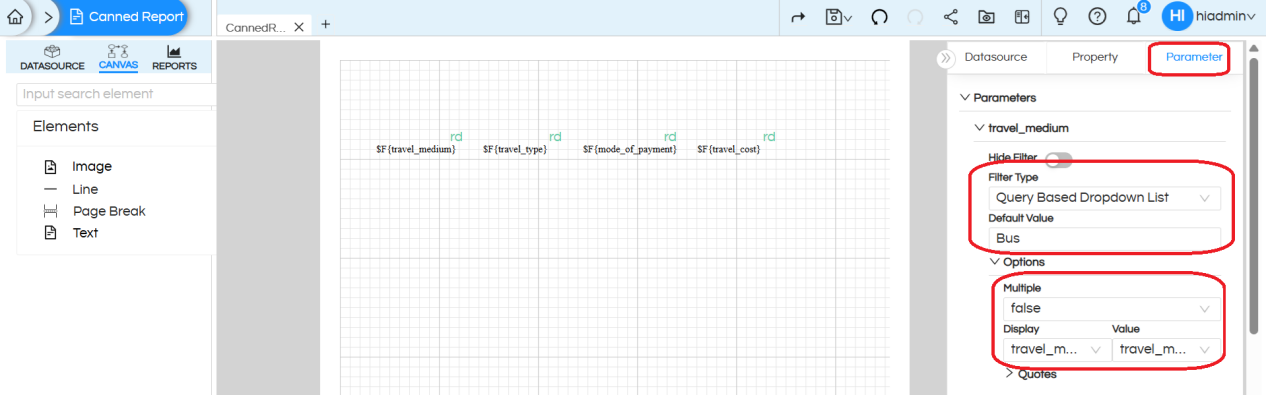
To configure the created parameters, navigate to CANVAS > Parameter, then expand the parameters section. This will display all the created parameters, which need to be configured individually.

In the configuration panel, you can specify options such as: selecting the input parameter type, mapping display value and key columns for a query-based drop-down list, defining date formats, setting a default value for the parameter and hiding the parameter if needed.

Using Single Select Drop Down Input Parameter/Filter

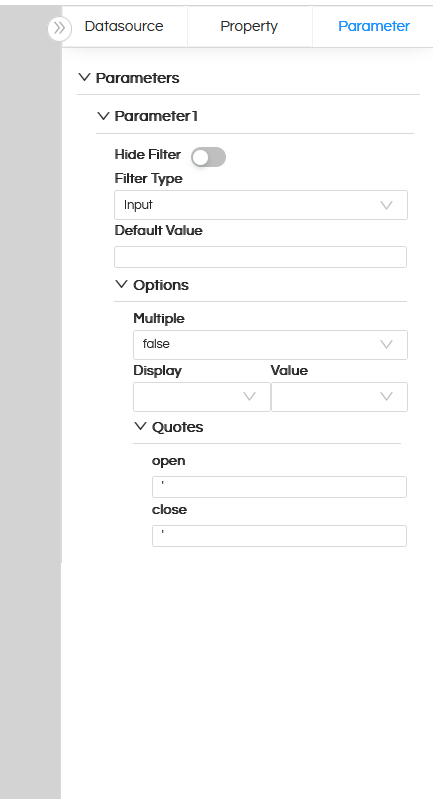
Hide Filter: Hides the parameter from the UI but if the value is passed via report URL it can still be passed to the canned report. Read here to learn how to pass filter values from here.

Filter Type: Defines the type of input control (e.g., dropdown, text box, date picker). Read here to learn about each type.

Default Value: When the report opens by default with what filter/input parameter value should it show the data that value has to be defined here.

Multiple: Allows selecting multiple values if set to true, otherwise it allows to select only a single value only.

Display: Column shown to the user in the dropdown.

Value: Column whose value is passed to the query when selected.

In most of the cases, the Display and Value is the same. But in certain cases let’s say, we want to Display Employee_Name on the frontend for a user to select, whereas in the SQL where clause we want to pass Employee_ID, in those cases Display and Value field is useful.

Quotes: Controls whether the parameter value is wrapped in quotes in the query. Certain DB syntaxes might need a specific kind of quotes/syntaxes within which the filter values goes. That can be specified and used here.

In our case we will be using the option “Query based dropdown list” as the values of the dropdown is to be populated via the SQL which was written at Step 4. Display and Value we will keep the same. In Default Value we have kept as Bus, that means by default the report will always open with showing Bus data.

Using Single Select Drop Down Input Parameter/Filter

STEP 7: Save the report, open it in a window, and test the report with the parameter. The report data will change as per the selected values.
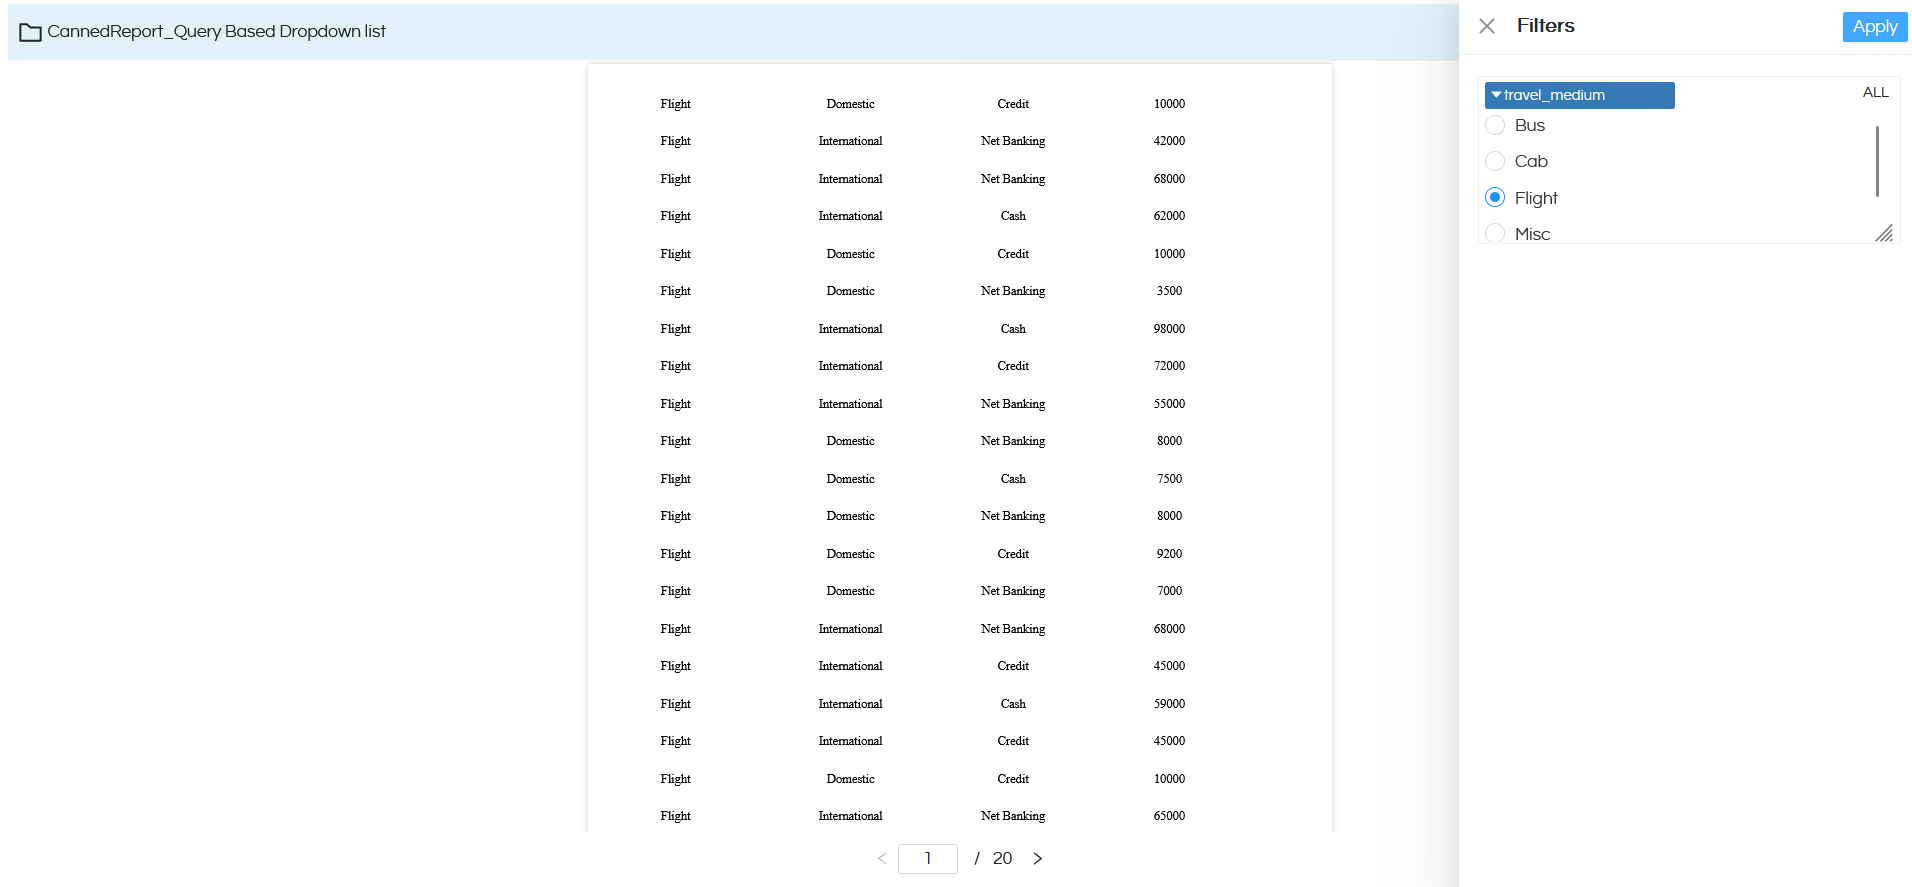
Using Single Select Drop Down Input Parameter/Filter

Reach out on support@helicalinsight.com in case of any more questions

Leave a Reply

Helical Insight’s self-service capabilities is one to reckon with. It allows you to simply drag and drop columns, add filters, apply aggregate functions if required, and create reports and dashboards on the fly. For advanced users, the self-service component has ability to add javascript, HTML, HTML5, CSS, CSS3 and AJAX. These customizations allow you to create dynamic reports and dashboards. You can also add new charts inside the self-service component, add new kind of aggregate functions and customize it using our APIs.
Helical Insight, via simple browser based interface of Canned Reporting module, also allows to create pixel perfect printer friendly document kind of reports also like Invoice, P&L Statement, Balance sheet etc.
If you have a product, built on any platform like Dot Net or Java or PHP or Ruby, you can easily embed Helical Insight within it using iFrames or webservices, for quick value add through instant visualization of data.
Being a 100% browser-based BI tool, you can connect with your database and analyse across any location and device. There is no need to download or install heavy memory-consuming developer tools – All you need is a Browser application! We are battle-tested on most of the commonly used browsers.
We have organization level security where the Superadmin can create, delete and modify roles. Dashboards and reports can be added to that organization. This ensures multitenancy.
A first-of-its-kind Open-Source BI framework, Helical Insight is completely API-driven. This allows you to add functionalities, including but not limited to adding a new exporting type, new datasource type, core functionality expansion, new charting in adhoc etc., at any place whenever you wish, using your own in-house developers.
It handles huge volumes of data effectively. Caching, Pagination, Load-Balancing and In-Memory not only provides you with amazing experience, but also and does not burden the database server more than required. Further effective use of computing power gives best performance and complex calculations even on the big data even with smaller machines for your personal use. Filtering, Sorting, Cube Analysis, Inter Panel Communication on the dashboards all at lightning speed. Thereby, making best open-source Business Intelligence solution in the market.
With advance NLP algorithm, business users simply ask questions like, “show me sales of last quarter”, “average monthly sales of my products”. Let the application give the power to users without knowledge of query language or underlying data architecture
Our application is compatible with almost all databases, be it RDBMS, or columnar database, or even flat files like spreadsheets or csv files. You can even connect to your own custom database via JDBC connection. Further, our database connection can be switched dynamically based on logged in users or its organization or other parameters. So, all your clients can use the same reports and dashboards without worrying about any data security breech.
Our application can be installed on an in-house server where you have full control of your data and its security. Or on cloud where it is accessible to larger audience without overheads and maintenance of the servers. One solution that works for all.
Different companies have different business processes that the existing BI tools do not encompass. Helical Insight permits you to design your own workflows and specify what functional module of BI gets triggered