In this document, we are covering how you can have an input parameter. This input parameter can be an input parameter text box wherein an end user can provide the value and that can be displayed anywhere in the canvas. Or you can even pass that value from your application and append it into our report URL, thus that value will be shown

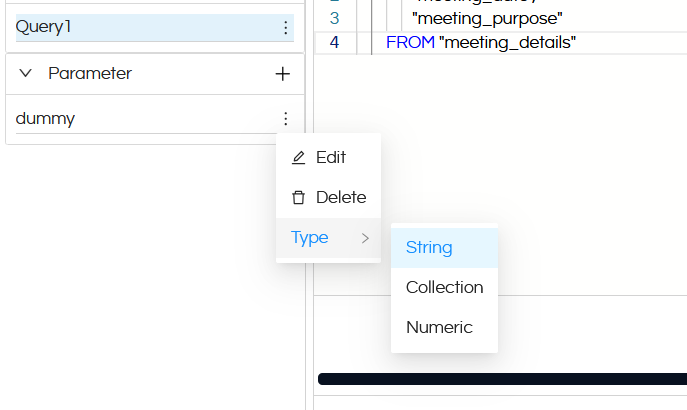
Add a parameter whose value an end user should be able decide. Below you can see that we have added a parameter, named it as “dummy” and the datatype of that is String.

Creating custom Input Filter to pass value and display in canned report

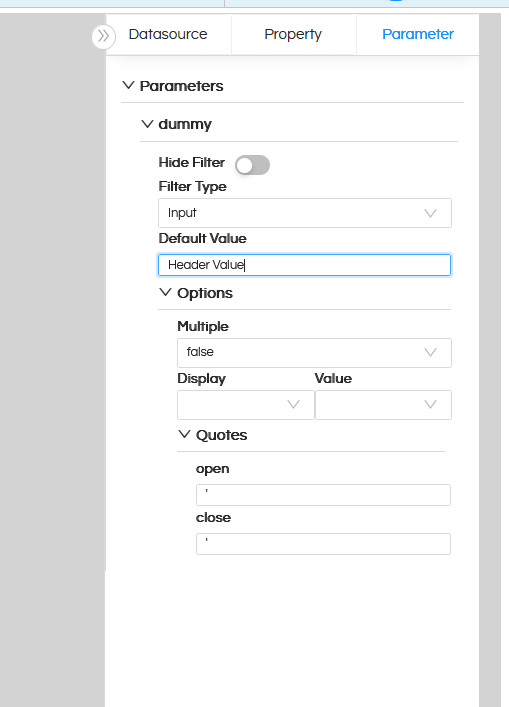
Go to the “Parameter” section and specify the default value

Creating custom Input Filter to pass value and display in canned report

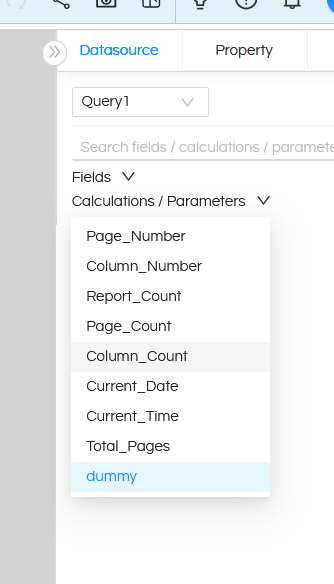
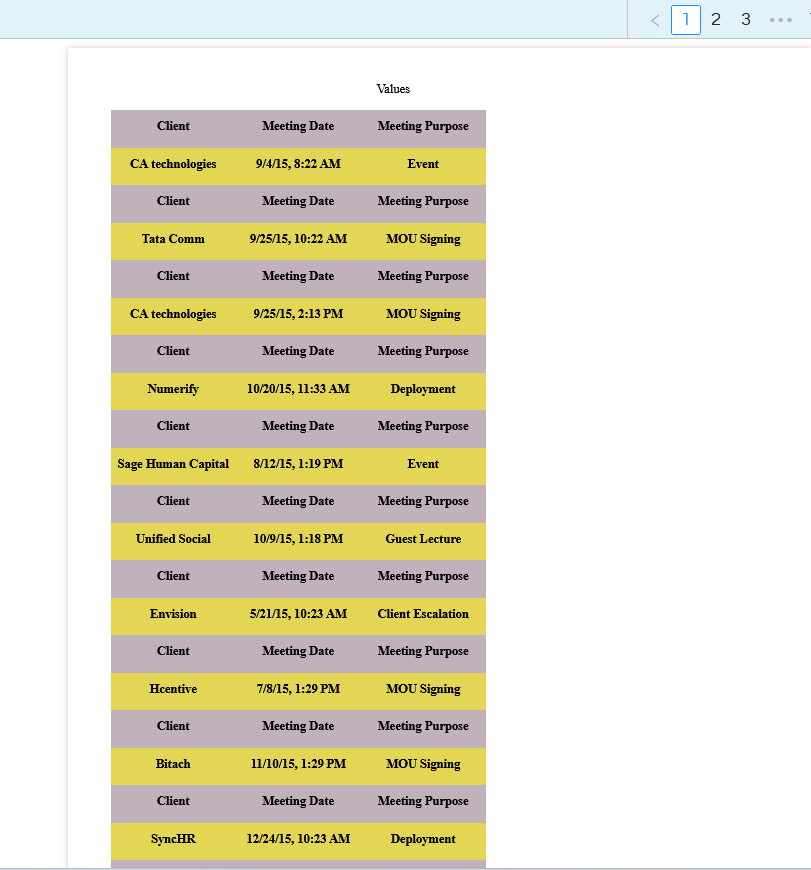
Now go to canvas and you can create the report that you interested in. When you click on “Calculations/Parameters”, then you can even see the Dummy field also which we had created earlier. You can drag that into the canvas, apply the required “Repeat by” option.

Creating custom Input Filter to pass value and display in canned report

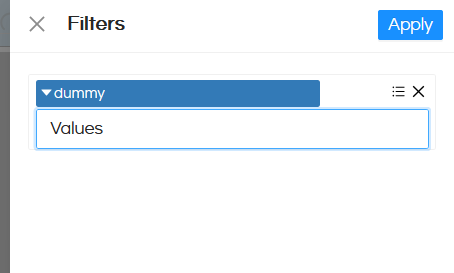
Now if you view the report, end user can get a text box to write the value. Whatever value he will write, accordingly that will become visible in the report as shown below.

Creating custom Input Filter to pass value and display in canned report

Creating custom Input Filter to pass value and display in canned report

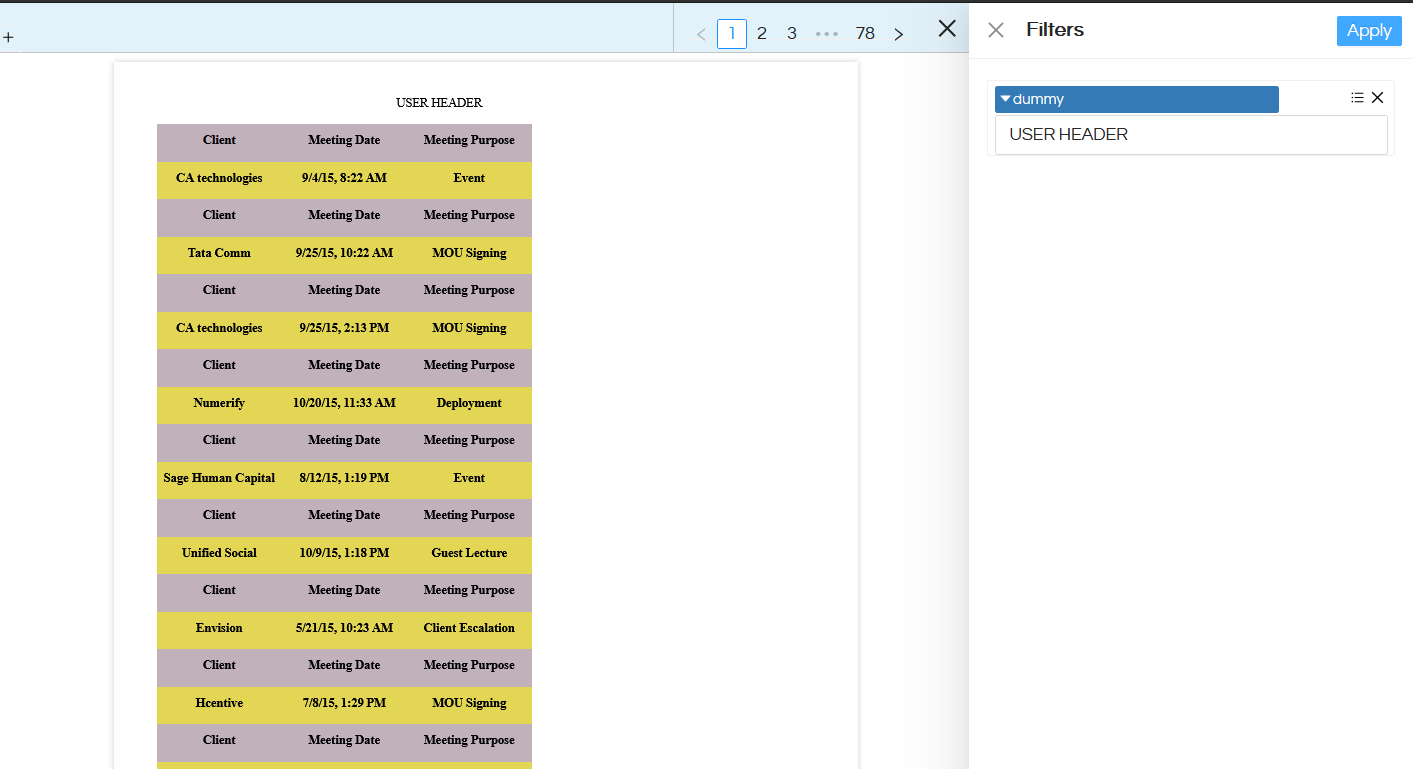
Example 2: In this example user has provided value as USER HEADER and that value is visible in the report.

Creating custom Input Filter to pass value and display in canned report

Passing value from the URL

In case if you would like that this filter popup box is not visible, rather the value is visible from. For doing that, whatever is the report URL infront of that append the filterlabel and filtervalue. For example in this example, the filterlabel is “dummy
Hence, the URL will be something like

https://192.168.0.1:hi-ee/#/report-viewer?dir=Canned_Reports_Sample&file=value_from_user.hcr&mode=open&dummy=SAMPLE
https://192.168.0.1:hi-ee/#/report-viewer?dir=Canned_Reports_Sample&file=value_from_user.hcr: This is the canned report URL. You can find this by clicking on Home button, navigating to that specific created canned report, right clicking on it and using “Open in New Window”. This will give the canned report end point URL.
&mode=open: This can have 2 values i.e. open or dashboard. When open is used, the report opens with a top blue band and that top blue band has got options to set other set of configurations like filters, exporting etc. Whereas if mode=dashboard is being used, then the report will open without the top blue band.
&dummy=SAMPLE: Here we can add the filter name/filter label and filter values. Multiple filter labels and their respective values can be appended. If there are multiple values, it can be appended like this [‘value1’,’value2’]

Please reach out on support@helicalinsight.com or forum.helicalinsight.com in case of any more questions.

Leave a Reply

Helical Insight’s self-service capabilities is one to reckon with. It allows you to simply drag and drop columns, add filters, apply aggregate functions if required, and create reports and dashboards on the fly. For advanced users, the self-service component has ability to add javascript, HTML, HTML5, CSS, CSS3 and AJAX. These customizations allow you to create dynamic reports and dashboards. You can also add new charts inside the self-service component, add new kind of aggregate functions and customize it using our APIs.
Helical Insight, via simple browser based interface of Canned Reporting module, also allows to create pixel perfect printer friendly document kind of reports also like Invoice, P&L Statement, Balance sheet etc.
If you have a product, built on any platform like Dot Net or Java or PHP or Ruby, you can easily embed Helical Insight within it using iFrames or webservices, for quick value add through instant visualization of data.
Being a 100% browser-based BI tool, you can connect with your database and analyse across any location and device. There is no need to download or install heavy memory-consuming developer tools – All you need is a Browser application! We are battle-tested on most of the commonly used browsers.
We have organization level security where the Superadmin can create, delete and modify roles. Dashboards and reports can be added to that organization. This ensures multitenancy.
A first-of-its-kind Open-Source BI framework, Helical Insight is completely API-driven. This allows you to add functionalities, including but not limited to adding a new exporting type, new datasource type, core functionality expansion, new charting in adhoc etc., at any place whenever you wish, using your own in-house developers.
It handles huge volumes of data effectively. Caching, Pagination, Load-Balancing and In-Memory not only provides you with amazing experience, but also and does not burden the database server more than required. Further effective use of computing power gives best performance and complex calculations even on the big data even with smaller machines for your personal use. Filtering, Sorting, Cube Analysis, Inter Panel Communication on the dashboards all at lightning speed. Thereby, making best open-source Business Intelligence solution in the market.
With advance NLP algorithm, business users simply ask questions like, “show me sales of last quarter”, “average monthly sales of my products”. Let the application give the power to users without knowledge of query language or underlying data architecture
Our application is compatible with almost all databases, be it RDBMS, or columnar database, or even flat files like spreadsheets or csv files. You can even connect to your own custom database via JDBC connection. Further, our database connection can be switched dynamically based on logged in users or its organization or other parameters. So, all your clients can use the same reports and dashboards without worrying about any data security breech.
Our application can be installed on an in-house server where you have full control of your data and its security. Or on cloud where it is accessible to larger audience without overheads and maintenance of the servers. One solution that works for all.
Different companies have different business processes that the existing BI tools do not encompass. Helical Insight permits you to design your own workflows and specify what functional module of BI gets triggered