In this blog, we will explain the Quick Right Click Calculations feature available in Canned Reports in Open Source BI Helical Insight.
Canned Reporting module in Helical Insight is designed for creating pixel-perfect multi pager document kind of reports, such as invoices, statements, operational reports, and formatted tabular reports. While designing reports, users often need to perform aggregations and statistical calculations on report fields, such as totals, averages, counts, etc.
To simplify this process, the Canned Report Designer provides a Quick Calculation option through the right-click context menu. This allows report designers to quickly apply common calculations without manually creating variables or writing expressions.
Accessing Quick Right Click Calculations
- Open the Canned Report Designer in Helical Insight
- Drag and drop a field from the dataset onto the report canvas.
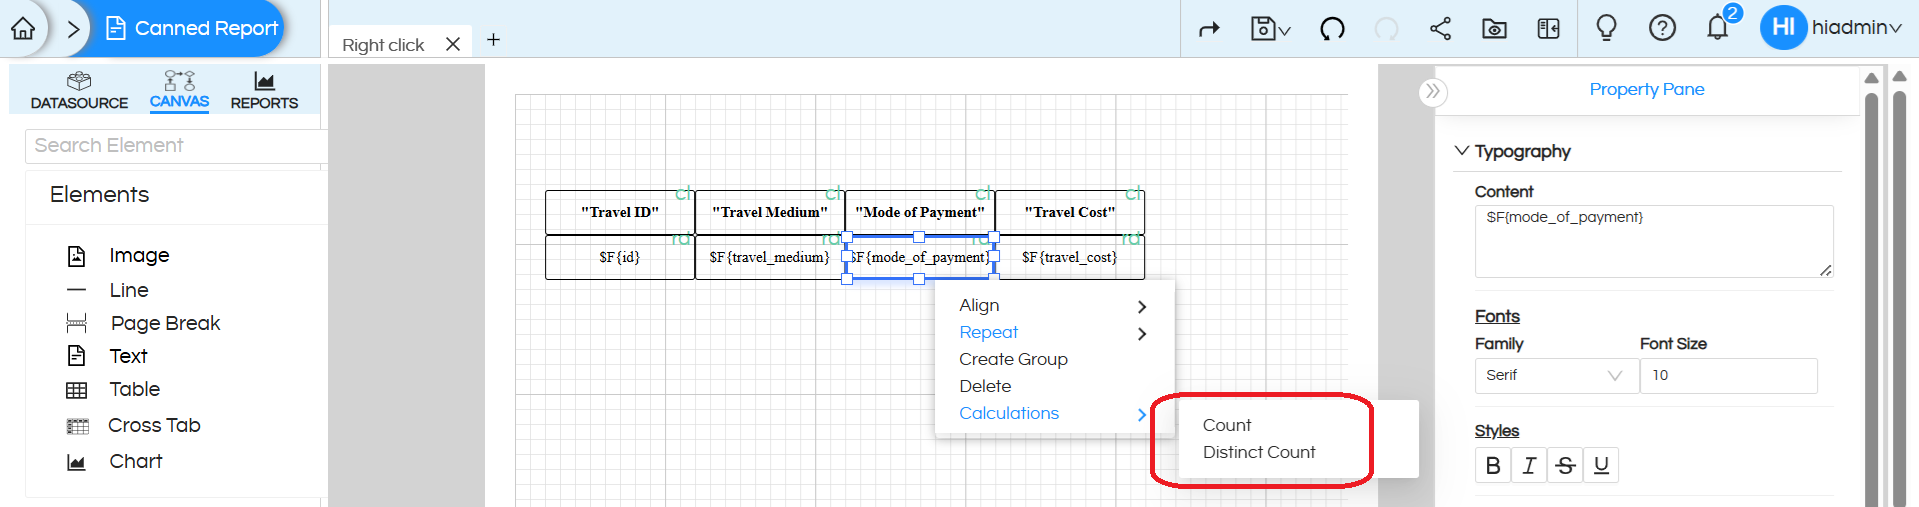
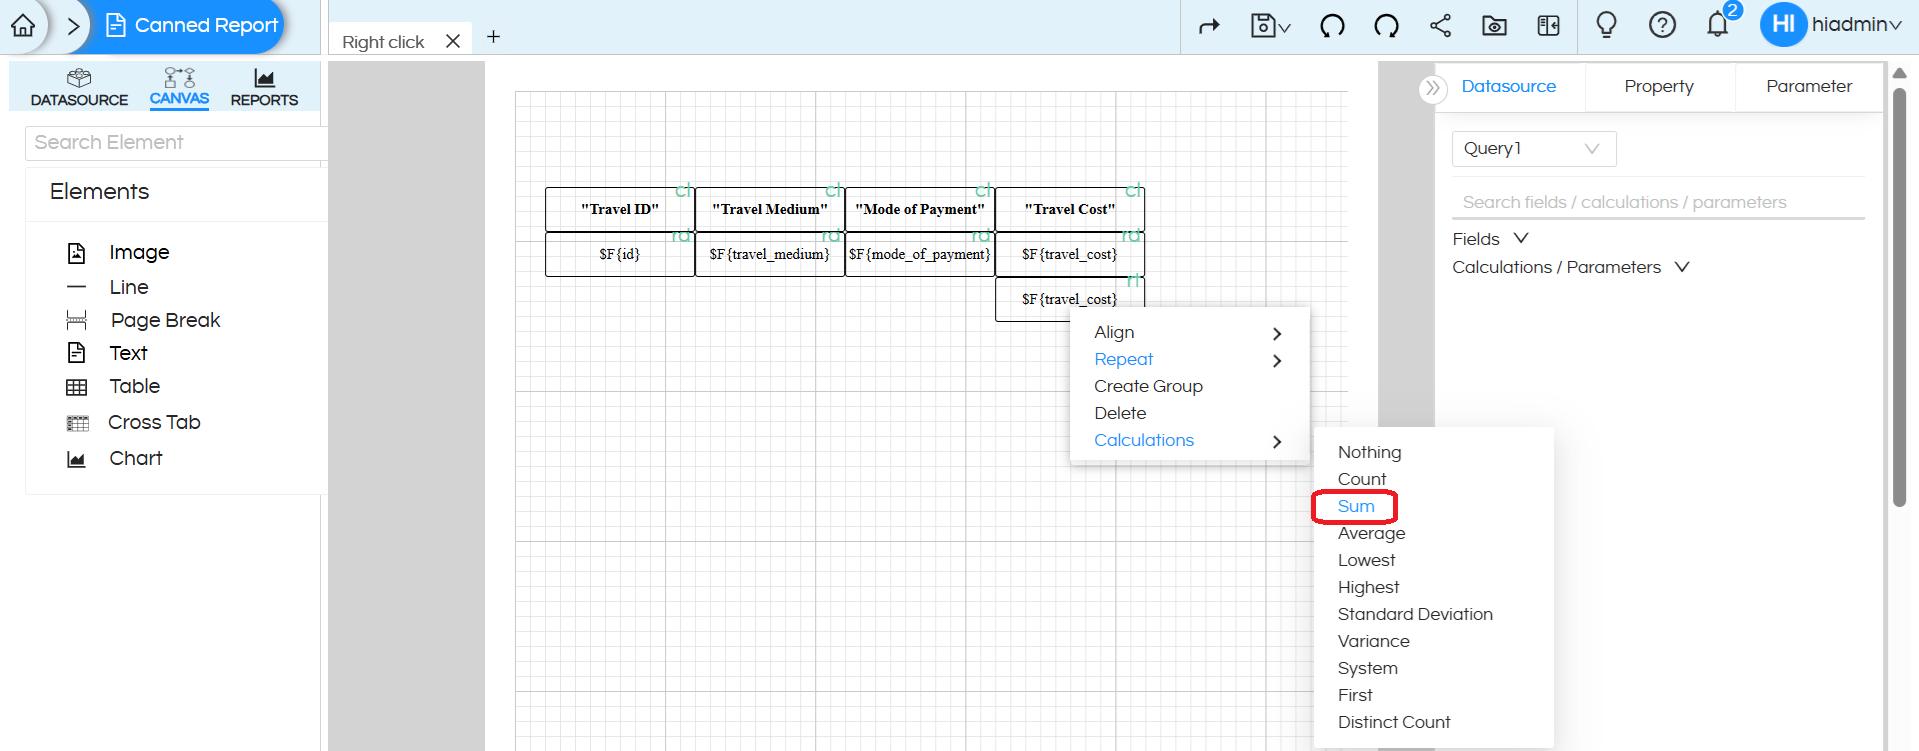
- Right click on the field element.
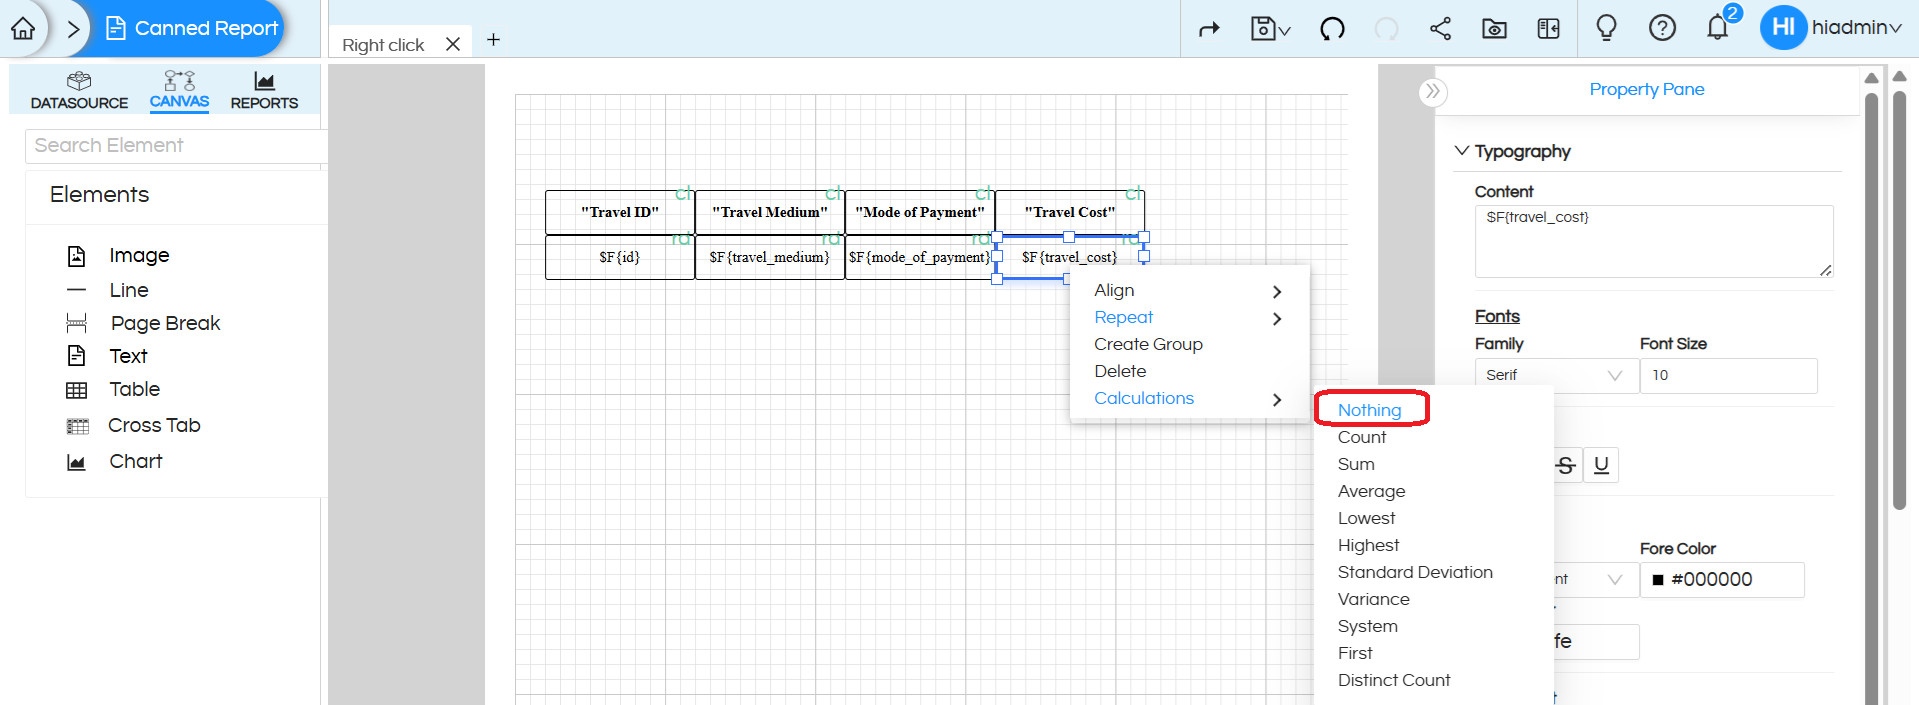
- Select Calculations from the context menu. Note that based on the data type of the field on which you right click, you might get different kind of calculation options.
- Choose the required calculation from the available options.
Once selected, the system automatically applies the calculation and generates the necessary variable.
We will explain each calculation using some example :
Calculations on Numeric Fields :
NOTE: Repeat By: For all the calculations, we have chosen Repeat by Summary. Based on the requirement, you can also select Repeat by Column, Repeat by Group, or Repeat by Page.
(A) Nothing
Displays the original field value without applying any calculation. This option removes any previously applied aggregation.
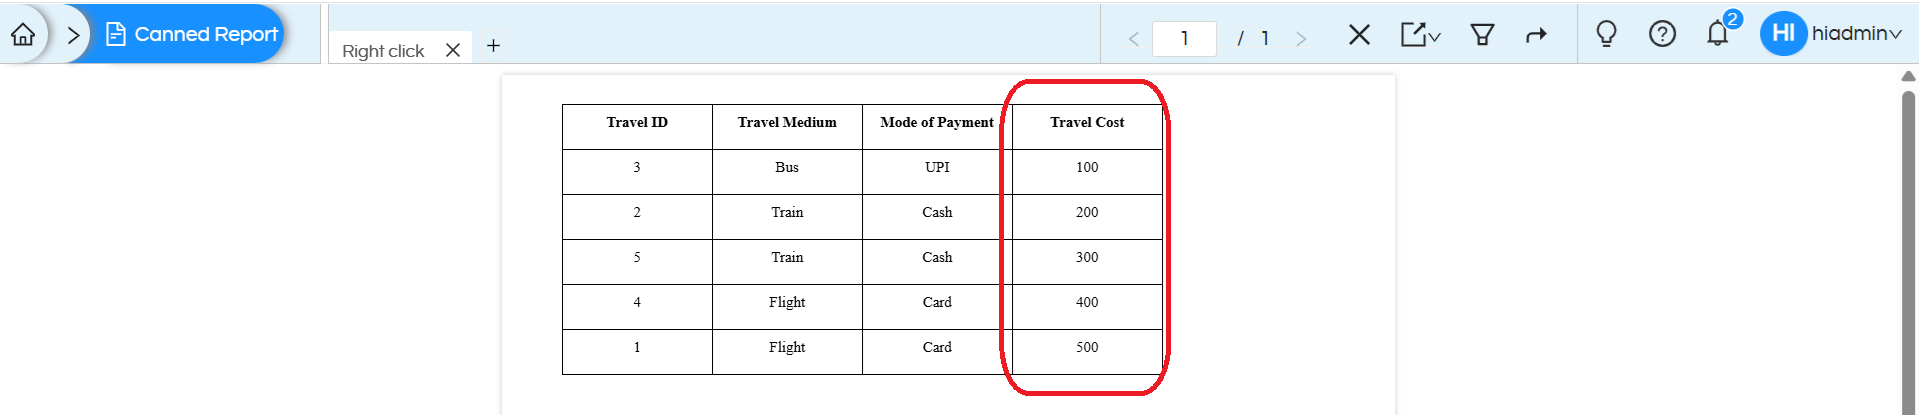
We can see there is no change in the data
(B) Count
Returns the total number of records present for the selected field in the dataset.
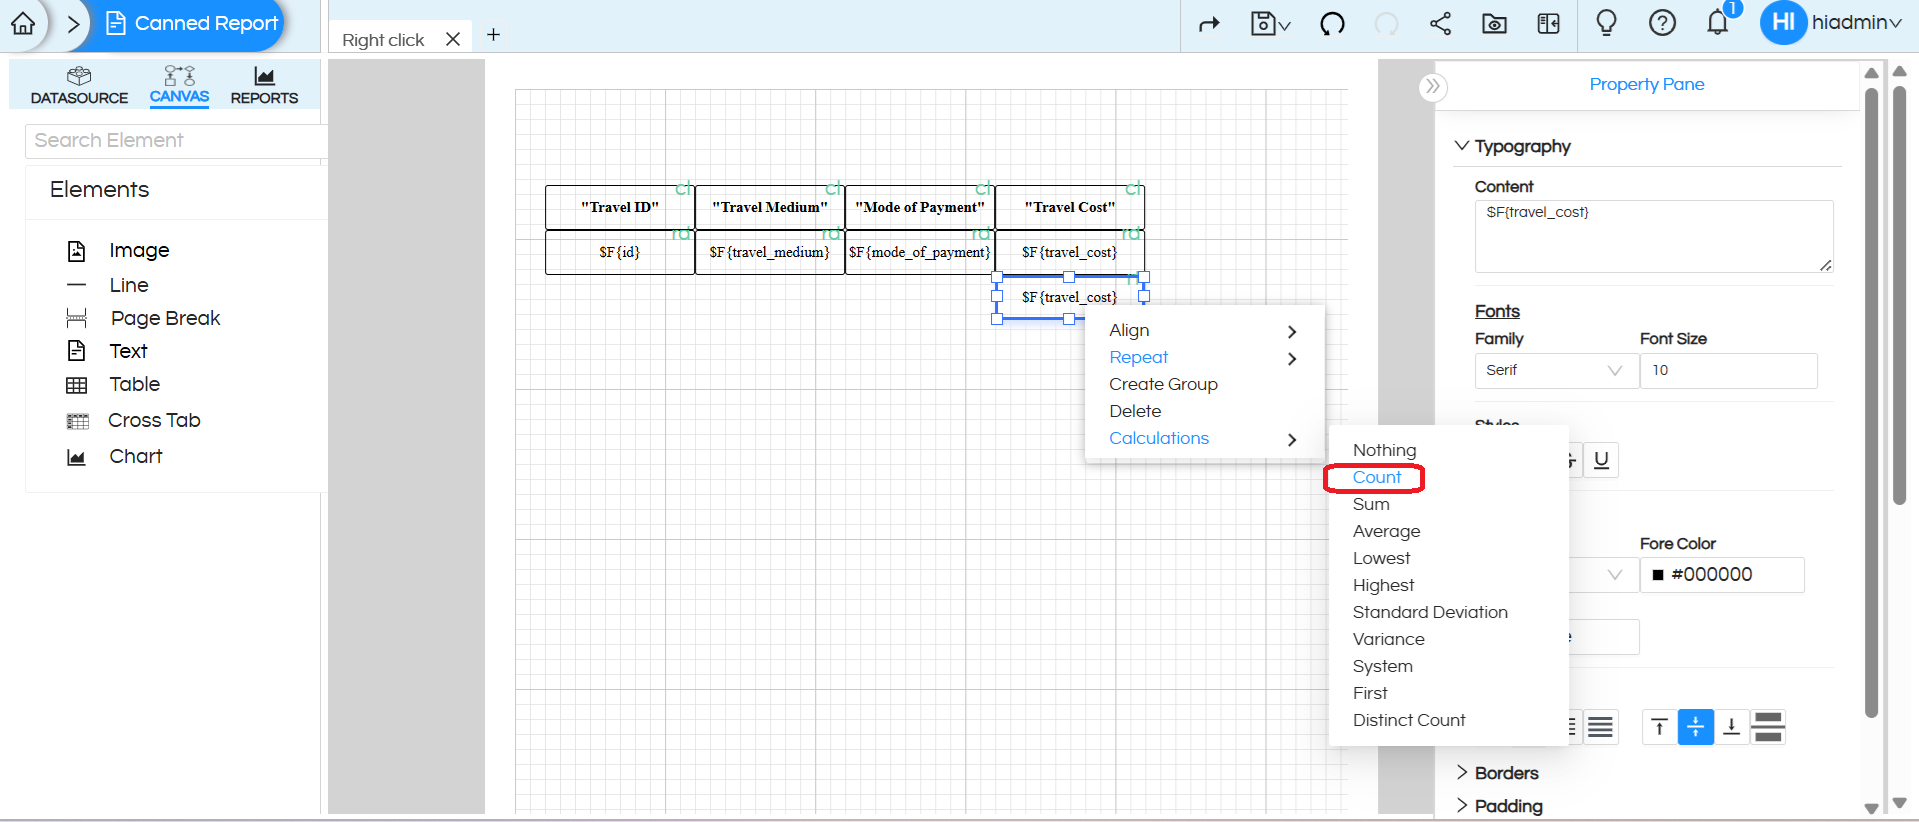
We can see it has 5 records so count is showing 5

(C) Sum
Calculates the total of all numeric values in the selected field
The total sum of all values is 1500 (100 + 200 + 300 + 400 + 500 = 1500)

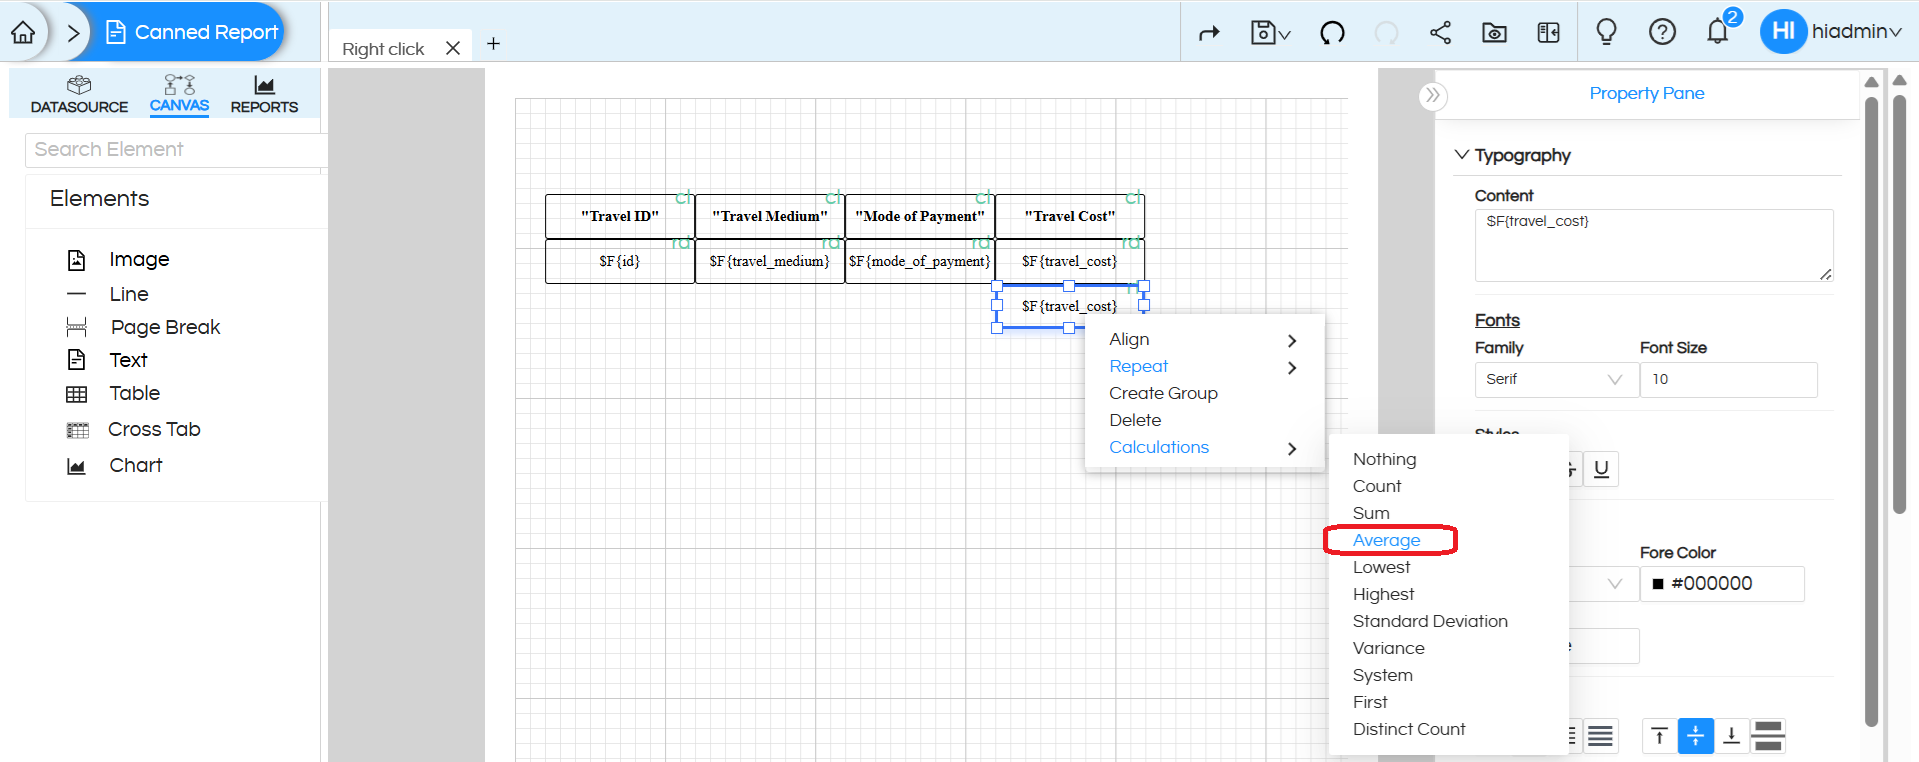
(D) Average
Returns the mean value of the numeric field, calculated as the sum of all values divided by the total number of records.
The average of all values is 300 (100 + 200 + 300 + 400 + 500 = 1500 ÷ 5 = 300)

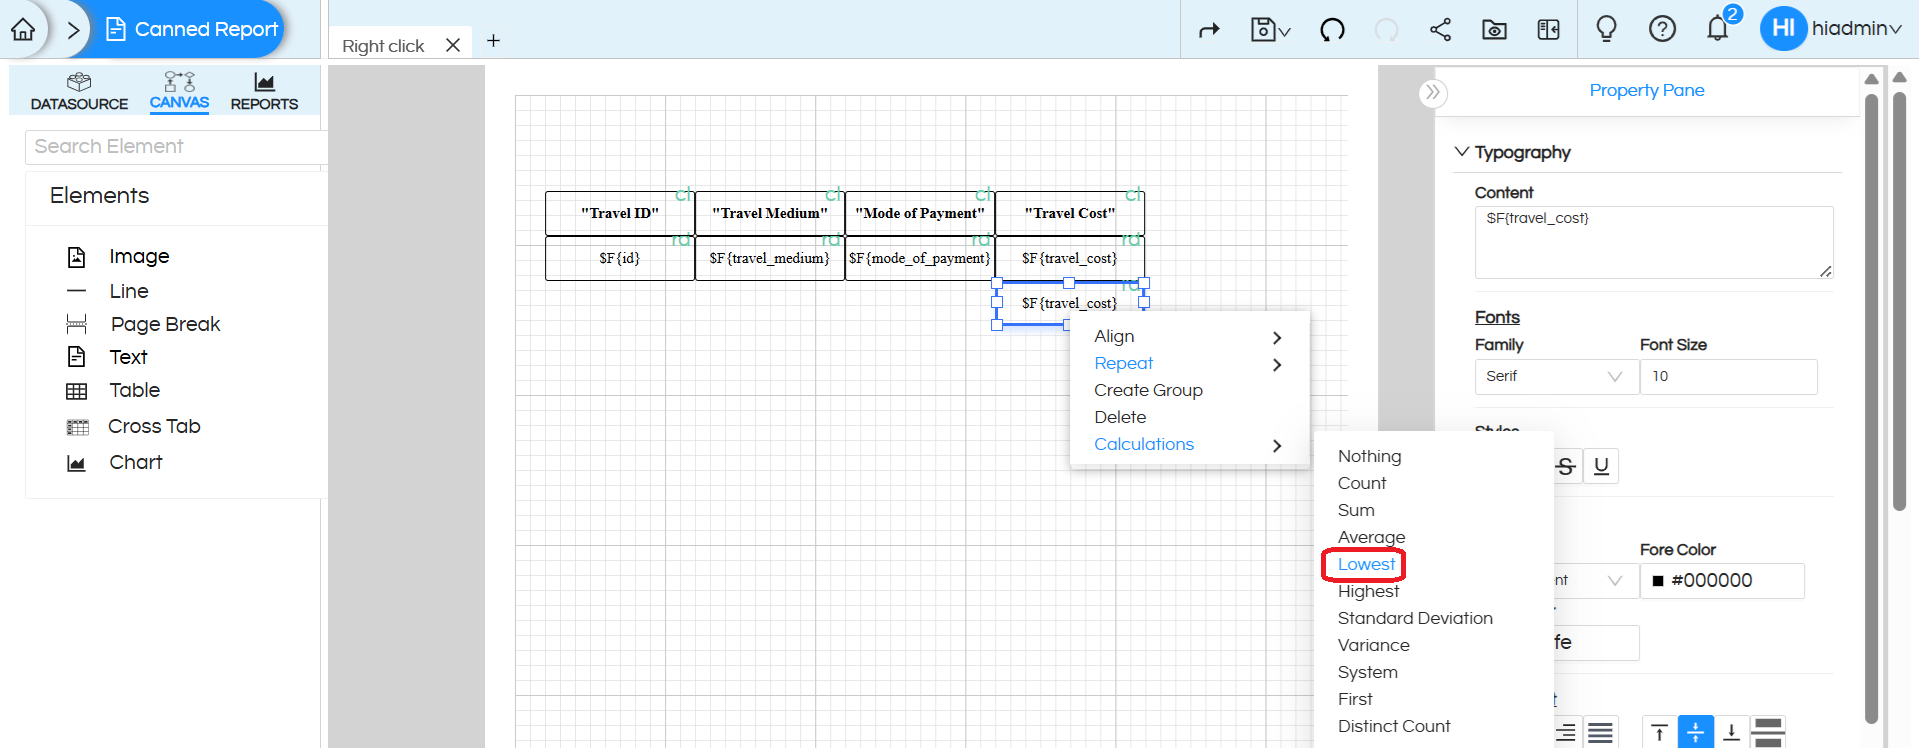
(E) Lowest
Returns the minimum (smallest) value present in the selected numeric field.
The lowest value among all the values is 100

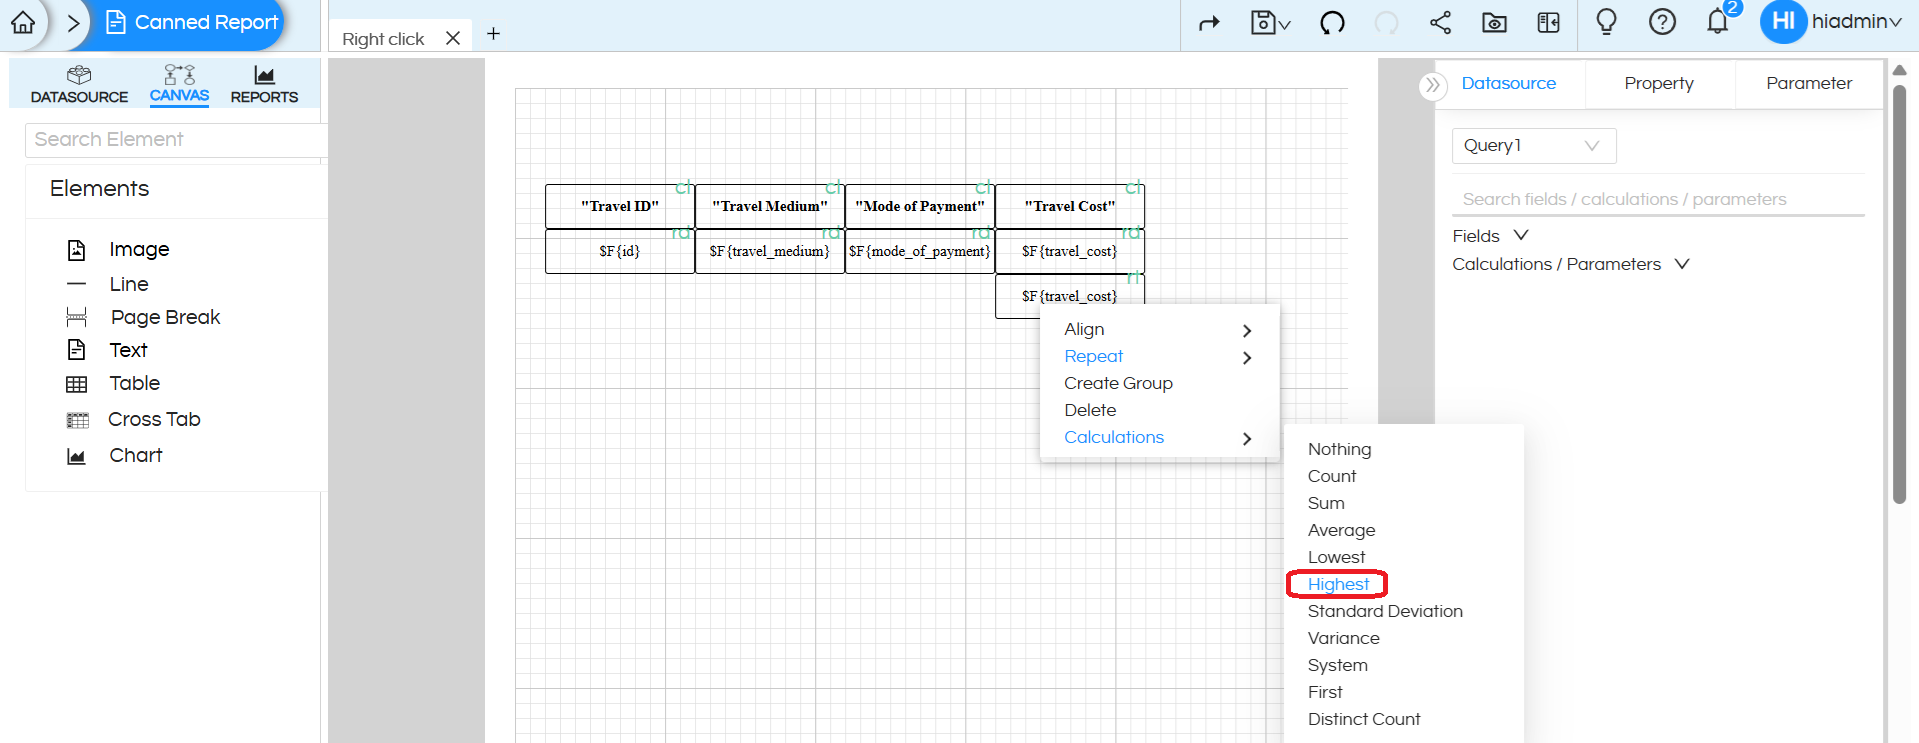
(F) Highest
Returns the maximum (largest) value present in the selected numeric field.
The highest value among all the values is 500

(G) Standard Deviation
Measures the amount of variation or dispersion of values from the average value in the dataset.
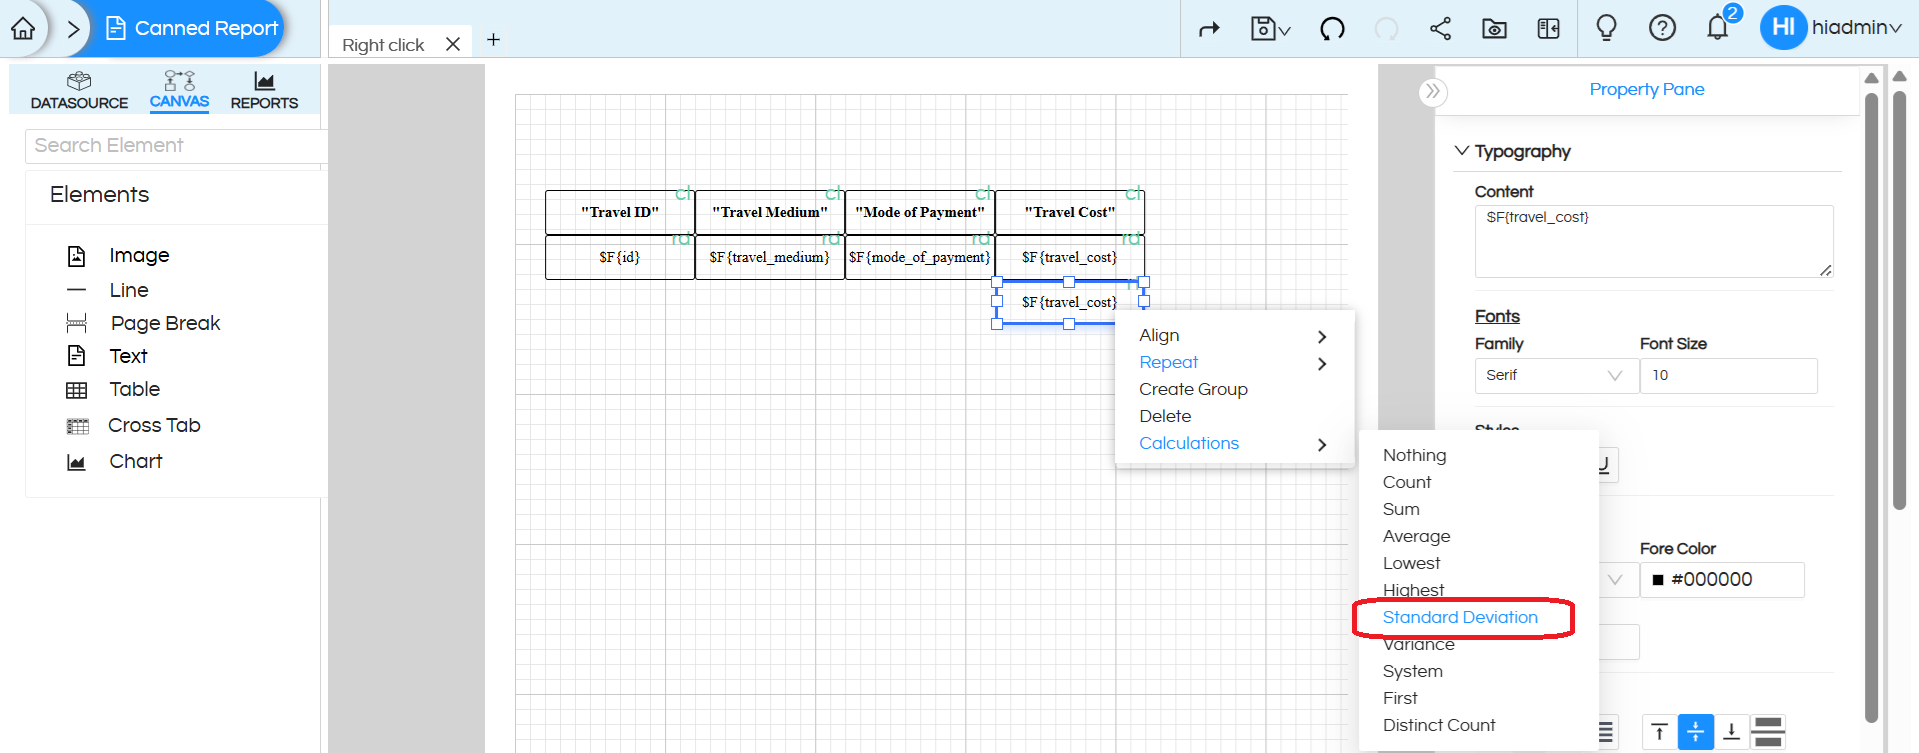
Formula for Standard Deviation = √Variance
Calculation: √20000 = 141.42

(H) Variance
Represents the spread of data values around the mean, calculated as the average of squared differences from the mean
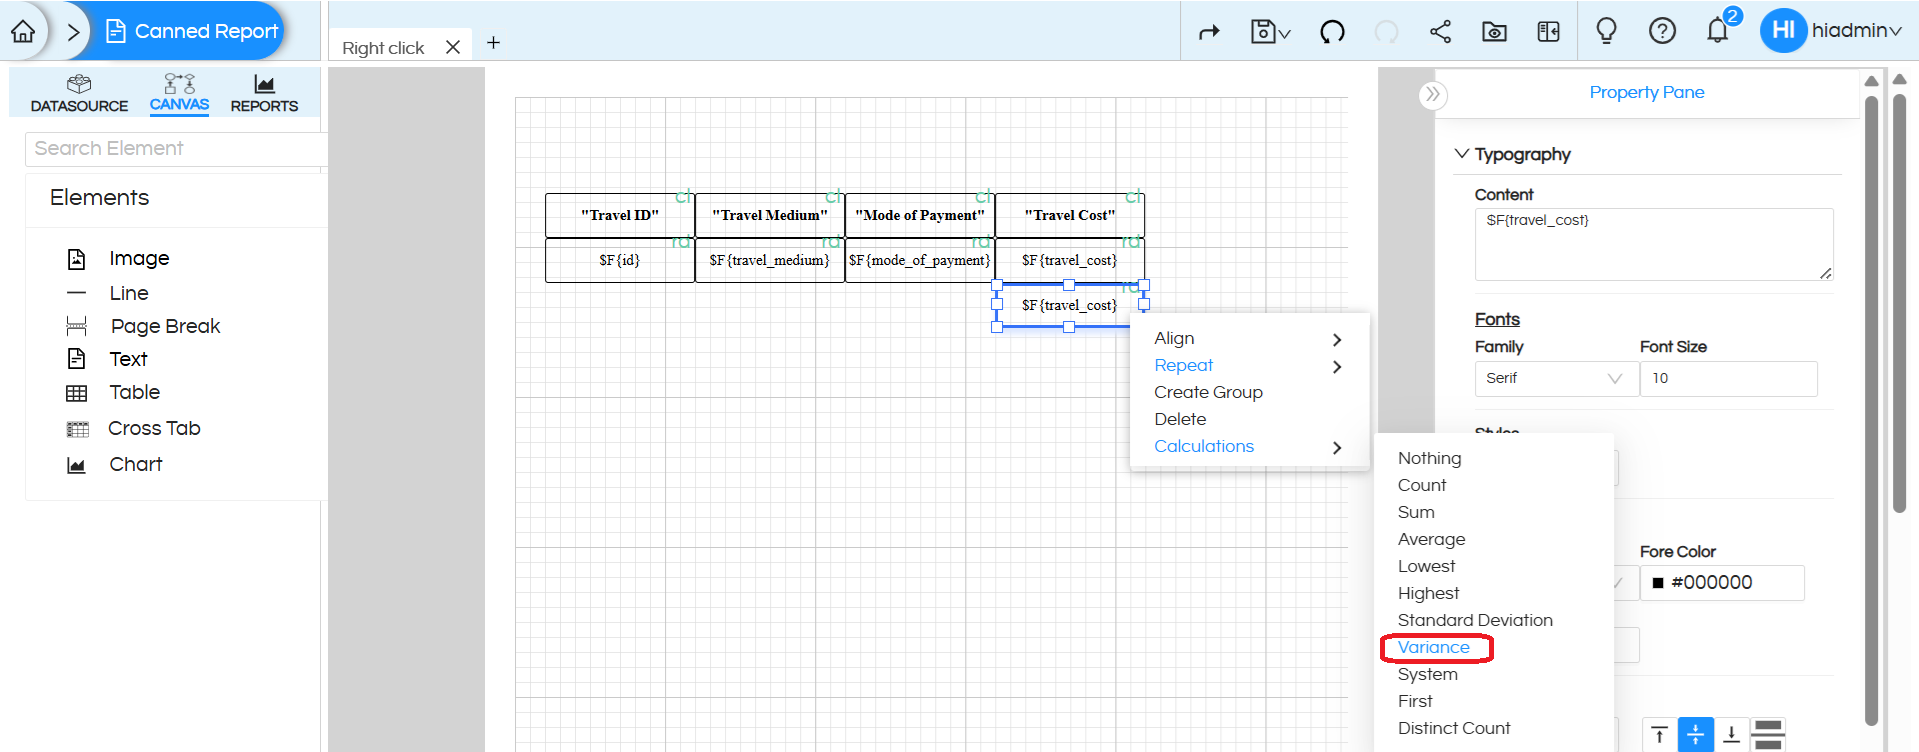
Variance Formula: Var = Σ(x − μ)² / N
Variance: [(100−300)² + (200−300)² + (300−300)² + (400−300)² + (500−300)²] ÷ 5 = 20000

(I) System
Uses the internal calculation handling of to process the field value.
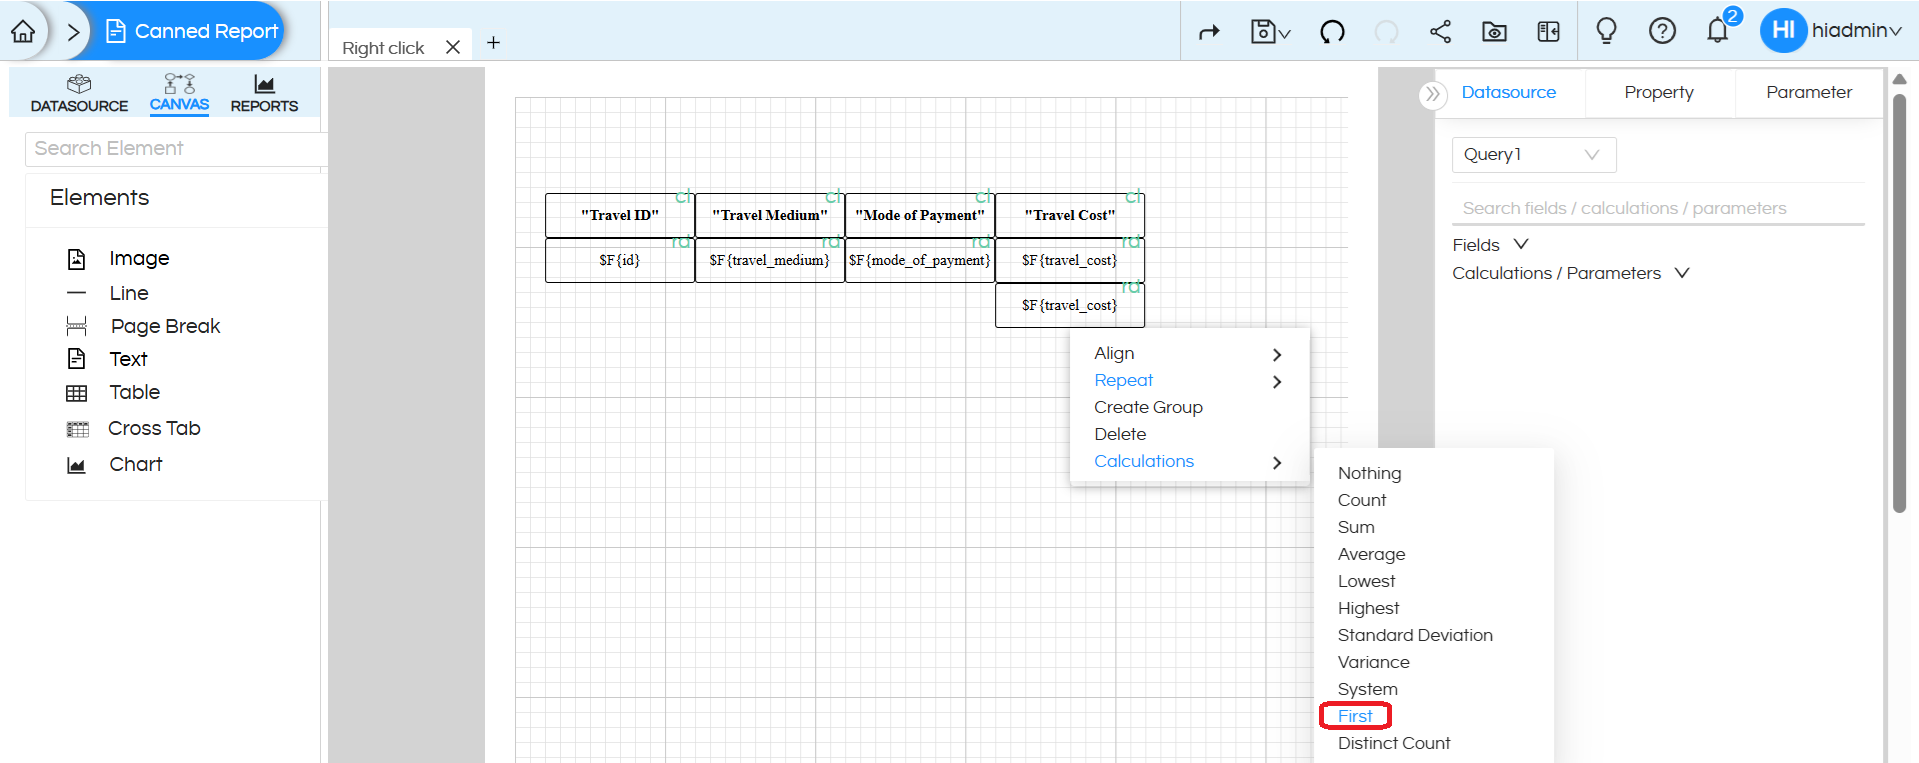
(J) First
Returns the first value encountered in the dataset for the selected field. As you can see that it sees the first value as “100”, and hence shows 100.

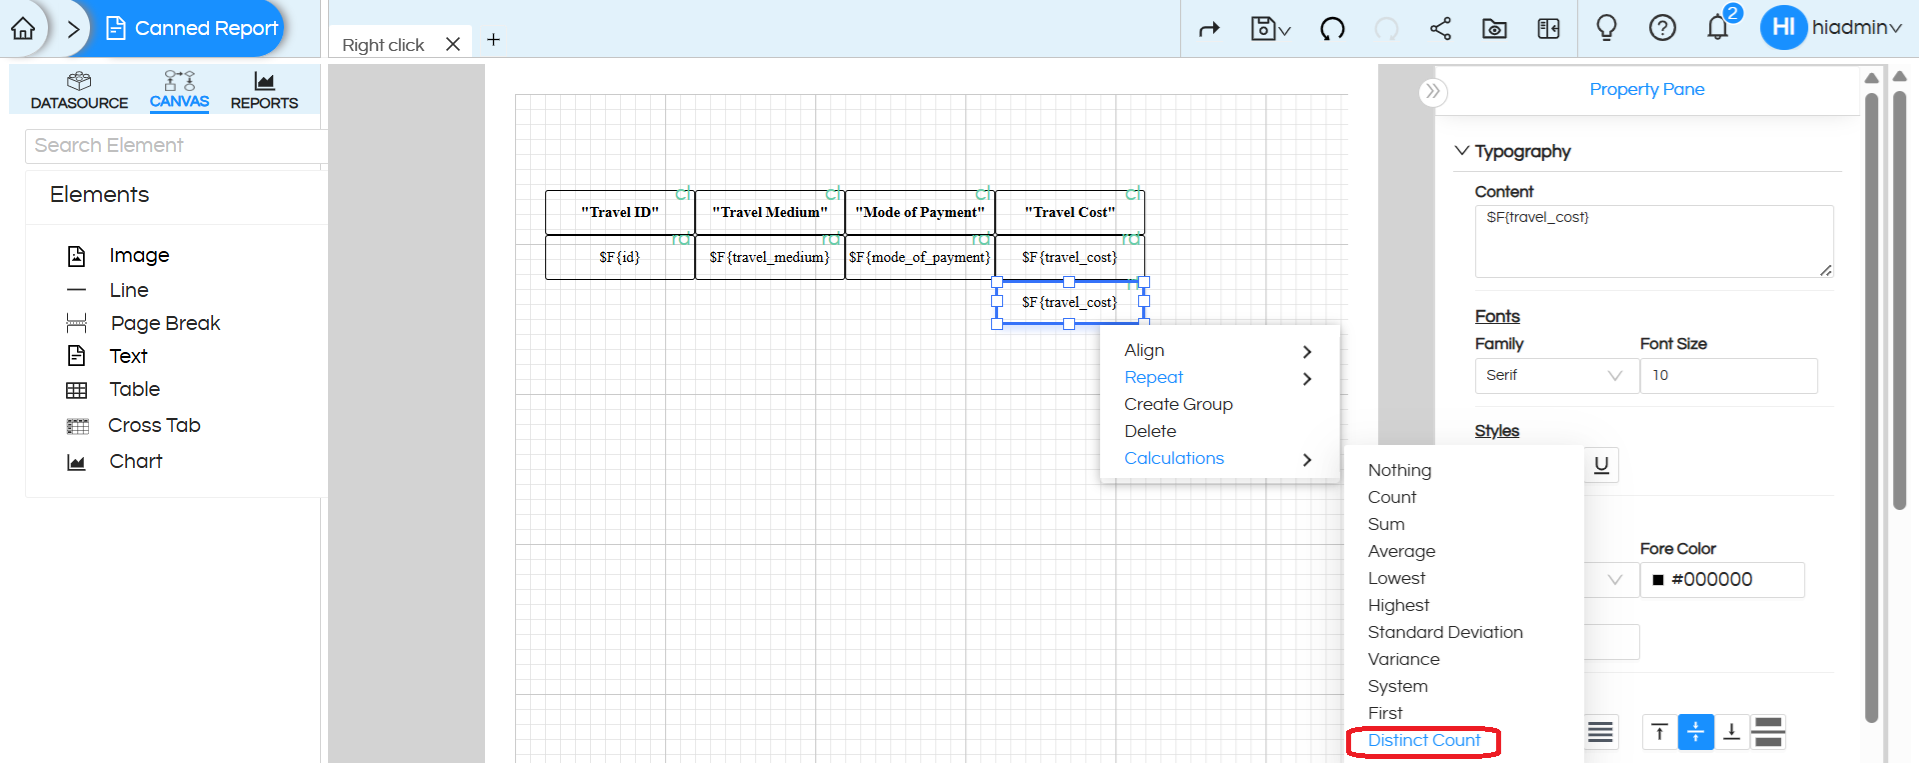
(K) Distinct Count
Counts the number of unique values in the selected field, ignoring duplicate entries

Calculations on text/date Fields:
For text and date fields, only limited calculations such as Count and Distinct Count are supported. Other calculations like Sum, Average, or Total are not applicable since these operations require numeric values.