Filter Properties allow users to customize the appearance of filters by modifying colors and font settings. These properties help enhance the visual styling of filters and improve readability in reports.
Using filter properties, users can change:
- Header Background Color
- Header Text Color
- Header Font Size
- Filter Background Color
- List Text Color
- List Font Size
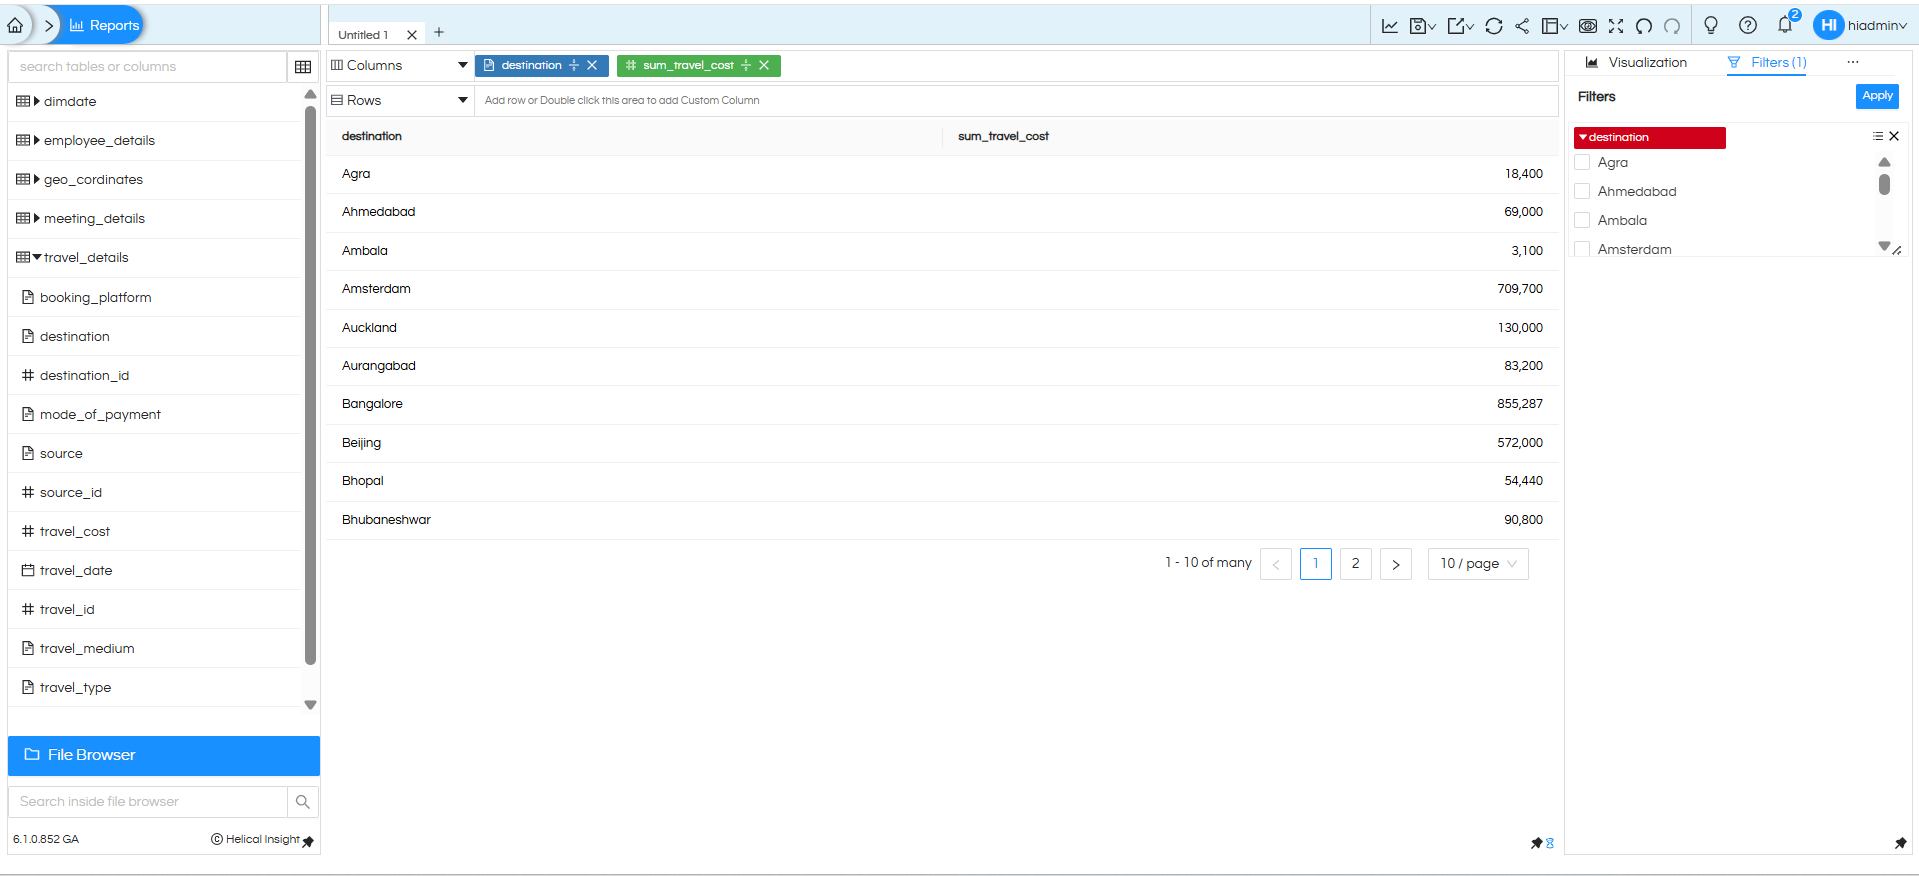
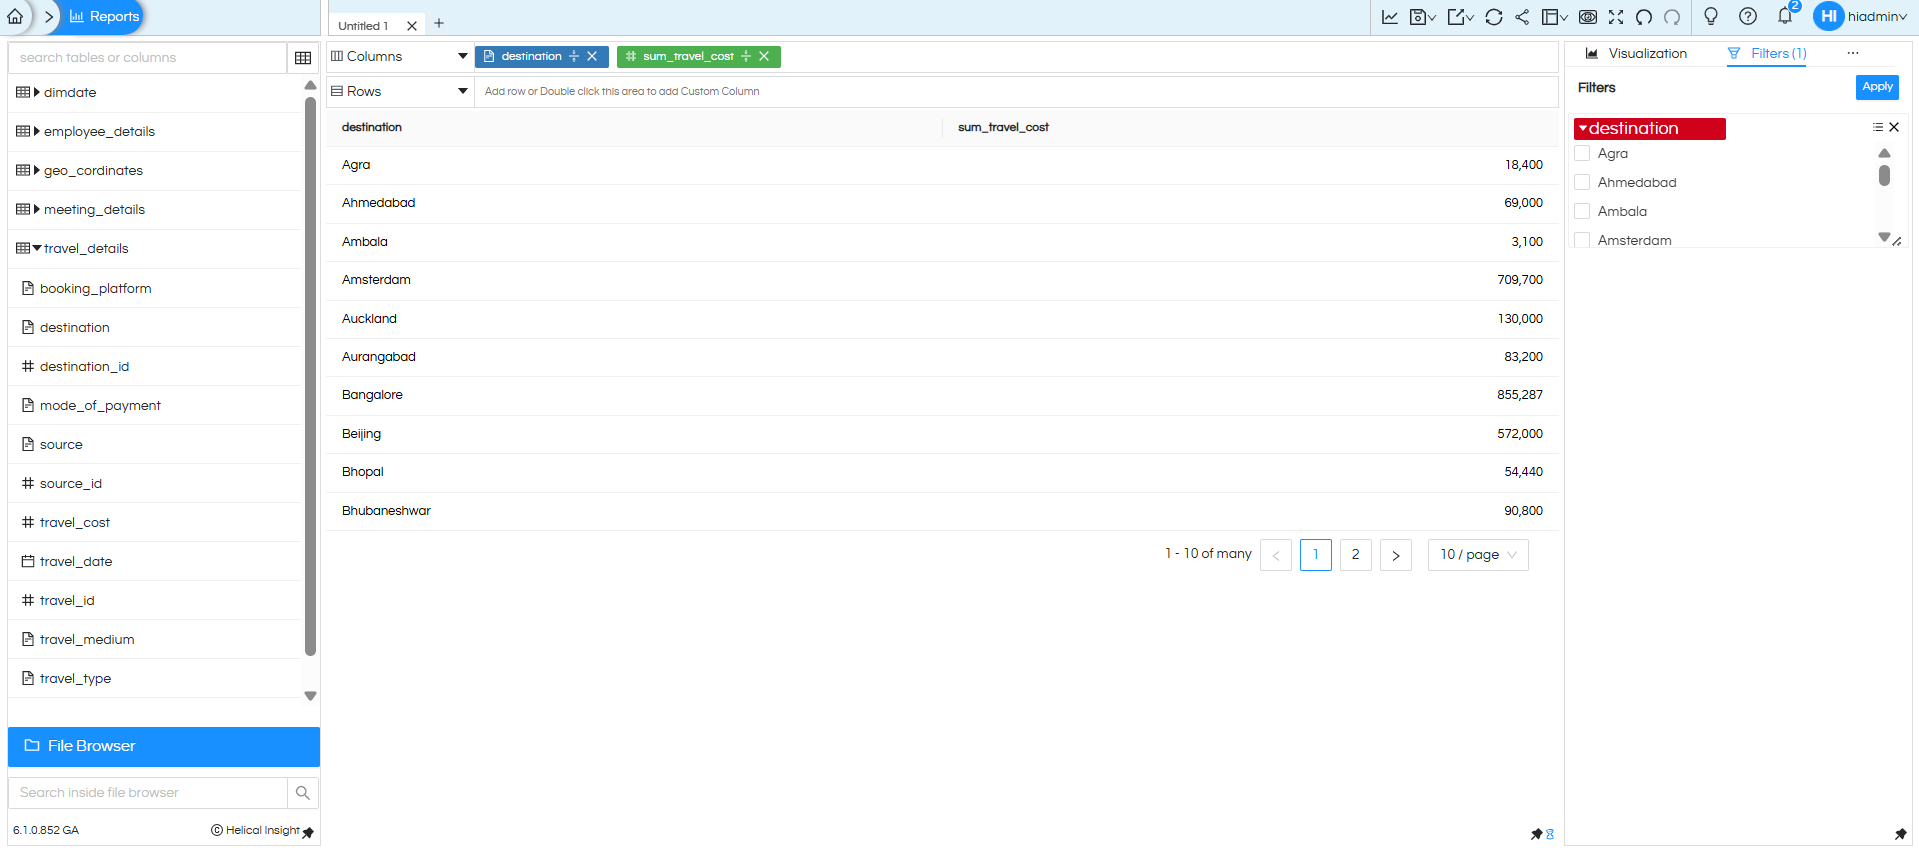
Default Filter View
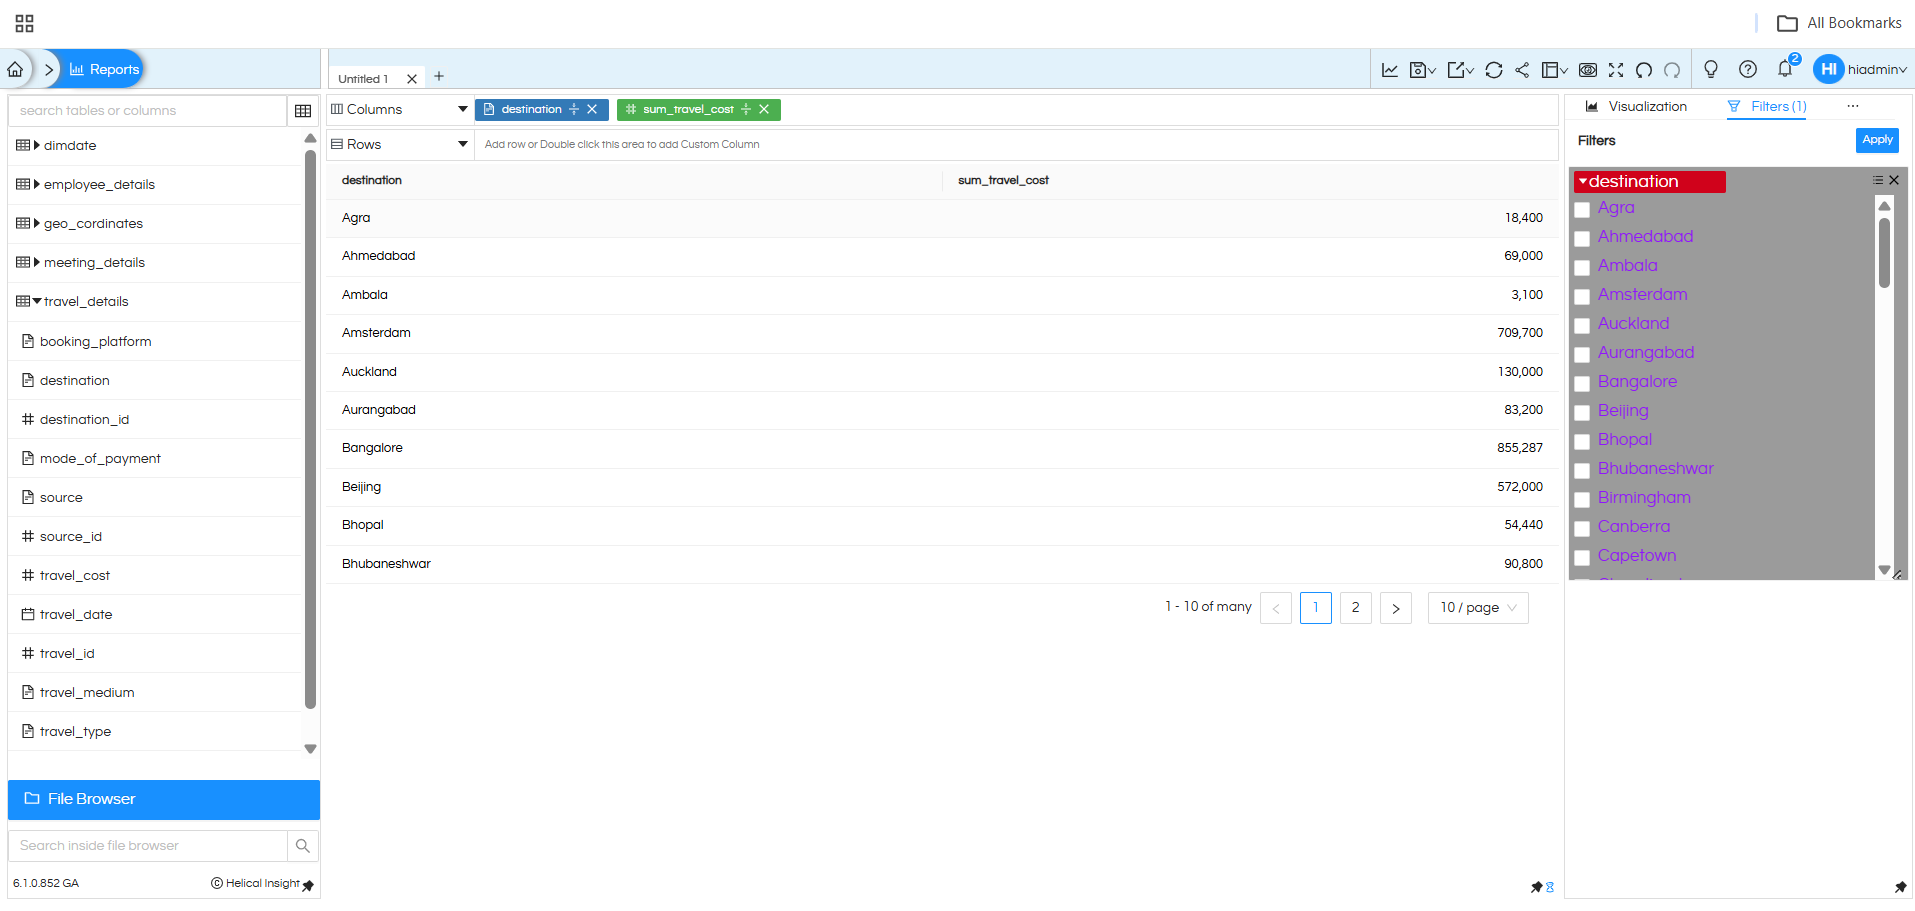
The image below shows the default filter appearance before applying any customization.
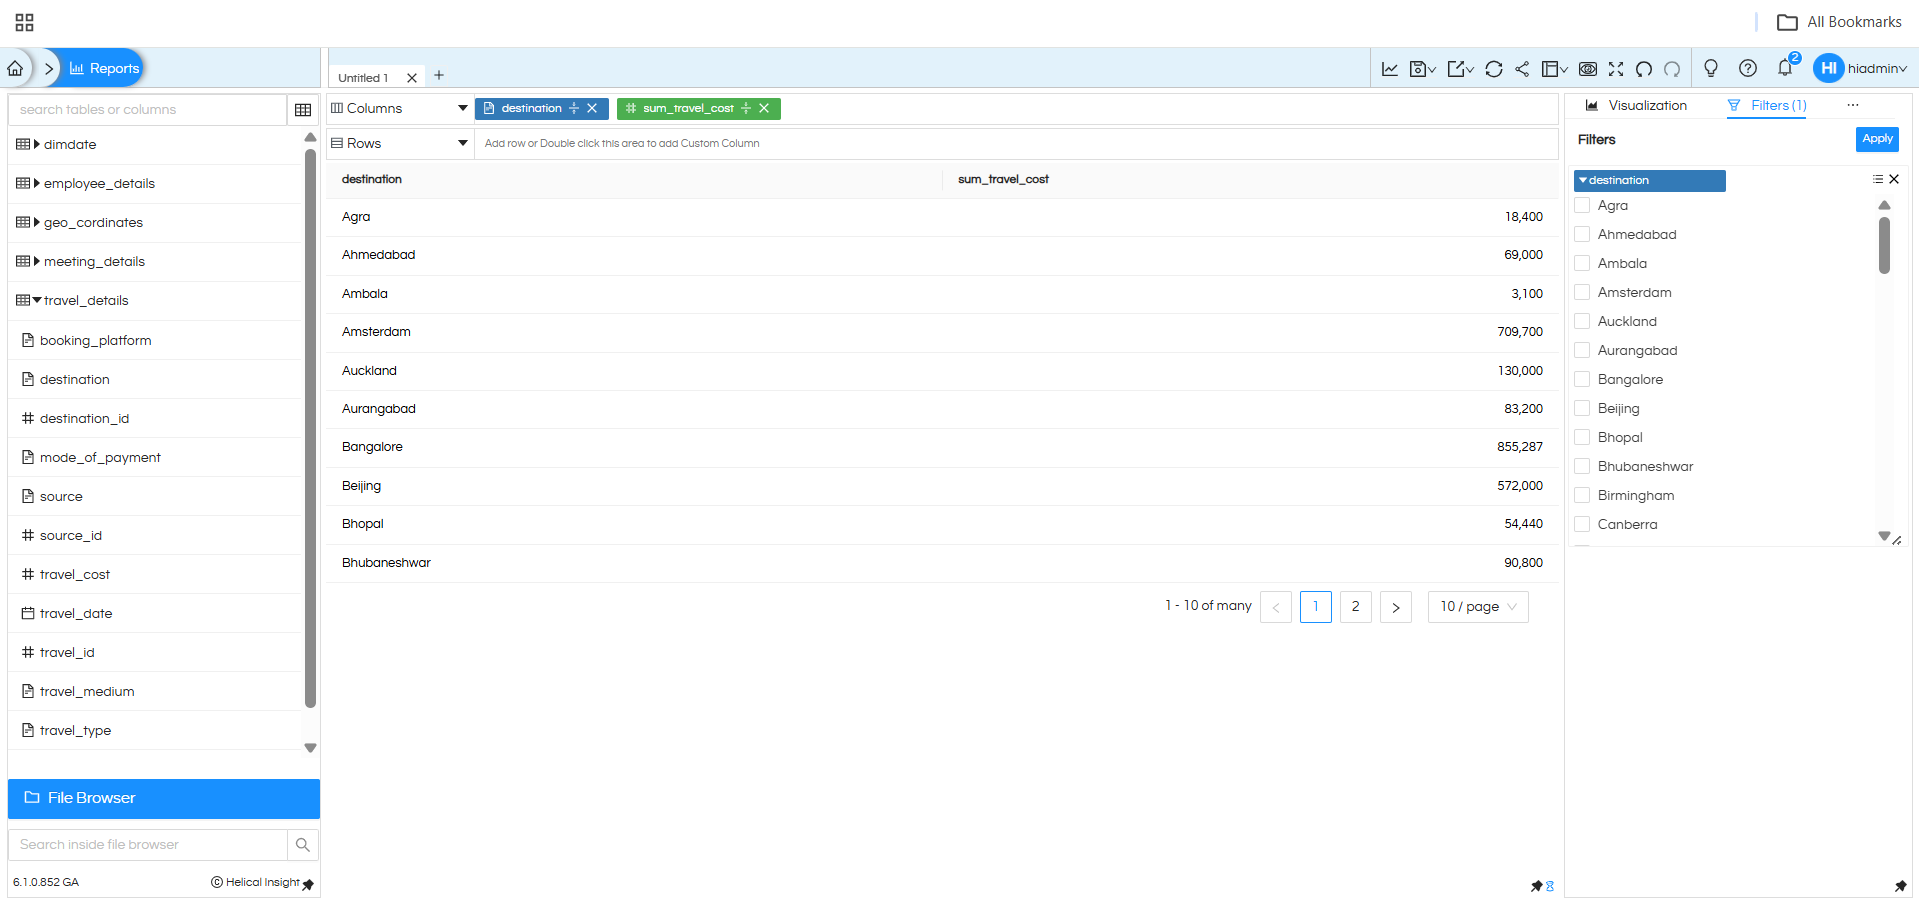
In the default view:
- The filter header appears in blue color.
- The filter list items use the default font size and text color.
How to Access Filter Properties
To customize the filter styling, follow these steps.
Step 1:
Hover over the hamburger icon beside filter option
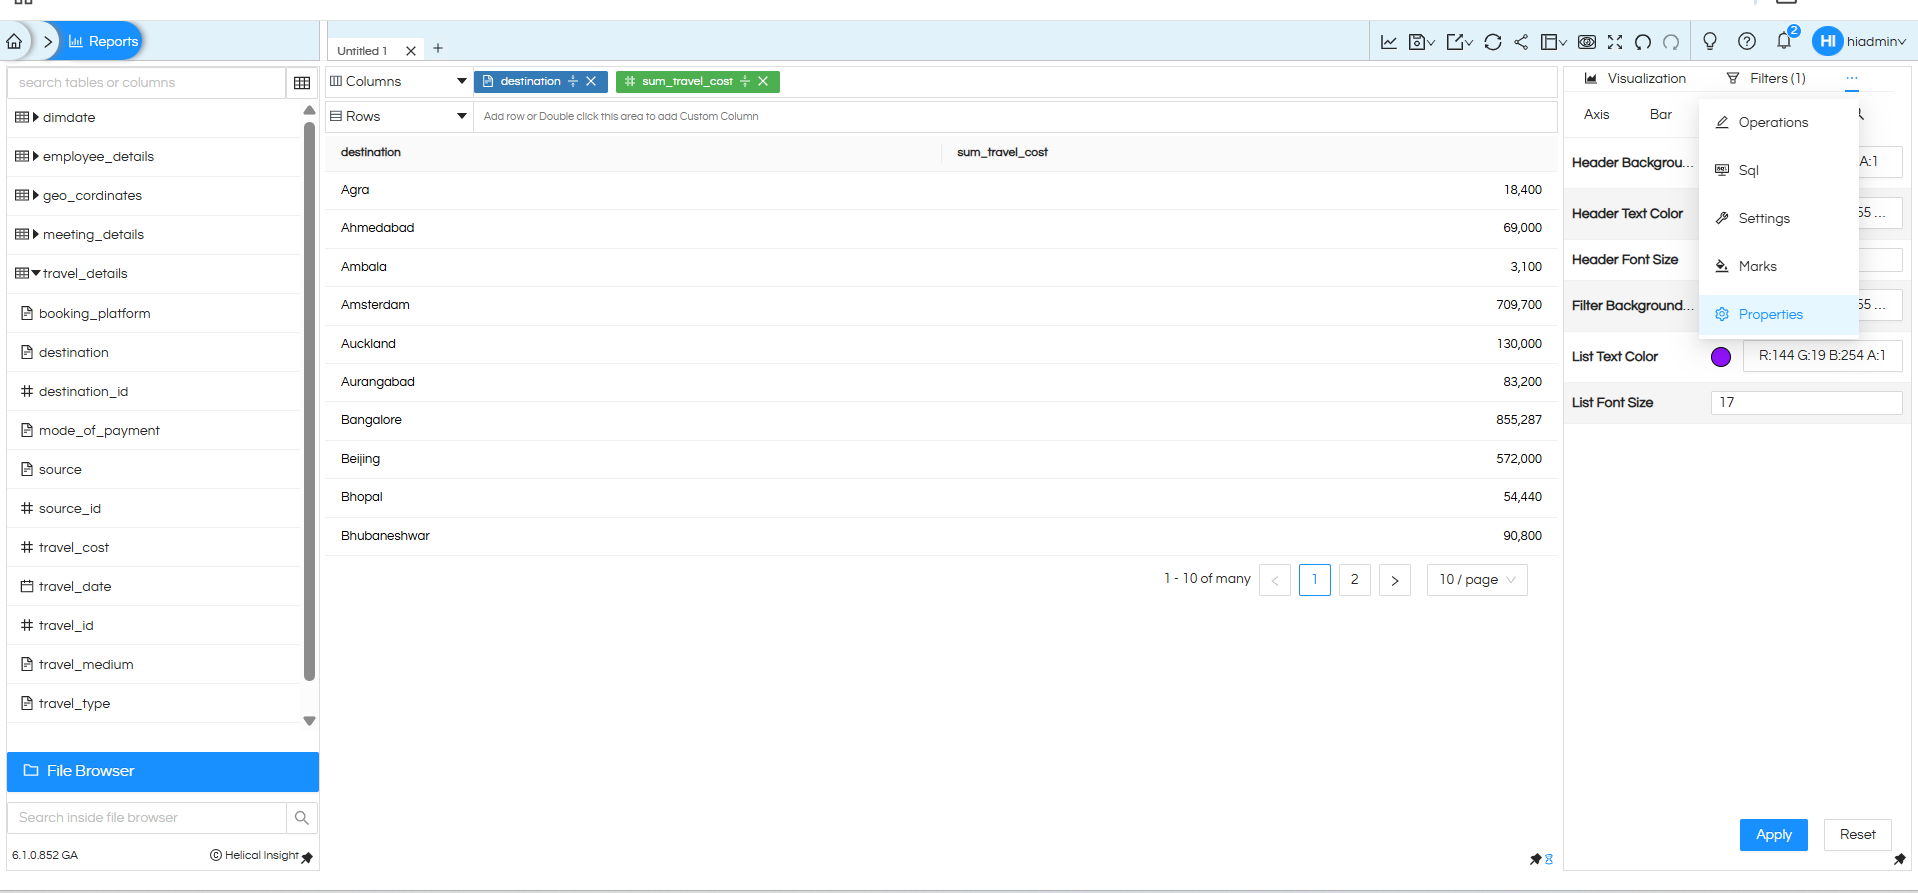
From the menu, click on Properties.
Step 2: Select Filter Properties
After opening Properties, hover over the hamburger icon beside the Bar section.
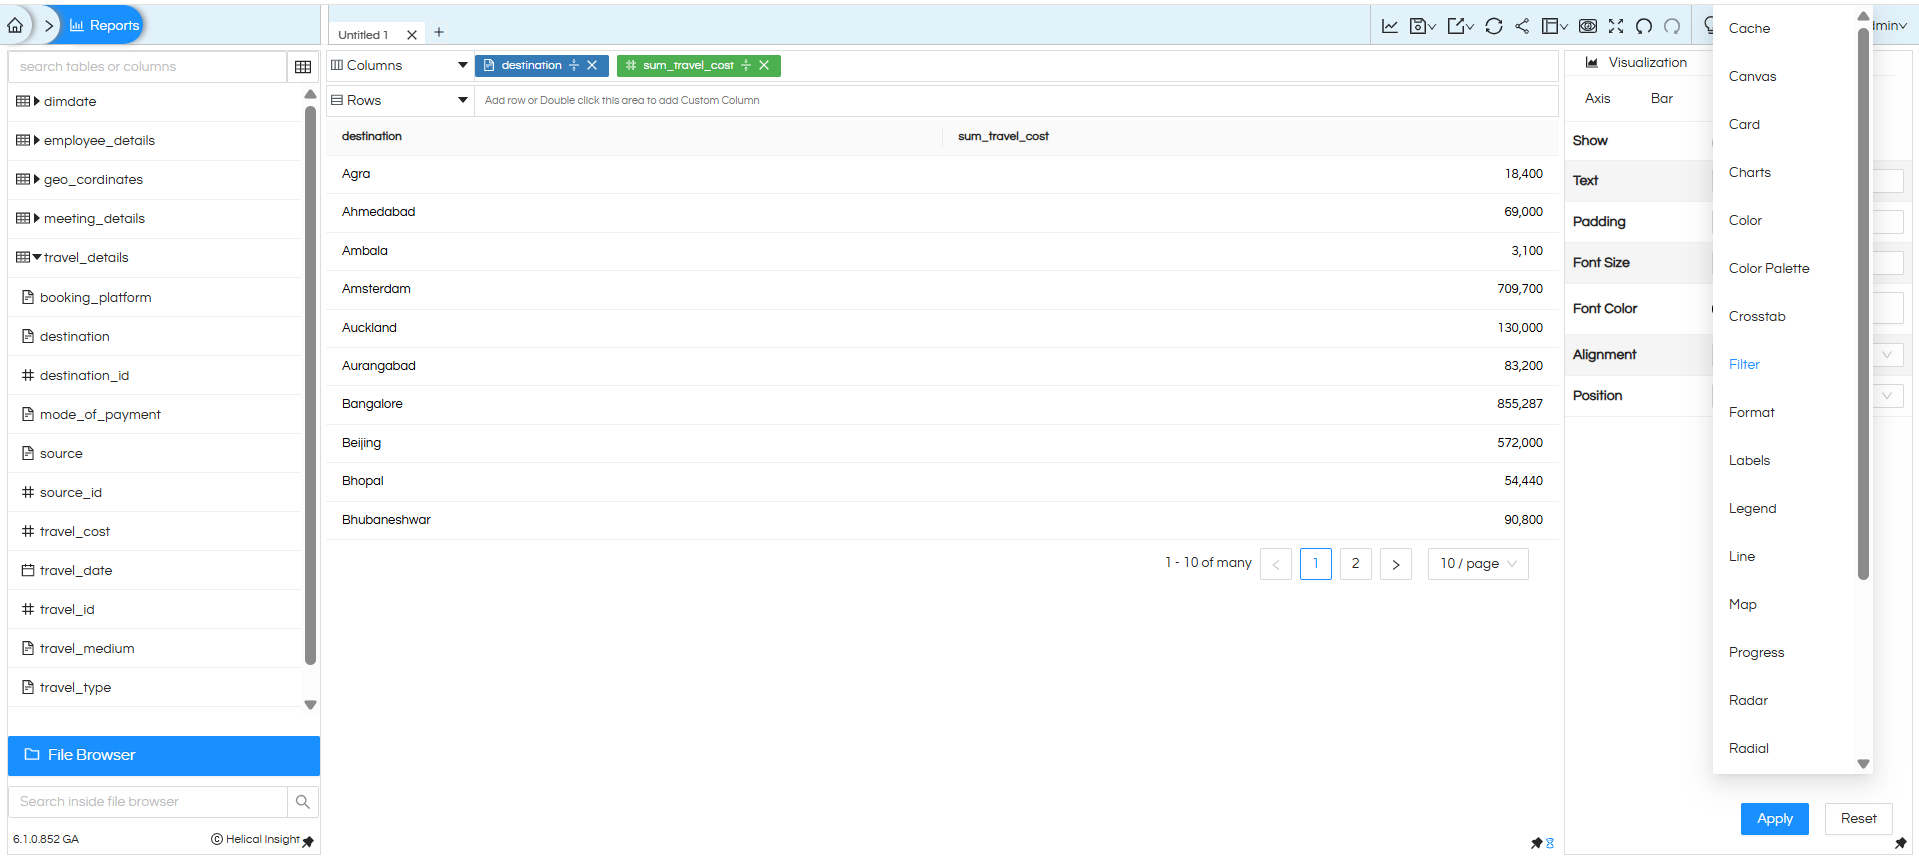
From the dropdown list, select Filter.
This will open the Filter Properties configuration panel.
Filter Properties Panel
The following image shows the Filter Properties settings panel.
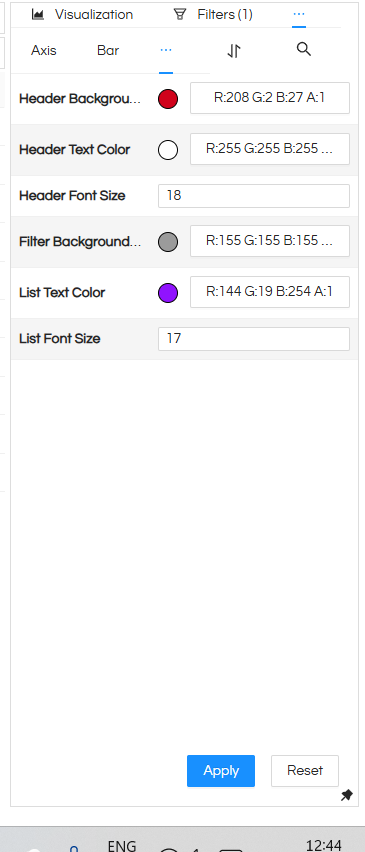
Available settings include:
- Header Background Color
- Header Text Color
- Header Font Size
- Filter Background Color
- List Text Color
- List Font Size
After modifying the settings, click Apply to update the filter appearance.
Header Background Color
This property changes the background color of the filter header.
Example below shows the header color changed from default blue to red.
Header Font Size
This property controls the font size of the filter header text.
Increasing the font size makes the filter header more prominent and improves readability.
Filter Background Color
This property changes the background color of the filter container.
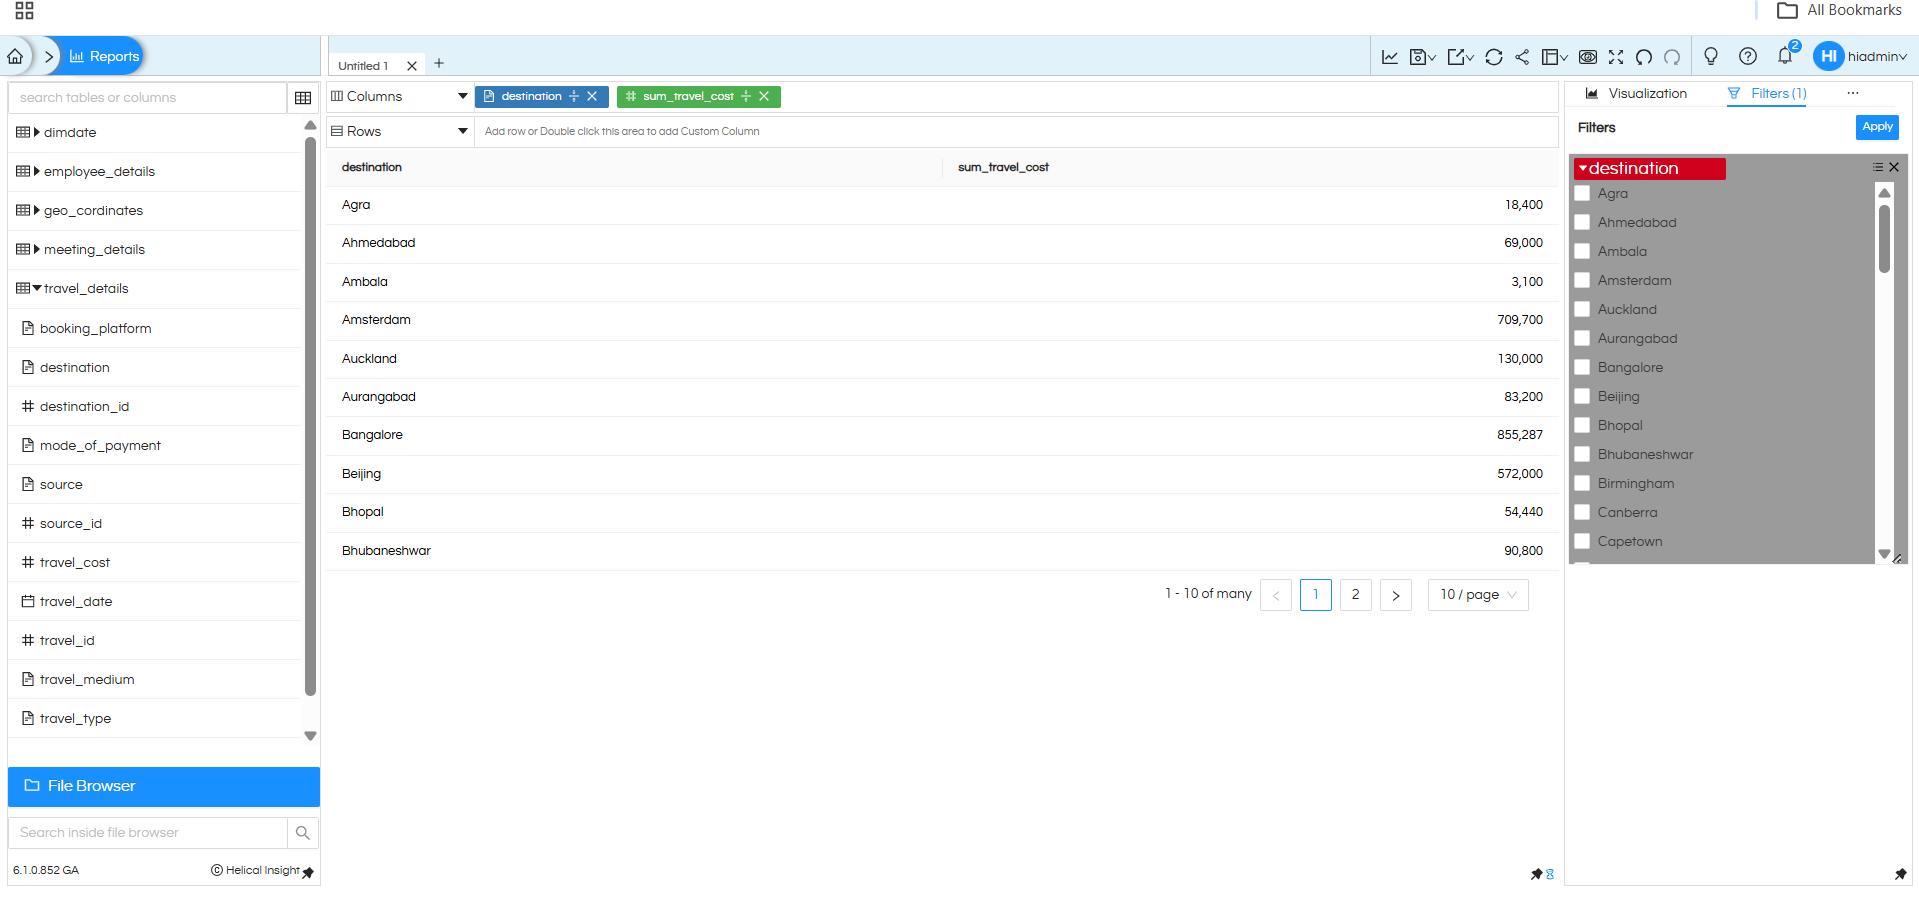
This helps visually separate the filter from other dashboard components.
List Text Color
This property changes the text color of the filter list items.
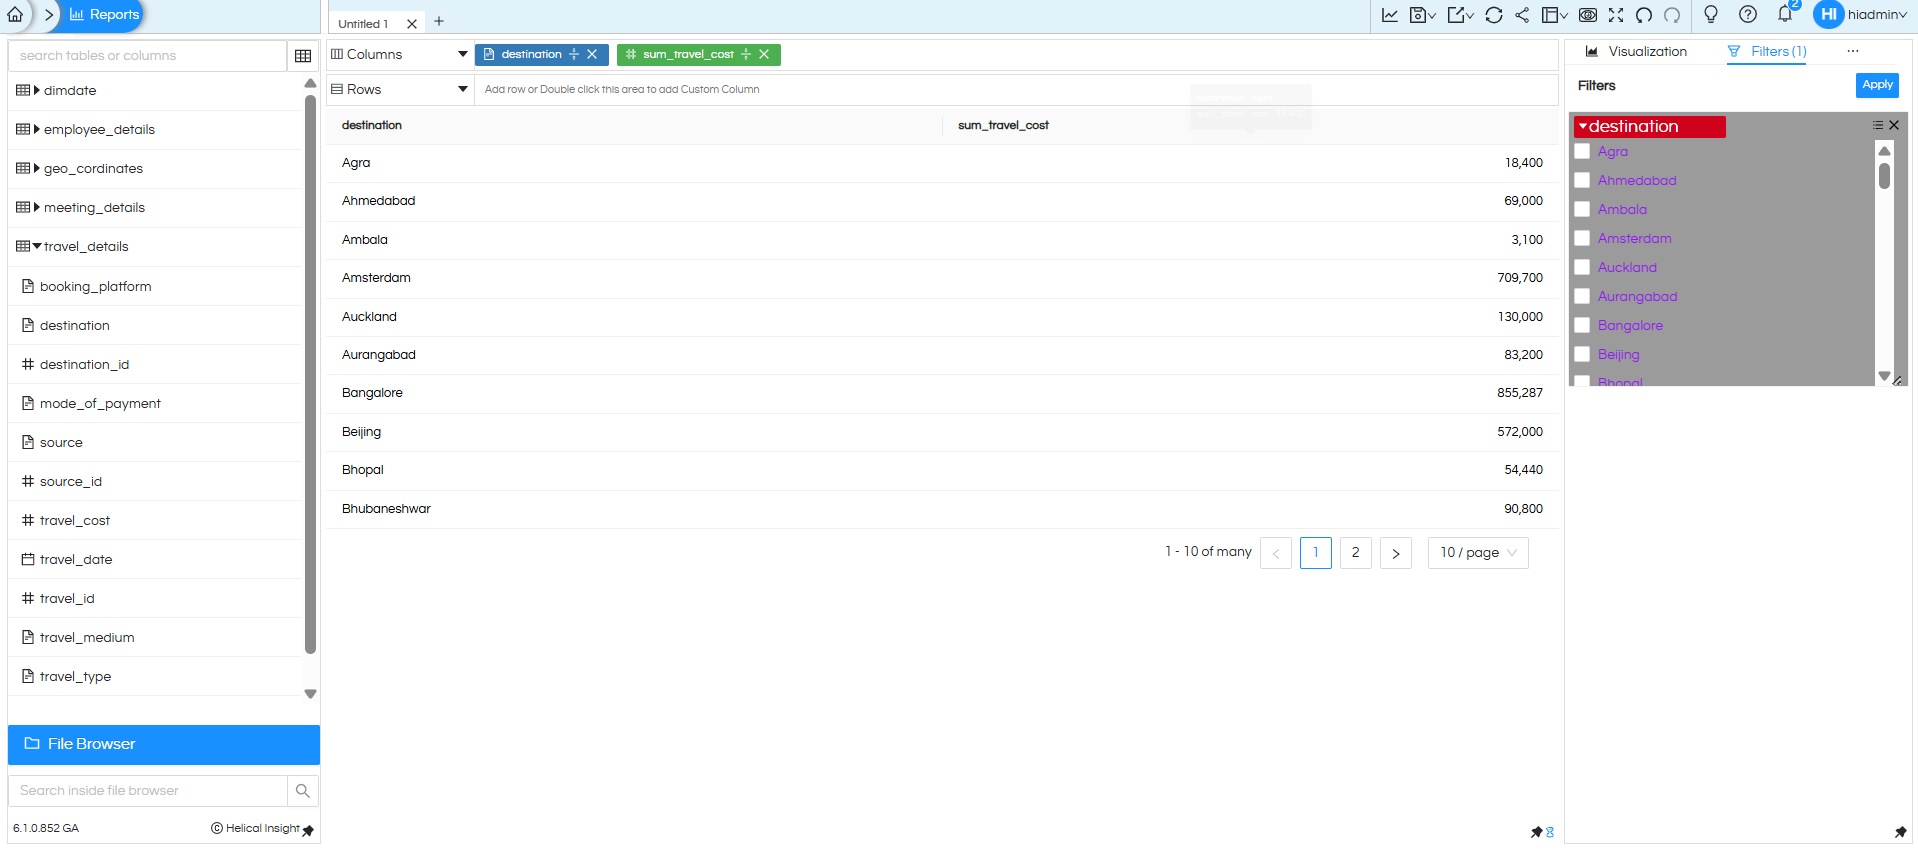
This can be used to highlight filter values or match dashboard themes.
List Font Size
This property changes the font size of the filter list items.
Increasing the list font size improves readability, especially on larger dashboards.
Summary
Filter Properties allow users to easily customize the appearance of filters by modifying:
- Header background color
- Header text color
- Header font size
- Filter background color
- List text color
- List font size
These options help create more visually appealing and user-friendly dashboards.
