Key Takeaways
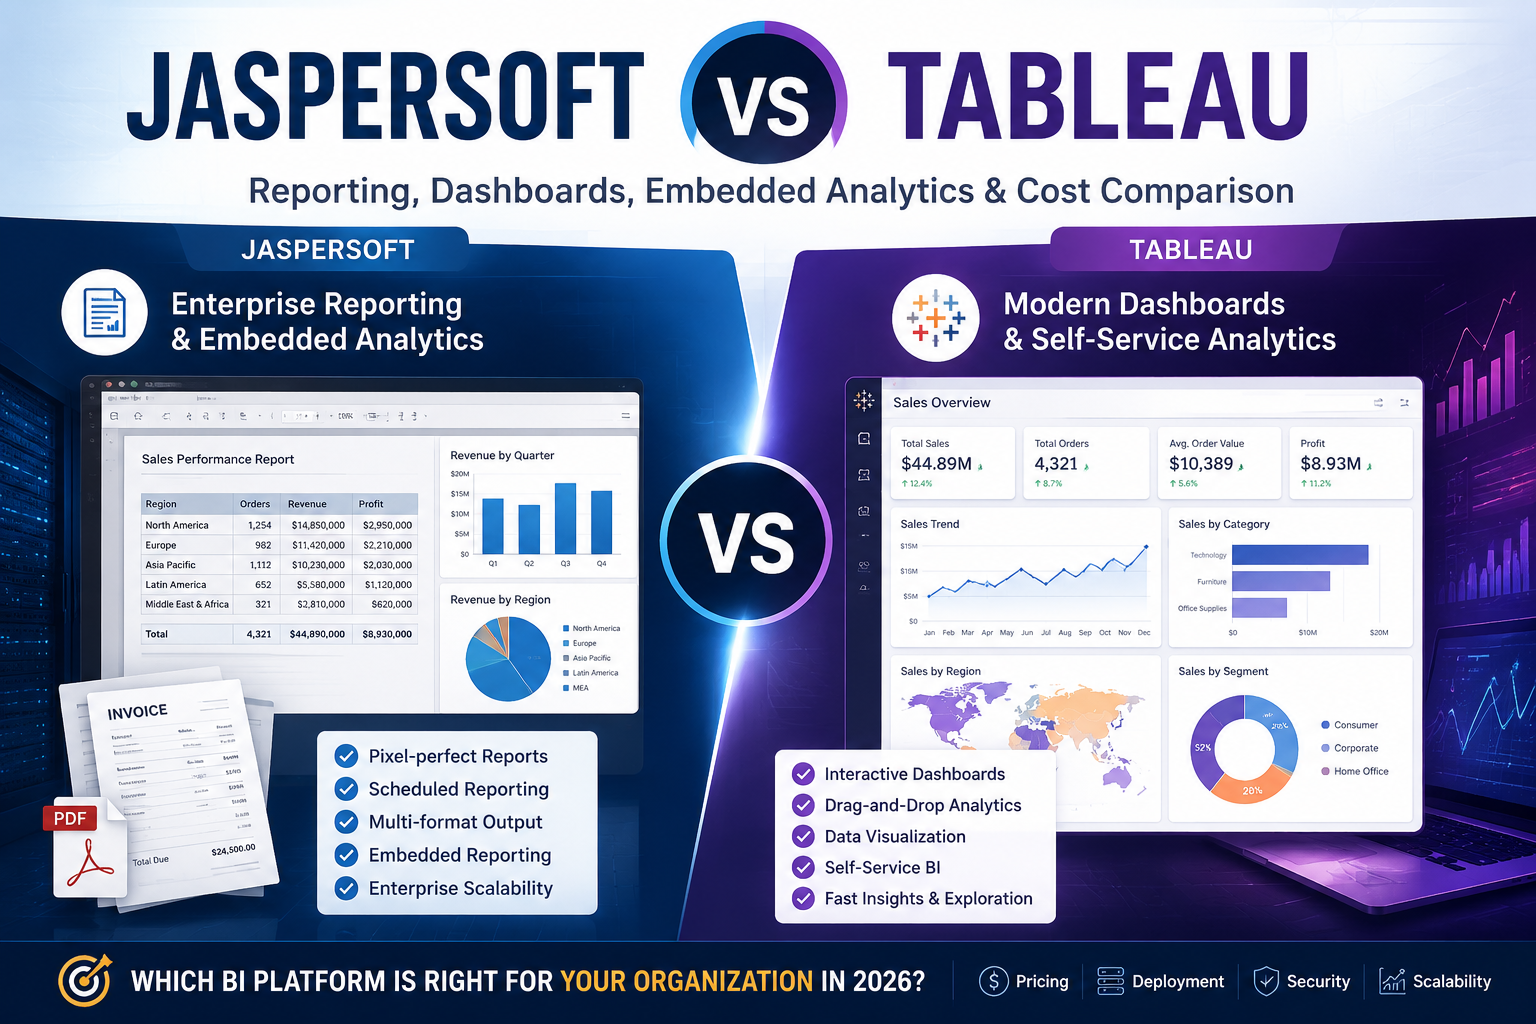
- Tableau: is excellent for dashboards and self-service analytics but lacks strong pixel-perfect, paginated, and canned reporting capabilities.
- Jaspersoft: excels in pixel-perfect, paginated, and scheduled reporting but offers less advanced dashboards and self-service analytics than modern BI platforms.
- Helical Insight brings together pixel-perfect reporting, paginated and canned reports, interactive dashboards, self-service BI, ad hoc reporting, embedded analytics, white-labeling, and multi-tenancy in a single platform. eliminating the need for multiple tools while avoiding expensive per-user licensing costs ( Start Your 30-Day Free Trial ).
- Businesses seeking both reporting and analytics capabilities without high licensing costs frequently evaluate Helical Insight as an alternative to Tableau and Jaspersoft.
If your primary goal is interactive dashboards and data exploration, Tableau is generally the stronger choice.
If your primary goal is enterprise reporting, scheduled report distribution, and embedded reporting, Jaspersoft is often the better fit.
However, many modern organizations need both reporting and analytics capabilities. This is one reason BI buyers increasingly evaluate Helical Insight alongside Jaspersoft and Tableau, especially when requirements extend beyond traditional reporting or dashboarding and include embedded BI, self-service analytics, flexible deployment options, and scalability.
Still Choosing Between Jaspersoft and Tableau?
Helical Insight combines enterprise reporting, interactive dashboards, embedded analytics, and self-service BI in a single platform—helping organizations get the capabilities they need while reducing BI costs by up to 90%.
Jaspersoft vs Tableau: Feature Comparison
Both Jaspersoft and Tableau address business intelligence requirements, but they excel in different areas. The comparison below highlights where each platform is strongest and which use cases they are typically optimized for.
- Jaspersoft stands out in reporting, embedded analytics, scheduled distribution, white-labeling, and developer-focused customization.
- Tableau excels in dashboarding, visual analytics, self-service BI, and business-user adoption.
- Organizations that need both reporting and analytics capabilities often expand their evaluation beyond these two platforms and review solutions such as Helical Insight( download 30-day free trial ), Power BI, and Looker.
- The best choice depends on whether your priority is reporting, analytics, embedded BI, or a combination of all three.
Reduce BI Costs Without Sacrificing Features
Get enterprise reporting, dashboards, embedded analytics, and self-service BI in one platform. Many organizations choose Helical Insight to reduce BI costs by up to 90%.
Understanding Jaspersoft
Jaspersoft is best suited for organizations that prioritize enterprise reporting and embedded analytics.
Many organizations depend on operational reports to manage day-to-day business processes. These reports require consistency, accuracy, formatting precision, and automated delivery.
Common Reporting Use Cases
Key Strengths of Jaspersoft
Check Jaspersoft Alternatives
Understanding Tableau
Tableau is best suited for organizations focused on visual analytics and self-service business intelligence.
Rather than emphasizing report generation, Tableau focuses on helping users interact with data, discover trends, and uncover insights through visual exploration.
What Users Can Do with Tableau
Tableau’s focus on intuitive visual analytics and self-service exploration has helped it become one of the most widely recognized analytics platforms globally. For organizations seeking broad analytics adoption across business teams, Tableau remains a compelling choice.
Check Tableau Alternatives
Which Platform Is Better for Dashboards?
Tableau is generally stronger for interactive dashboard creation.
Tableau’s visual-first design helps users explore data naturally and uncover patterns quickly. Business teams can build and modify dashboards with minimal technical involvement, making Tableau particularly attractive for organizations pursuing self-service analytics initiatives.
Need Both Reporting and Dashboards?
Why manage multiple BI tools? Helical Insight combines reporting, dashboards, embedded analytics, and self-service BI within a single platform.
Which Platform Is Better for Embedded Analytics?
Jaspersoft generally has the advantage when embedded reporting is a core requirement.
Software vendors and SaaS providers frequently need analytics embedded directly within customer-facing applications. Jaspersoft has historically performed well in these environments due to its reporting-centric architecture and embedding capabilities.
Common Embedded Analytics Requirements
Which Platform Is Easier for Business Users?
Tableau is typically easier for business users and analysts.
Tableau’s drag-and-drop interface enables faster dashboard creation while reducing dependency on technical teams. Business users can explore data independently and generate insights without extensive training.
Jaspersoft often requires greater involvement from developers, report designers, or administrators, particularly in complex reporting environments.
What If You Need Both Reporting and Analytics?
This is one of the most common challenges in BI platform selection.
📑 Jaspersoft
Often viewed as a reporting-first platform.
📊 Tableau
Often viewed as an analytics-first platform.
The reality is that many organizations require multiple capabilities within a single ecosystem.
Looking for Embedded Analytics?
Build customer-facing analytics with embedded dashboards, reporting, white-labeling, multi-tenancy, and API integration—all from a single BI platform.
What Are Organizations Evaluating Alongside Jaspersoft and Tableau?
Today’s BI buyers rarely compare only two products. Instead, they evaluate a broader ecosystem of analytics solutions.
Common Evaluation Criteria
As a result, platforms such as Helical Insight, Power BI, Looker, and other analytics solutions frequently appear in modern BI evaluations alongside Jaspersoft and Tableau.
Modern BI evaluations focus less on solving a single reporting or dashboarding challenge and more on selecting a platform that can support long-term analytics growth, scalability, governance, and future business requirements.
Why Do Organizations Compare Jaspersoft and Tableau?
At first glance, Jaspersoft and Tableau appear to compete in the same category. Both platforms help organizations transform data into actionable business insights.
Both Help Organizations:
While their capabilities overlap in several areas, they were built with fundamentally different priorities.
📑 Jaspersoft’s Foundation
Jaspersoft originated from the reporting world. Its core strength has always been delivering structured, repeatable, highly formatted reports that organizations can schedule, distribute, and embed into applications.
📊 Tableau’s Foundation
Tableau emerged from the data visualization world. Its primary focus has been helping users discover patterns, trends, and insights through interactive dashboards and self-service data exploration.
⚠ Why This Difference Matters
Organizations rarely struggle with BI projects because a platform lacks features. More often, projects underperform because the selected platform is optimized for a different use case than the organization’s actual needs. Understanding whether your priority is reporting, analytics, dashboarding, or a combination of all three is often more important than comparing feature checklists alone.
Before You Choose Jaspersoft or Tableau
Compare Helical Insight for reporting, dashboards, embedded analytics, and self-service BI. See how organizations achieve enterprise BI capabilities while significantly lowering total ownership costs.
FAQs About Jaspersoft vs Tableau
1. Which is better: Jaspersoft or Tableau?
The answer depends on your requirements. Jaspersoft is generally stronger for enterprise reporting, scheduled report distribution, and embedded reporting. Tableau is typically stronger for interactive dashboards, visual analytics, and self-service data exploration. Organizations that need both reporting and analytics often evaluate additional platforms to determine the best overall fit.
2. Is Jaspersoft a good alternative to Tableau?
Jaspersoft can be a strong alternative to Tableau for organizations whose primary focus is reporting and embedded analytics. However, if dashboarding and visual exploration are the main priorities, Tableau often provides a more user-friendly analytics experience.
3. Why do organizations compare Jaspersoft and Tableau?
Organizations compare Jaspersoft and Tableau because both help users access data, analyze performance, and share insights. The difference is that Jaspersoft was designed primarily for reporting, while Tableau was designed primarily for visual analytics and self-service BI.
4. Which platform is better for enterprise reporting?
Jaspersoft is generally considered the stronger enterprise reporting solution. It supports pixel-perfect reports, report scheduling, automated distribution, multiple export formats, and embedded reporting capabilities commonly required by enterprises.
5. Which platform is better for dashboards and data visualization?
Tableau is widely recognized as one of the leading dashboarding and visualization platforms. Its drag-and-drop interface and extensive visualization capabilities make it particularly effective for business users and analysts.
6. Which platform is better for embedded analytics?
Jaspersoft is often preferred when embedded analytics is a major requirement. Organizations building customer-facing applications frequently use embedded reporting, white-labeling, multi-tenancy, and API integrations that align well with Jaspersoft’s strengths.
7. Is Tableau easier for business users than Jaspersoft?
In most cases, yes. Tableau is designed around self-service analytics and visual exploration. Business users can often create dashboards and analyze data without significant technical assistance, whereas Jaspersoft implementations may require more involvement from developers and administrators.
8. What are the most important factors to consider when choosing between Jaspersoft and Tableau?
Key factors include reporting requirements, dashboarding needs, embedded analytics capabilities, self-service BI requirements, scalability, security, deployment options, integration requirements, and total cost of ownership. The best platform depends on which of these factors are most important to your organization.
9. What alternatives should be evaluated alongside Jaspersoft and Tableau?
Many organizations evaluate additional analytics platforms such as Helical Insight, Power BI, Looker, Apache Superset, Metabase, and other BI solutions. This broader evaluation helps teams determine which platform best supports both current and future analytics requirements.
10. What is the best BI platform for organizations that need reporting, dashboards, and embedded analytics?
There is no single answer for every organization. Businesses that require reporting, dashboarding, embedded analytics, self-service BI, and customer-facing analytics often evaluate multiple platforms to identify the solution that provides the best balance of functionality, scalability, flexibility, and long-term value.
