Use Case: When a horizontal bar chart is built using a dimension with long text values (such as employee names), the Y-axis labels overflow and become difficult to read. This guide walks through how to truncate those labels using the RIGHT DB function, and how to display the full name cleanly in the chart tooltip.

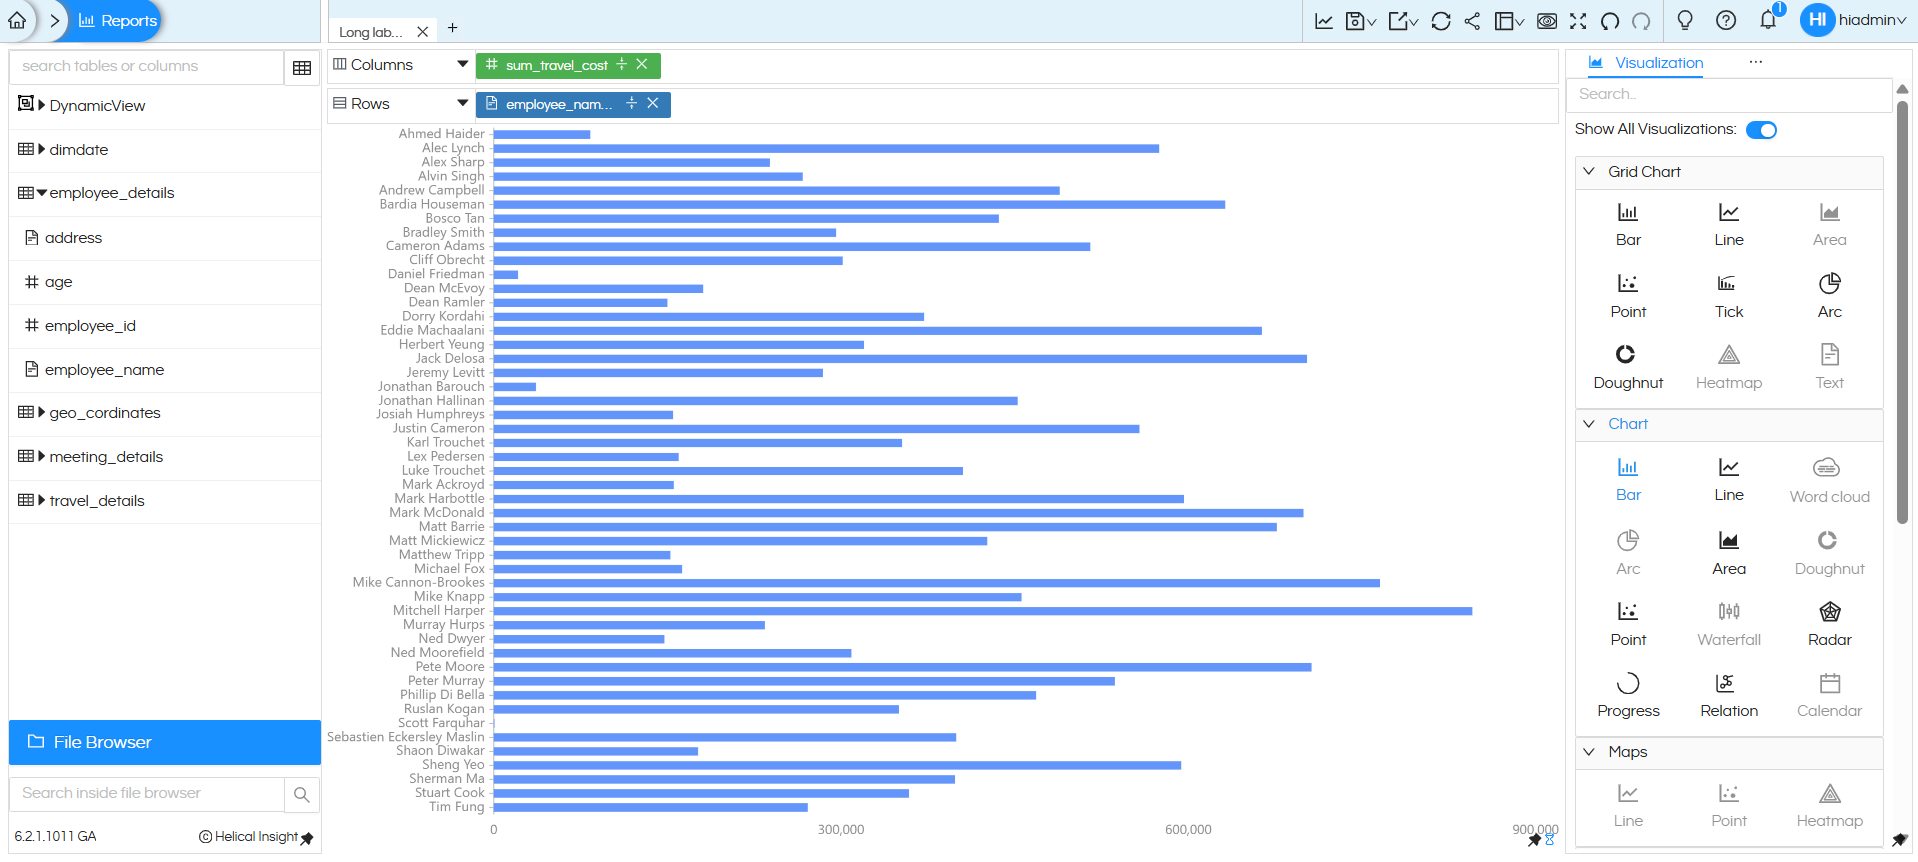
Step 1 — Build the Initial Horizontal Bar Chart

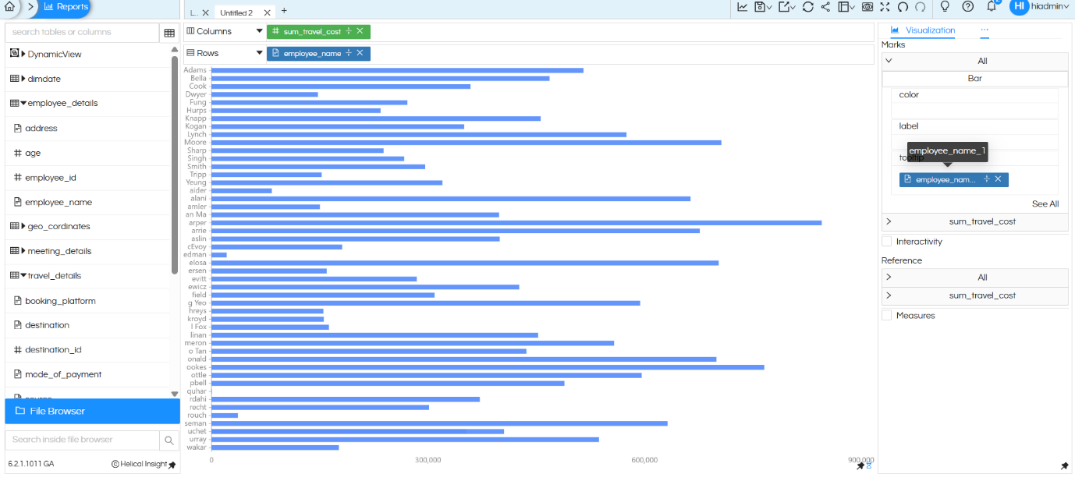
Create a horizontal bar chart using:

  • Columns: sum_travel_cost (measure)
  • Rows: employee_name (dimension)

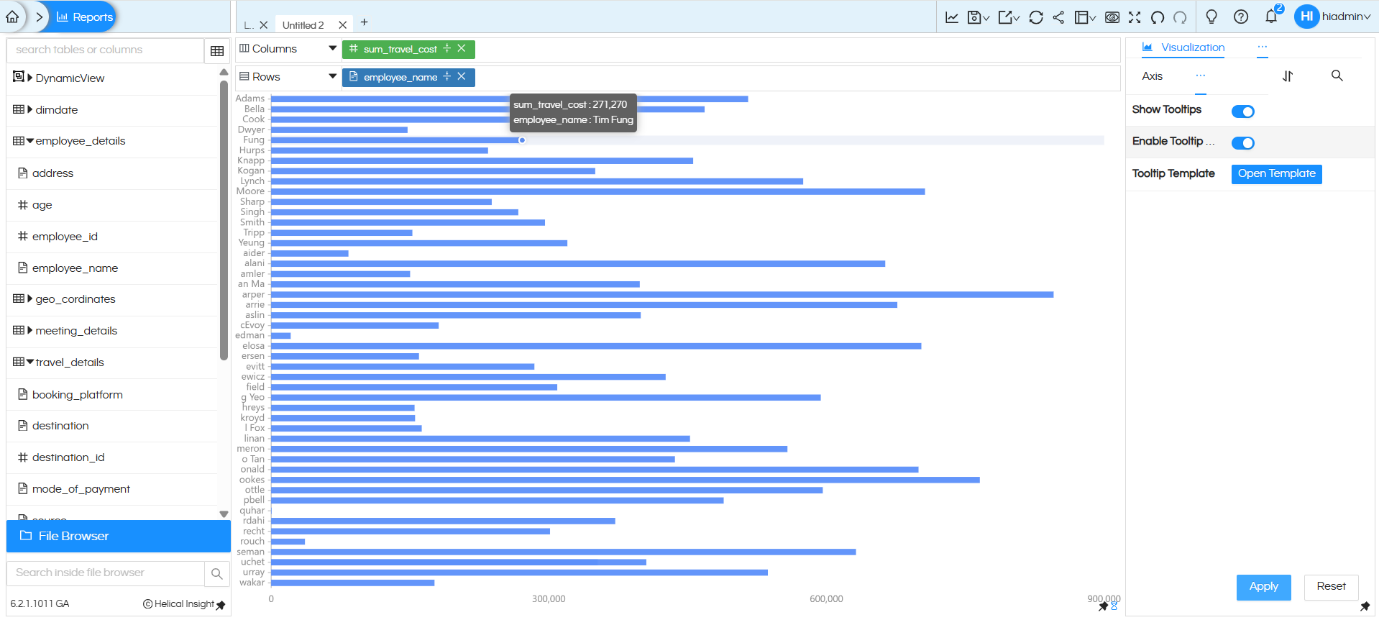
The chart will render, but the Y-axis employee name labels will appear truncated or overlapping because the full names are too long to fit.

Handling long text names in visualization

Step 2 — Apply the RIGHT DB Function to Truncate Labels

To shorten the Y-axis text, apply the RIGHT DB function to the employee_name field. This function extracts a specified number of characters from the right side of a string value.

What is the RIGHT DB Function?

The RIGHT function returns the rightmost N characters of a string. In this context, it is used to limit the number of characters displayed on the chart axis.

Syntax: RIGHT(field_name, number_of_characters)
Example: RIGHT(employee_name, 5) → returns the last 5 characters of the name

How to Apply It

  1. In the report builder, locate the employee_name field in the table panel on the left.
  2. Open the Functions panel and search for RIGHT.
  3. Enter the expression: RIGHT(employee_name, 5) and save.

Handling long text names in visualization

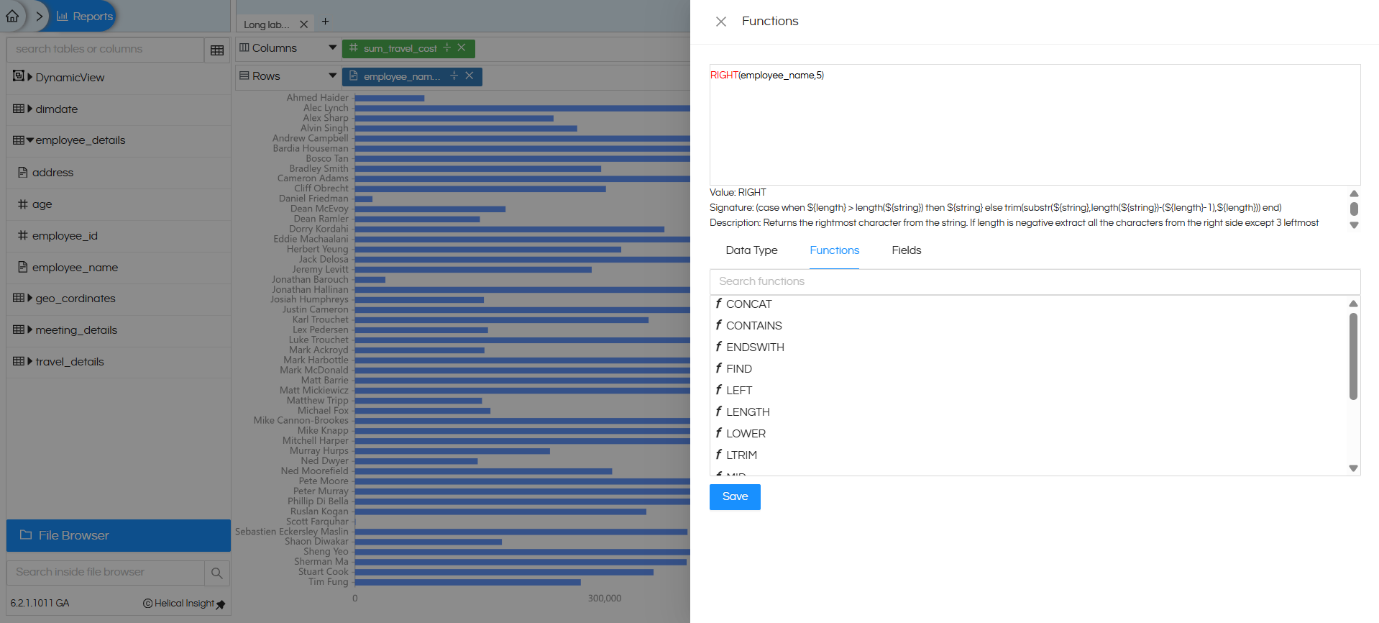
Result: The Y-axis now shows only the first 5 characters of each employee name, making the chart much more readable.

For more details on available DB functions, refer to: https://www.helicalinsight.com/database-functions/

In a similar way, there are other functions also which can be used depending on the db being used.

Aside, instead of using column and applying dbfunction on of it, you can also make use of custom column as well. https://www.helicalinsight.com/custom-column/

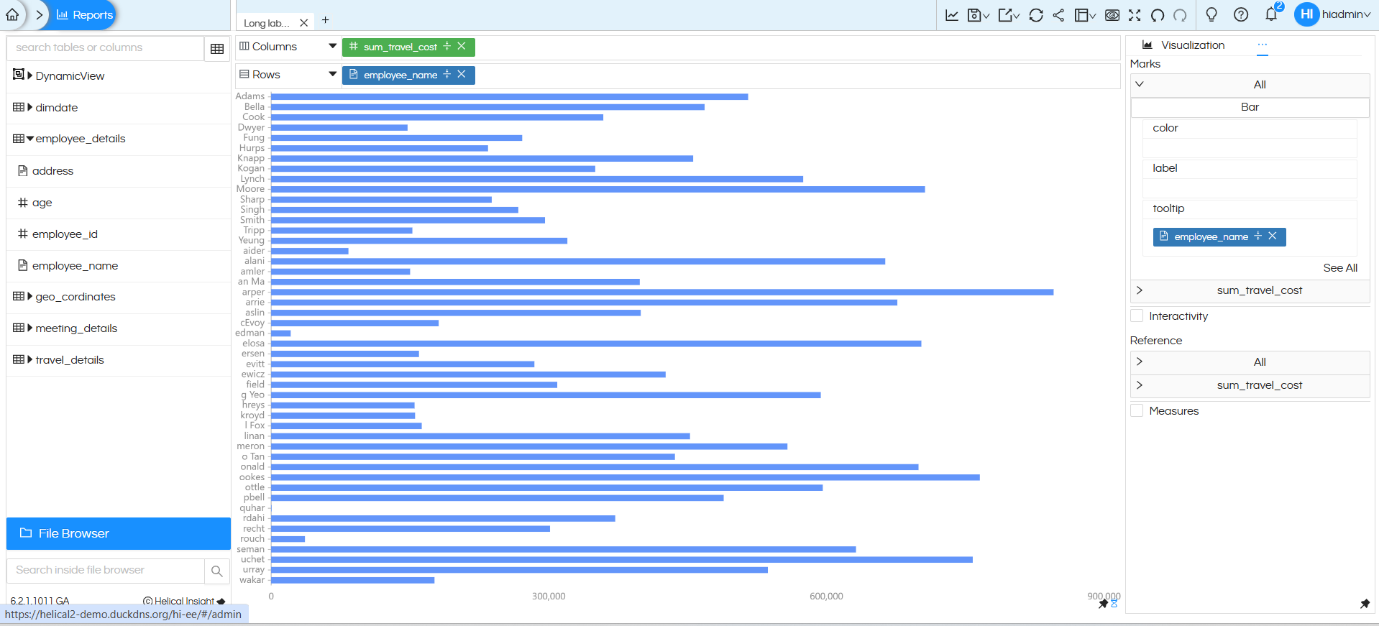
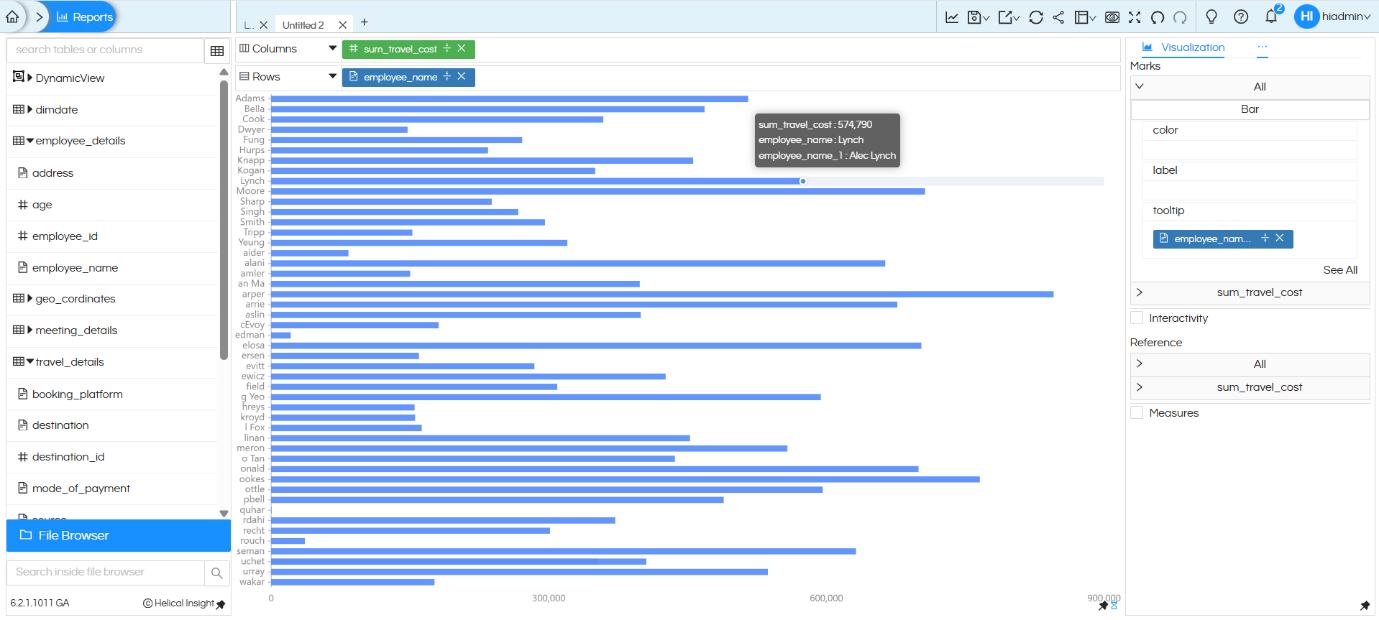
Step 3 — Add the Full Name Field to the Tooltip

While the truncated label solves the display problem, it creates another problem wherein the tooltip is also showing the truncated text. Ideally we would like to show full text on hover in tooltip.

Handling long text names in visualization

To achieve this, add the original employee_name field directly to the Tooltip section of Marks.

How to Add a Field to the Tooltip

  1. In the Marks panel, locate the drag-and-drop area for Tooltip.
  2. Drag the employee_name field from the left table panel (metadata) and drop it into the Tooltip section.
  3. This adds the full, untruncated name to the tooltip popup.

Handling long text names in visualization

Step 4 — Rename the Tooltip Field Label

Right now the same field name (employee_name )is present both at “Rows” and in “Tooltip” of Marks. Rename it at anyone of the place. In this below we are renaming it at the Tooltip level.

How to Rename

  1. In the Marks panel, double-click on the employee_name field text.
  2. An editable text box will appear. Type the desired display label (e.g., Employee Name) and press Enter.

Handling long text names in visualization

After renaming the field, when you hover over a chart bar, you may notice that the employee name appears twice in the tooltip:

  • Once from the Rows
  • Second time from the Tooltip

Handling long text names in visualization

Step 6 — Configure the Tooltip Template (Helical 6.2+)

Now in the tooltip we can see it 2 times, which is ideally not required. Hence we will cover how to handle that.

From Helical Insight version 6.2 onwards, a Tooltip Template editor is available. This allows you to fully control what appears in the tooltip — removing the duplicate entry and showing only the full name.

Opening the Tooltip Template

Hover on hamburger icon beside visualization, Go to Properties panel, hover on hamburger icon beside Axis, click on Tooltip.

Click the Open Template button to launch the Tooltip Template editor.

You will see the template currently showing both the truncated name (from RIGHT function) and the full name.

Handling long text names in visualization

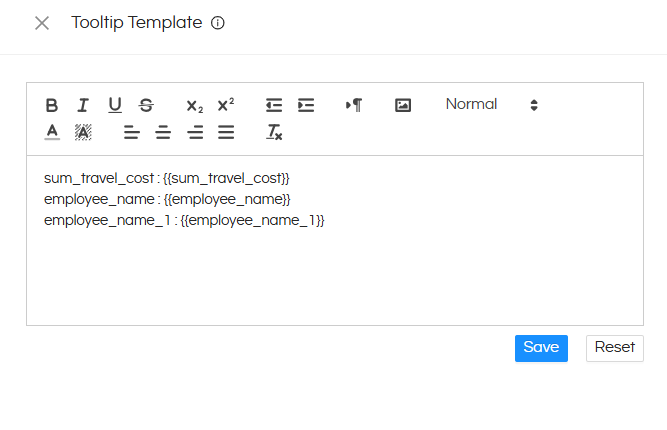
sum_travel_cost : {{sum_travel_cost}} — The Measure

employee_name : {{employee_name}} – From Rows (next step we remove this)

employee_name_1 : {{employee_name_1}}ToolTip (here we will change employee_name_1 heading to emplyee name)

The left side names can be anything (instead of sum_travel_cost you can keep Travel Cost)

Editing the Template

Remove the duplicate line for the truncated label (the Row function output) from the tooltip template, keeping only:

  • sum_travel_cost — the measure value
  • employee_name — the full employee name from Tooltip of Marks

Handling long text names in visualization

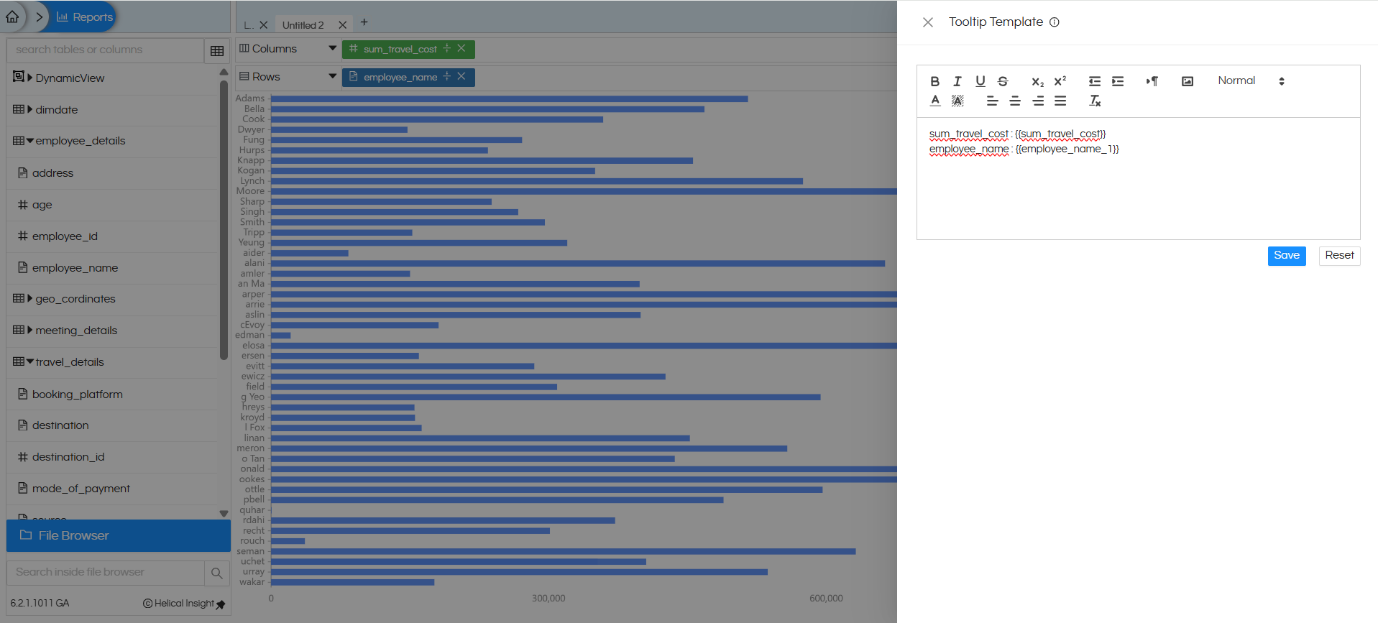
Click Save to apply the template.

For more about the Tooltip Template feature, refer to: https://www.helicalinsight.com/tooltip-property-with-configurable-fields/

Final Output

After completing all the steps, the chart now displays:

  • Shortened Y-axis labels — using the RIGHT DB in Rows function for clean, readable axis text
  • Full employee name in the tooltip — displayed cleanly on hover with no duplication, coming from Tooltip section of Marks.

Handling long text names in visualization

Reach out to us on support@helicalinsight.com in case of any more questions.

Leave a Reply

Helical Insight’s self-service capabilities is one to reckon with. It allows you to simply drag and drop columns, add filters, apply aggregate functions if required, and create reports and dashboards on the fly. For advanced users, the self-service component has ability to add javascript, HTML, HTML5, CSS, CSS3 and AJAX. These customizations allow you to create dynamic reports and dashboards. You can also add new charts inside the self-service component, add new kind of aggregate functions and customize it using our APIs.
Helical Insight, via simple browser based interface of Canned Reporting module, also allows to create pixel perfect printer friendly document kind of reports also like Invoice, P&L Statement, Balance sheet etc.
If you have a product, built on any platform like Dot Net or Java or PHP or Ruby, you can easily embed Helical Insight within it using iFrames or webservices, for quick value add through instant visualization of data.
Being a 100% browser-based BI tool, you can connect with your database and analyse across any location and device. There is no need to download or install heavy memory-consuming developer tools – All you need is a Browser application! We are battle-tested on most of the commonly used browsers.
We have organization level security where the Superadmin can create, delete and modify roles. Dashboards and reports can be added to that organization. This ensures multitenancy.
A first-of-its-kind Open-Source BI framework, Helical Insight is completely API-driven. This allows you to add functionalities, including but not limited to adding a new exporting type, new datasource type, core functionality expansion, new charting in adhoc etc., at any place whenever you wish, using your own in-house developers.
It handles huge volumes of data effectively. Caching, Pagination, Load-Balancing and In-Memory not only provides you with amazing experience, but also and does not burden the database server more than required. Further effective use of computing power gives best performance and complex calculations even on the big data even with smaller machines for your personal use. Filtering, Sorting, Cube Analysis, Inter Panel Communication on the dashboards all at lightning speed. Thereby, making best open-source Business Intelligence solution in the market.
With advance NLP algorithm, business users simply ask questions like, “show me sales of last quarter”, “average monthly sales of my products”. Let the application give the power to users without knowledge of query language or underlying data architecture
Our application is compatible with almost all databases, be it RDBMS, or columnar database, or even flat files like spreadsheets or csv files. You can even connect to your own custom database via JDBC connection. Further, our database connection can be switched dynamically based on logged in users or its organization or other parameters. So, all your clients can use the same reports and dashboards without worrying about any data security breech.
Our application can be installed on an in-house server where you have full control of your data and its security. Or on cloud where it is accessible to larger audience without overheads and maintenance of the servers. One solution that works for all.
Different companies have different business processes that the existing BI tools do not encompass. Helical Insight permits you to design your own workflows and specify what functional module of BI gets triggered