In this blog we will see how to create a canned report with a date picker as input parameter. We will give an end user an option to select the date, and all the data greater than that specific date will be available in the report.

STEP 1: Create a connection

To know more about the types of datasource connections that can be established, refer to the blog.

STEP 2: Write a query without using parameter/where clause

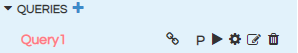
  1. After providing the connection details in the previous step, click on + button next to Queries.
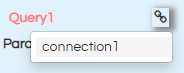
  2. Select the connection to be used for the query.
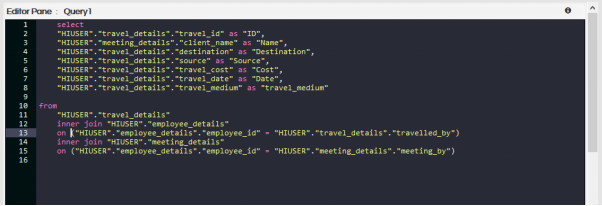
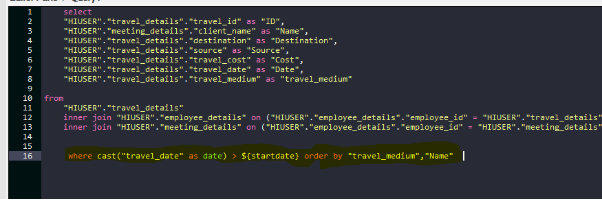
  3. Click on Configuration icon and write the query without where clause or any input parameters in the editor pane.
  4. Save the query by clicking on Apply or using keyboard shortcut Ctrl+S.
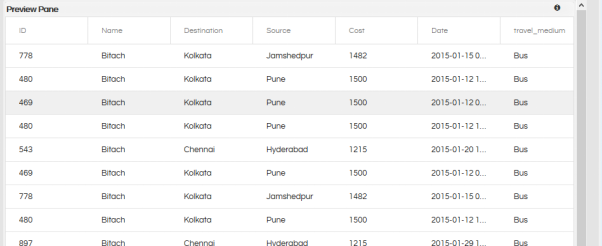
  5. Click on Run to execute the query. This will return the top 10 rows of the result set.

STEP 3: Add an input parameter

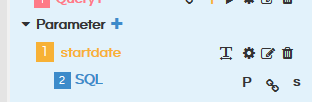
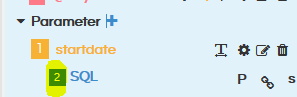
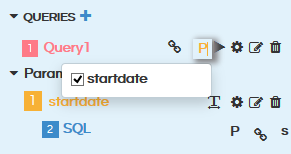
  1. Click on + icon next to parameter. You can add as many parameters as required. In this case we will add one input parameter i.e. startdate
  2. Select the type of input parameter. For dates the type of input parameter is “String”
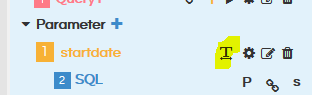
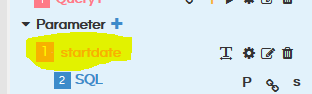
  3. Edit the name of the parameter by clicking on the pencil icon. As you can see we have given the parameter name as startdate. By default when you add the input parameters its name is created as parameter1 parameter 2 so on and so forth. It’s always advisable to rename them for easier understanding and usage.

STEP 4: Edit the Configuration of the input parameter

  1. Select the connection for the query of the input parameter.
  2. In cases of date picker / date range picker there is no need of writing SQL.
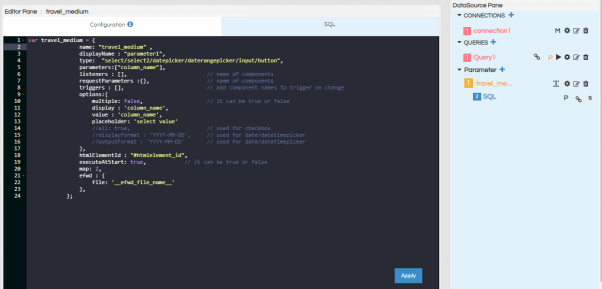
  3. Go to configuration section and give the configuration that you desire. Please note that the variable name, name specified within the configuration and the name of the parameter should match exactly as shown in the below image. All the three highlighted portions should have the exactly the same name
  4. The following options are available in the configuration –

    • Name: Give the name of the parameter in double quotes in this section. As mentioned earlier the name should be same as the parameter name
    • displayName : While a person is viewing the report the name which is given here will display at the top of that input parameter box.
    • type: Type of input parameter. We will use datepicker
    • parameters: Put the inputparameternames wherein the the values selected on the frontend will get passed to the parameters. We are putting startdate here.
    • listeners : This is an optional section and to be used while using cascading input parameters. Name the columns that this parameter should listen to.
    • requestParameters : name of components acting as input.
    • triggers : add component names to trigger on change
    • multiple: whether the parameter is multi-select or not. Default is false (single select). When multiselect is to be used this has to be made true. In case of datepicker or date range picker this has to be false
    • display : value to be displayed. Give name of the column whose values are to be displayed
    • value: column name whose value should be returned
    • all: true – this is used only for checkbox
    • displayFormat : Put the format which we would like to use to show on frontend. Like in this case we will put YYYY-MM-DD
    • outputFormat : Put the format which we would like to use which should get passed to the SQLQuery. Like in this case we will put YYYY-MM-DD
    • executeAtStart: whether the parameter values are to be populated during report load
    • map: this is the number of the SQL that is to be used for the filter. Ensure that this value is correct.

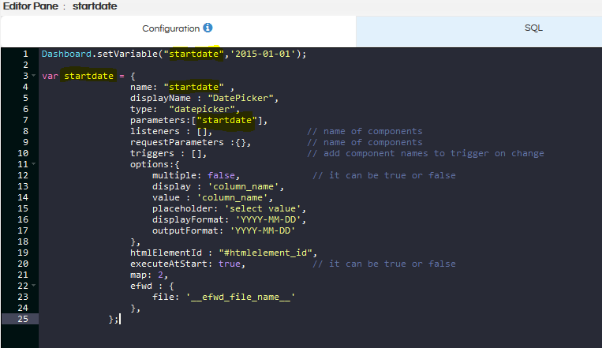
  5. Set the default values for the parameter using the following syntax. This has to be put on the “Configuration” screen. This is the default values which the input parameter will have when the report opens.
Dashboard.setVariable('parameter_name ', 'default_value ');

For multiselect parameters, use array to define the default value.

Dashboard.setVariable('parameter_name ',[ 'default_value ']);

Below are the configuration screens for reference for startdate.

STEP 5: Add listener of parameter to query section

Now we have to specify that this report should listen to that specific input parameter. Click on P icon. You will see the added parameter list. Select the parameter(s) that you want to use in the query

STEP 6: Add where clause to the query

Now in the actual SQLQuery for the report we will add parameter so that it can listen and whatever is the value users selects it gets passed to that specific placeholder.

Add where clause in the query section using the selected parameters. For using the values returned by the parameter, use the parameter name with $ sign and within {}. Syntax – ${parameter_name}.

Save the query and execute to get the resultset.

STEP 7: Go to the Canvas to Use Parameters on the report

After making all the changes in the datasources page, go to canned report canvas.

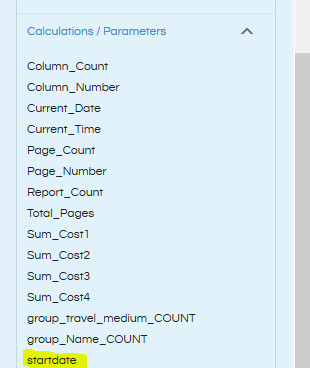
  1. In the Datasources pane under Calculations/Parameters, you will see that the parameter has been added. This parameter can now be used in the report, if required by simply dragging it like any other variable.
  2. Go to Preview Parameters section in the property pane

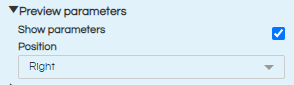
By default, “Show Parameters” will be checked. If you do not want to show the parameters to end user, you can deselect this.

“Position” section defines where the parameter section should be visible with respect to the report when the report is mainly being used in read mode by end users. There are 4 options: right, top, left and bottom.

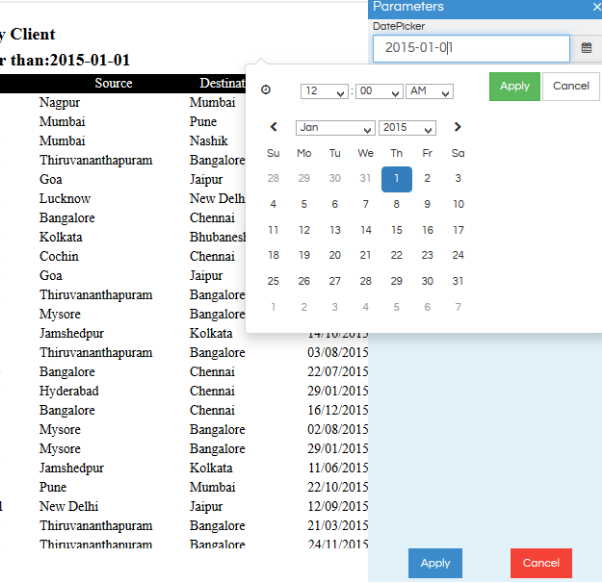
STEP 8: Preview the report

Click on Preview icon to preview the report. Click on the hamburger icon, you can see the parameter in the position that you have mentioned.

STEP 9: After the report is satisfactory, save the report in desired location.

Learn More about Different Input Parameter Usages

For further assistance, kindly contact us on support@helicalinsight.com or post your queries at Helical Forum

Helical Insight’s self-service capabilities is one to reckon with. It allows you to simply drag and drop columns, add filters, apply aggregate functions if required, and create reports and dashboards on the fly. For advanced users, the self-service component has ability to add javascript, HTML, HTML5, CSS, CSS3 and AJAX. These customizations allow you to create dynamic reports and dashboards. You can also add new charts inside the self-service component, add new kind of aggregate functions and customize it using our APIs.
Helical Insight, via simple browser based interface of Canned Reporting module, also allows to create pixel perfect printer friendly document kind of reports also like Invoice, P&L Statement, Balance sheet etc.
If you have a product, built on any platform like Dot Net or Java or PHP or Ruby, you can easily embed Helical Insight within it using iFrames or webservices, for quick value add through instant visualization of data.
Being a 100% browser-based BI tool, you can connect with your database and analyse across any location and device. There is no need to download or install heavy memory-consuming developer tools – All you need is a Browser application! We are battle-tested on most of the commonly used browsers.
We have organization level security where the Superadmin can create, delete and modify roles. Dashboards and reports can be added to that organization. This ensures multitenancy.
A first-of-its-kind Open-Source BI framework, Helical Insight is completely API-driven. This allows you to add functionalities, including but not limited to adding a new exporting type, new datasource type, core functionality expansion, new charting in adhoc etc., at any place whenever you wish, using your own in-house developers.
It handles huge volumes of data effectively. Caching, Pagination, Load-Balancing and In-Memory not only provides you with amazing experience, but also and does not burden the database server more than required. Further effective use of computing power gives best performance and complex calculations even on the big data even with smaller machines for your personal use. Filtering, Sorting, Cube Analysis, Inter Panel Communication on the dashboards all at lightning speed. Thereby, making best open-source Business Intelligence solution in the market.
With advance NLP algorithm, business users simply ask questions like, “show me sales of last quarter”, “average monthly sales of my products”. Let the application give the power to users without knowledge of query language or underlying data architecture
Our application is compatible with almost all databases, be it RDBMS, or columnar database, or even flat files like spreadsheets or csv files. You can even connect to your own custom database via JDBC connection. Further, our database connection can be switched dynamically based on logged in users or its organization or other parameters. So, all your clients can use the same reports and dashboards without worrying about any data security breech.
Our application can be installed on an in-house server where you have full control of your data and its security. Or on cloud where it is accessible to larger audience without overheads and maintenance of the servers. One solution that works for all.
Different companies have different business processes that the existing BI tools do not encompass. Helical Insight permits you to design your own workflows and specify what functional module of BI gets triggered