Helical Canned Reports is a new module that has been introduced in Helical Insight 4.0. This module enables the users to create canned reports or pixel perfect pre-formatted reports. These reports are scalable, pixel-perfect, multi page reports which are also printer friendly. Canned reporting module can be used to create reports like invoices, balance sheets, purchase orders, performance reports, survey forms etc. If your reporting requirement also has mainly a simple table but with many pages, Canned Reporting module is much more suited as compared to Adhoc Report.
In this module we would be just giving a preview. Users are requested to go through the detailed blogs to learn about the usage of the functionalities properly.
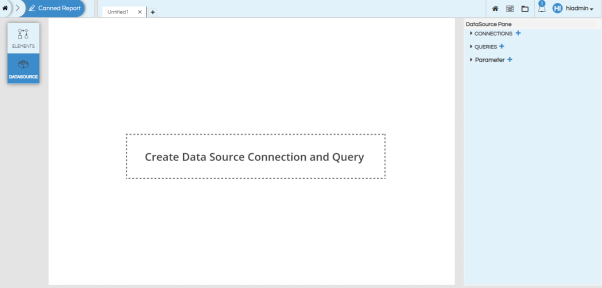
To open this module, click on Canned Report button. The following page will appear:
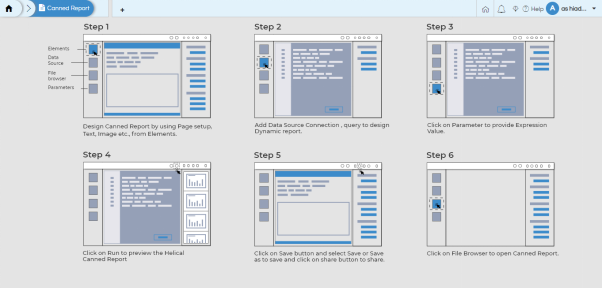
In order to start making a new report, click on “+” button. Only a maximum of 4 tabs can be opened in the canned reports module at a time; either in create or in edit mode
Once we click on “+” at the top we can see the below kind of functions starts appearing

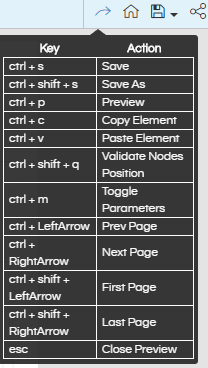
- Shortcut: By hovering on this button, you can see all the keyboard shortcuts available
- Home: Going to the home page of Canned Reporting module
- Save / Save As: Useful for saving the report. When clicked File Browser will appear, a user can create new folder / select a folder and then save it there. Save As can be used for making a copy.
- Share: To share the report with other users/roles/organisations
- Preview: You can preview the report while you are creating the report. As you are making the report it is always advisable to keep on previewing the report and see how it is appearing
- Toggle Panes: By clicking on it various panes like Property Pane, Symbol Pane and Tabs Pane can be hidden / viewed on the browser.
- Notifications (Bell Icon): Notifications can be seen here
- Lastly we have logout button
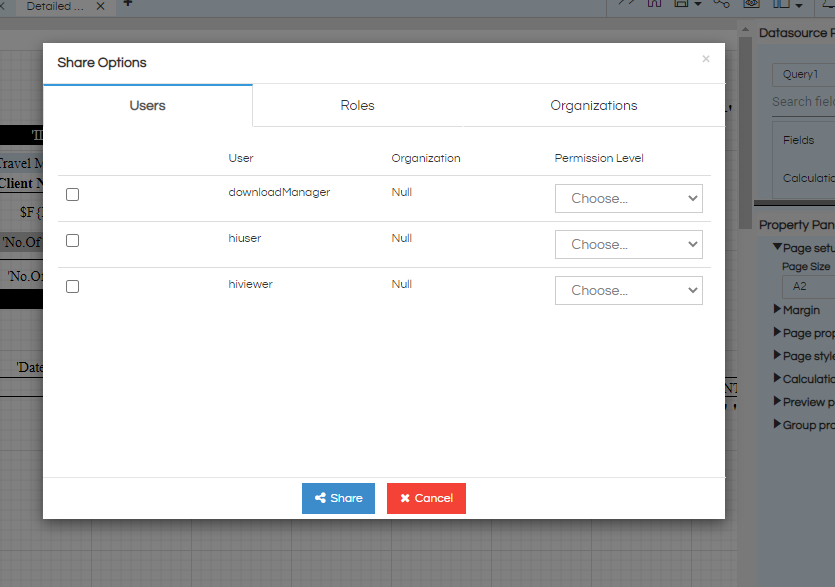
Know more about sharing here Sharing Reports
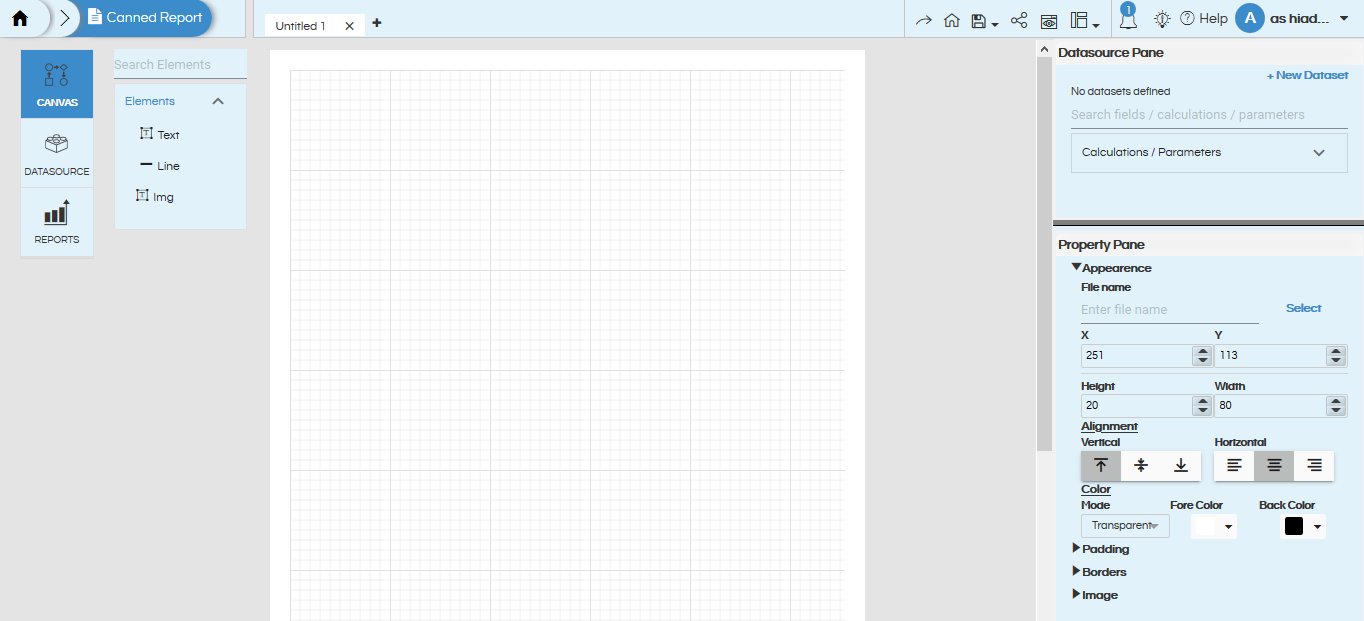
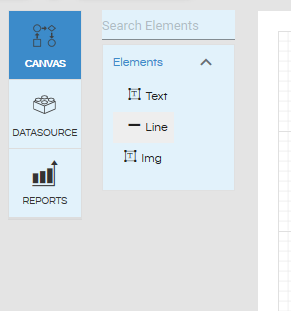
On the extreme left, you can see Canvas, DataSource & Reports buttons. You can use these buttons to navigate between Canvas, Datasource page and the File Browser.
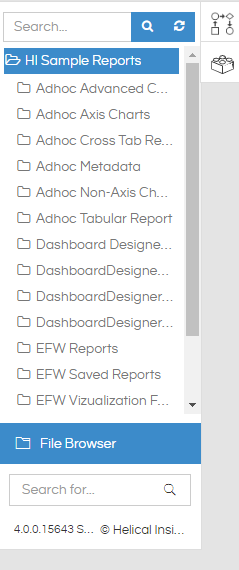
REPORTS BUTTON:
When you click on the reports button, it opens up the file browser. You can navigate to the report you want to edit from this section. It has a search section as well to search the report by name. In order to open a report which is already created you can double click on the report and it will open(drag drop operation on the report name will not work, double click report nameto open it in edit mode). You can return to canvas or datasources page by clicking on the respective button which appears on the top right corner of the report browser.
DATASOURCES PAGE
In order to start creating a report, first you need to create a datasource connection and query. Please go through the blog DataSource Overview to read more about the various kind of connections in datasources (managed, global, groovy etc), input parameters type and configuration etc.
When you click on datasource or New Connection on the datasource pane, then the datasource page opens. On the right hand side, there is a datasource pane. This pane has 3 sections:
- Connections : This is the section where you can add connections and configure them. Read the datasources blog to learn more. Multiple connections can be made.
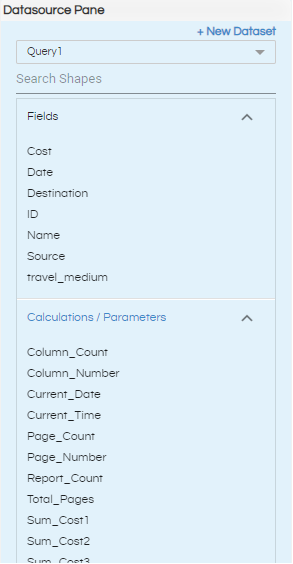
- Queries: This is the section where you can add multiple different queries, point it to the datasource created above. The dataset of the query can be previewed.
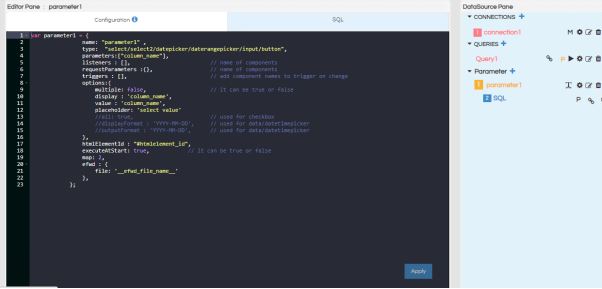
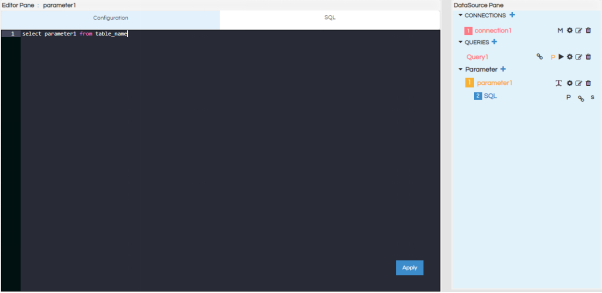
- Parameter: If you need input parameters, then you need to add them in this section. Learn more here.
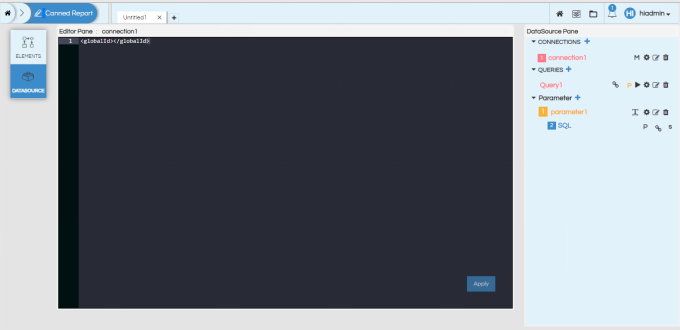
Queries:
CANVAS
Once you have created the query and required input parameters (filters), you can create the report by going to the elements page. Click on Canvas button. On the elements page, you can see text and line components on the left section. You can drag these components and place them onto the canvas in the middle section. Go through the below mentioned blogs to learn more about the usage of Text Component, Line Component and Image Component.
On the right hand side, we have the datasource panel and property panel.
The datasources pane will show a list of various SQLQueries written and selecting any of the query will show the fields output of that specific query. Also, there are calculated fields and input parameters that will appear in this section. We can drag any field or input parameter that we want to use onto the canvas and place them the way we want and make use of them.
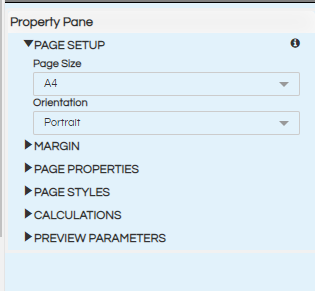
The property pane is used to set the properties of the report or individual components. These properties options which appear are dependent on the kind of component that you have selected and accordingly those properties options will appear. On the below image the properties options which are appearing are related to the “Report” like the report page setup, margins, borders, define styles for components, calculations for fields and alignment of various components in this area.
In the below mentioned blogs we have covered in details the properties options avalaible for different components
- Page Properties
- Text Component properties
- Line Component properties
- Image Component properties
- SQLQuery field’s properties(Properties option same as text component)
- Quick Calculation fields properties
- Calculation fields properties
- Usage of Field Calculation
Repeat By Usage
When creating reports in certain cases we might need to have text or content which is present once at the starting of every report (like a report header), or once towards the ending of the report (like a report summary), or once per every page at the top or bottom (like page header or page footer) or showing the entire data by executing the SQLQuery. When a component is selected and then we right click we get “Repeat By” option which allows us to implement such things like report header, report summary, page header, page footer, actual data.Learn how to use “Repeat By” functionality in detail.
Group By Usage
In certain cases when we create a report it might also require subgroup wise total or count. For example we are creating a Product Wise Geography wise Sales, in the created report we might also want to show what is the subtotal for each and every geography as well. In those kind of cases the concept of “Group By” can be used. Learn Concept and usage of Grouping
Quick functions usage:
While creating reports we might need to show the total page number, current page number, running count, current date, current time etc. There are a lot of quick calculations and functions which are present which allows us to show this. Usage of quick functions
Now there can also be certain cases wherein the prebuilt calculations are not sufficient and you want to create some custom calculation. In those cases custom calculation option can be used.
Custom Calculations
Custom calculations options allows you to create your own custom calculation by using fields and defining custom formulaes. Go through this blog to learn how to create your own custom calculation and use it
Field Calculations on Right Click
There are various calculations that are available on right click on any field. Refer to our detailed blog to understand the usage of calculations on right click
Alignment Options
By selecting a component we can specify its position and size. There are alignment options which are present in the properties with a more granular pixel perfect control (like its X position Y position Height and Width in terms of pixels). Aside when you have selected a specific component there are some quick alignment options which like fit to width, stick to top etc. Learn more here about those quick alignment options. There are a lot of other right click operations which can be learned by this blog
Usage of input parameter
If you would like to display the value of input parameter which has been selected that is also possible. You can simply (need to try out this first). The reports which are created using canned reports supports various kind of exporting options. The exporting options of canned reports module includes options like HTML, CSV, XML, XLSX, PDF, RTF, DOCX, ODT, ODS, PPTX, TXT, XLS, PNG, JPEG and JPG. The canned report can be opened from the file browser in a new tab.
The reports created with canned reports also have many more email scheduling options. When you are on the interface of email scheduling it gives certain more kind of email scheduling options which includes HTML, CSV, XML, XLSX, PDF, RTF, DOCX, ODT, ODS, PPTX, TXT, XLS, PNG, JPEG and JPG
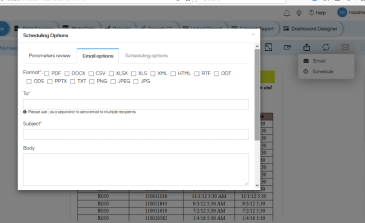
The method of email scheduling the canned reports are similar to other. You can go through the blog to learn more Email Scheduling Reports and Dashboards
For further assistance, kindly contact us on support@helicalinsight.com or post your queries at Helical Forum
