In this article you will learn about how to add a VF file in Helical Insight. The Adhoc feature in Helical Insight has a number of predefined charts. Now, to use a new chart type which is not available in the Adhoc chart list then VF comes into picture. Also, for many business requirement a new chart or other mean of representation might be required like funnel / radar /information card /traffic light, etc. In such cases VF feature can be used. To implement VF, a VF file is created which includes script and can be used directly to create the desired visualization.

Where to add a VF

VF file can be created using any editor, and then needs to be saved with .efwvf extension. Save this file in the desired folder on the server

How to invoke a VF

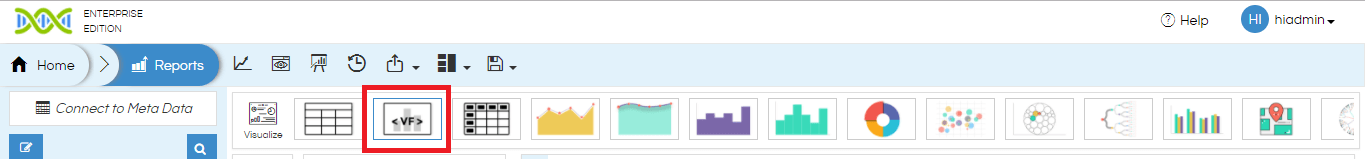
In Adhoc, click on the VF button to Browse to the desired .efwvf file from the Filebrowser. Generate the report.

VF2

VF File Content and Creation

VF stands for Visualization Framework. It should contain Charts tag, Chart tag, prop tag, name tag, type tag, DataSource tag and script tag.

<Charts>
    <Chart id ="1">
        <prop>
            <name></name>
            <type>Custom</type>
            <DataSource></DataSource>
            <script>
                <![CDATA[]]>
            </script>
        </prop>
    </Chart>
</Charts>

  • <Chart> : This tag will provide chart id, which should be unique number. This chart id is used to bind the chart being created to the display page.
  • <name> : This tag will hold the title of the VF.
  • <type> : This tag will set the type of chart, By default it should be set to Custom.
  • <DataSource> : This tag will provide DataSource id, which can be repetitive. In VF we usually do not provide any DataSource id, since the data is being provided directly by the adhoc body.
  • <script> : This tag contains CDATA tag, inside which JavaScript code should be written in order to create chart.

For Example

In this example we will be discussing about how to create and use a new VF Chart which is “Adhoc VF Treemap Chart”

Step 1: Create a .efwvf file and save it in a desired location on server. Below code contains the details of .efwvf file for Adhoc VF Treemap Chart.

<Charts>
	<Chart id ="1">
		<prop>
				<name>Treemap</name>
				<type>Custom</type>
				<DataSource></DataSource>
				<script>
					<![CDATA[
var data = [{
 "name": "flare",
 "children": [
  {
   "name": "Treemap",
   "children": [
    {
     "name": "Events",
     "children": [
      {"name": "Food & Drink", "size": 278},
      {"name": "Music", "size": 189},
      {"name": "Fun", "size": 269},
	  {"name": "Festival", "size": 142},
     ]
    },
    {
     "name": "Plays",
     "children": [
      {"name": "Comedy", "size": 182},
      {"name": "Drama", "size": 166},
      {"name": "Adaptation", "size": 153},
     ]
    },
	{
     "name": "Movie",
     "children": [
     {"name": "Action", "size": 136},
      {"name": "Thriller", "size": 152},
      {"name": "Comedy", "size": 86},
	  {"name": "Horror", "size": 42},
      {"name": "Drama", "size": 86},
	  {"name": "Romantic", "size": 81},
     ]
    }
   ]
  }
 ]
}];

var margin = {top: 0, right: 0, bottom: 5, left: 0};
var width=300,height=220;

//var color = d3.scale.category20b(); 
var color = d3.scale.ordinal()
			.domain(d3.range(7))
			.range([ '#1775BC', '#479BDA', '#8CC1E8']);

var treemap = d3.layout.treemap()
    .size([width, height])
    .sticky(true)
    .value(function(d) { return d.size; });

var div = d3.select("#chart_1").append("div")
    .style("position", "relative")
    .style("width", (width + margin.left + margin.right) + "px")
    .style("height", (height + margin.top + margin.bottom) + "px")
    .style("left", margin.left + "px")
    .style("top", margin.top + "px");
	
var mousemove = function(d) {
  var xPosition = d3.event.pageX - 150;
  var yPosition = d3.event.pageY - 30;
  d3.select("#tooltip")
    .style("left", xPosition + "px")
    .style("top", yPosition + "px");
  d3.select("#tooltip #heading")
    .text(d.name + " - " + d.parent.name);
  d3.select("#tooltip #size")
    .text(d.size);
  d3.select("#tooltip").classed("hidden", false);
};

var mouseout = function() {
  d3.select("#tooltip").classed("hidden", true);
};
/*
var svg = d3.select("#chart_1").append("svg")
	.attr("width", width + margin.left + margin.right)
    .attr("height", height + margin.top + margin.bottom)
	//.attr("viewBox","0 0 960 500")
    .append("g")
    .attr("transform", "translate(" + margin.left + "," + margin.top + ")");
*/
//d3.json(data, function(error, root) {

	var root = data[0];  
    var node = div.datum(root).selectAll(".node")
      .data(treemap.nodes)
      .enter().append("div")
      .attr("class", "node")
      .call(position)
      .style("background", function(d) {return d.children ? color(d.name) : null; })
	  .on("mousemove", mousemove)
      .on("mouseout", mouseout)
      .text(function(d) { return d.children ? null : d.name; });

  d3.selectAll("input").on("change", function change() {
    var value = this.value === "count"
        ? function() { return 1; }
        : function(d) { return d.size; };

    node
        .data(treemap.value(value).nodes)
        .transition()
        .duration(1500)
        .call(position);
  });

function position() {
  this.style("left", function(d) { return d.x + "px"; })
      .style("top", function(d) { return d.y + "px"; })
      .style("width", function(d) { return Math.max(0, d.dx - 1) + "px"; })
      .style("height", function(d) { return Math.max(0, d.dy - 1) + "px"; });
}
			
                ]]>
            </script>    
        </prop>
    </Chart>	
</Charts>

Step 2: Now, to use a VF Treemap Chart open an .efwvf file from file browser.

efwvf

Step 3: Generated Report view using VF

efwvf1

Use of VF in Helical Insight not only fulfills your visualization requirement but also allows you to customize the VF before integration based on the requirement.

For more info,
contact us at demo@helicalinsight.com

Leave a Reply

Your email address will not be published. Required fields are marked *

Helical Insight’s self-service capabilities is one to reckon with. It allows you to simply drag and drop columns, add filters, apply aggregate functions if required, and create reports and dashboards on the fly. For advanced users, the self-service component has ability to add javascript, HTML, HTML5, CSS, CSS3 and AJAX. These customizations allow you to create dynamic reports and dashboards. You can also add new charts inside the self-service component, add new kind of aggregate functions and customize it using our APIs.
Helical Insight, via simple browser based interface of Canned Reporting module, also allows to create pixel perfect printer friendly document kind of reports also like Invoice, P&L Statement, Balance sheet etc.
If you have a product, built on any platform like Dot Net or Java or PHP or Ruby, you can easily embed Helical Insight within it using iFrames or webservices, for quick value add through instant visualization of data.
Being a 100% browser-based BI tool, you can connect with your database and analyse across any location and device. There is no need to download or install heavy memory-consuming developer tools – All you need is a Browser application! We are battle-tested on most of the commonly used browsers.
We have organization level security where the Superadmin can create, delete and modify roles. Dashboards and reports can be added to that organization. This ensures multitenancy.
A first-of-its-kind Open-Source BI framework, Helical Insight is completely API-driven. This allows you to add functionalities, including but not limited to adding a new exporting type, new datasource type, core functionality expansion, new charting in adhoc etc., at any place whenever you wish, using your own in-house developers.
It handles huge volumes of data effectively. Caching, Pagination, Load-Balancing and In-Memory not only provides you with amazing experience, but also and does not burden the database server more than required. Further effective use of computing power gives best performance and complex calculations even on the big data even with smaller machines for your personal use. Filtering, Sorting, Cube Analysis, Inter Panel Communication on the dashboards all at lightning speed. Thereby, making best open-source Business Intelligence solution in the market.
With advance NLP algorithm, business users simply ask questions like, “show me sales of last quarter”, “average monthly sales of my products”. Let the application give the power to users without knowledge of query language or underlying data architecture
Our application is compatible with almost all databases, be it RDBMS, or columnar database, or even flat files like spreadsheets or csv files. You can even connect to your own custom database via JDBC connection. Further, our database connection can be switched dynamically based on logged in users or its organization or other parameters. So, all your clients can use the same reports and dashboards without worrying about any data security breech.
Our application can be installed on an in-house server where you have full control of your data and its security. Or on cloud where it is accessible to larger audience without overheads and maintenance of the servers. One solution that works for all.
Different companies have different business processes that the existing BI tools do not encompass. Helical Insight permits you to design your own workflows and specify what functional module of BI gets triggered