Earlier we have added an input control or filter to the report created using Helical Insight CE.
In this article we will be changing the type of input control. There could be various kind of input controls like single select, multiple select, searchable single select, searchable multiple select, date picker, date range etc.
See the table below for information on input boxes:-
| Input Controls | Description |
|---|---|
| Select | Select without search |
| Select2 | Select with search |
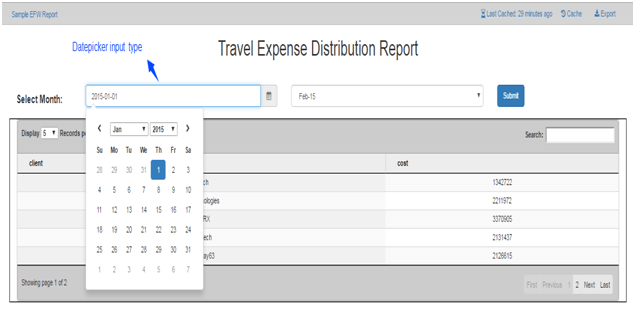
| Datepicker | To pick a date |
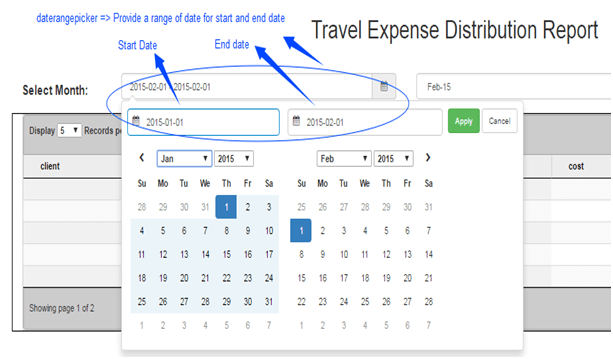
| Date rangepicker | Pick a range of date |
We will be making changes in ‘Template.Html’ file inside the ‘Template Folder’.
Following steps are to be followed in the ‘Template.html’ file to change the input control from SELECT to SELECT2 :-
- Open
Template.htmlfile. - Inside
script, find where the start_date select box is defined. - Change the type from select to select2.
- Save the file and run the report from the application.
Following the above steps , here is the code snippet given below:-
<script>
    var start_date = {
        name: "start_date",
        type:  "select2", // Give the type ‘select2’ .
		parameters :["s_date"],
		options:{
		multiple:false, //Single or multiple select
		value : 'value',
		display : 'display'
		},
		htmlElementId : "#startDate",
		executeAtStart: true,
		map:2
		};
		</script>
See the image below , obtained after running the report with SELECT2 input box.
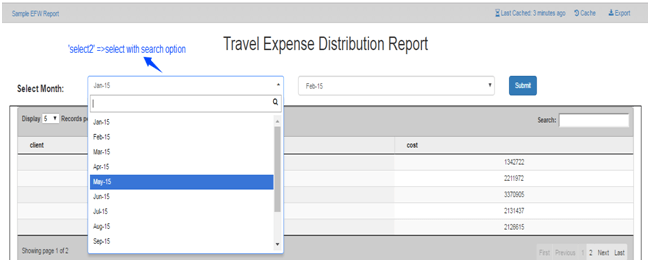
Note:-The above created SELECT and SELECT2 input box are single select .To make it multiple select, we need to edit the above code snippet used to create the input box (here start_date) by giving multiple ‘True’
In the same manner, we can change the input type to a number of other readily available options. For example:
- Datepicker
- Daterangepicker
Now, We will see an example of creating datepicker input box.
As explained earlier, change the input type from SELECT to ‘datepicker’
See below for the edited code snippet where we have just changed the type to ‘datepicker’.
var start_date = {
    name: "start_date",
    type:  "datepicker",
	parameters :["s_date"],
	options:{
        multiple:false,
        value : 'value',
        display : 'display'
    },
    htmlElementId : "#startDate",
    executeAtStart: true,
	map:2
};
Save the file and run the report to see the datepicker input box.(see image below).
You can also change the display format of the date in datepicker input box. Add displayFormat key in the options where the input box is defined in the Template.html file.
Inside displayformat key, you can define the format in which you wish to see the date.
For example:- displayFormat: ‘DD-MM-YYYY’
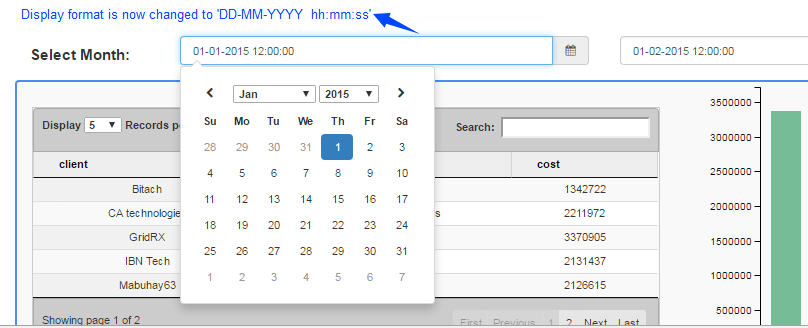
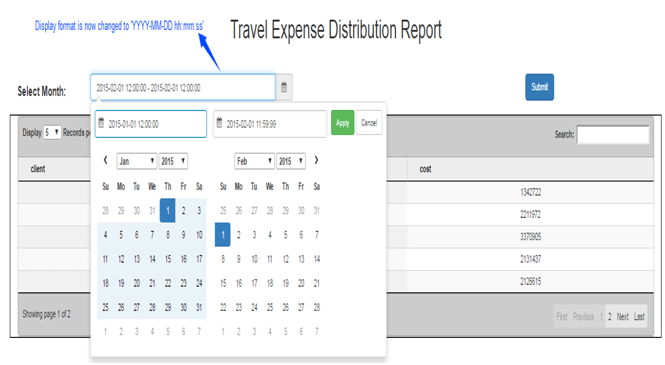
Now we will change the display format to DD-MM-YYYY hh:mm:SS.
See the following code snippet where we have defined the display format.
<script>
    var start_date = {
    name: "start_date",
    type:  "datepicker",
	parameters :["s_date"],
	options:{
		displayFormat: 'DD-MM-YYYY hh:mm:SS',
		 multiple:false,
        value : 'value',
        display : 'display'
    },
    htmlElementId : "#startDate",
    executeAtStart: true,
	map:2
};
 </script>
See the below image for the display format in datepicker .
You can also change the output format in the same manner as display format by using the key outputFormat. Output Format is the format in which the value will be assigned to the dashboard variable from where it will then be passed to the parameters in datasource.efwd file.
For example see the below code snippet.
var start_date = {
    name: "start_date",
    type:  "datepicker",
	parameters :["s_date", "e_date"],
	options:{
	outputFormat: 'YYYY-MM-DD hh:mm:SS',
	displayFormat: 'YYYY-MM-DD hh:mm:SS',
        multiple:false,
        value : 'value',
        display : 'display',
    },
    htmlElementId : "#startDate",
    executeAtStart: true,
	map:2
};
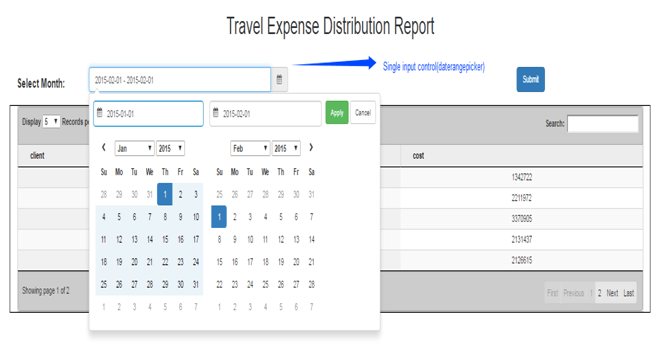
Now we will change input box type to daterangepicker where we will be able to select a range of date from start to end in the same manner as we have done for datepicker above.
- By choosing daterangepicker input box we need not use two separate input boxes for setting start_date and end_date.
- With the help of Date range picker, we can set both start date and end date.
- We will be changing the start_date select input box to type dateRangePicker, where we will provide both the inputs for start date as well as for the end date.
- The single daterangepicker input box will be setting both the dashboard variables(‘s_date’, ‘e_date’) when the range is picked .
- Both(‘s_date’, ‘e_date’) dashboard variables will be passed as parameters to the ‘start_date’(since we are converting start date select input to date range picker input box) object which is created in the
Template.htmlfile.
See the image below for daterangepicker.
- Note: Now that we can select both start and end date using single daterangepicker input component. There is no need to initialize a separate input box to select end date. Hence we shall remove the end_date variable from the components.
- At the end of the page, inside
scripttag .Check variable components array.
var components = [runButton, start_date,end_date,chart];
dashboard.init(components);
- Remove end_date variable from components array ,since we do not need it now.
- Hence the code snippet is as follows:-
var components = [runButton, start_date,chart];
dashboard.init(components);
- Now save the
Template.htmlfile and run the report from the application. The result is as shown in the figure given below.
Note: In daterangepicker also we can change the display format and output format in the same manner as we did in datepicker.Refer the following code snippet in Template.html file.
<script>
    var start_date = {
        name: "start_date",
        type:  "daterangepicker",
	parameters :["s_date", "e_date"],
	options: {
            outputFormat: 'YYYY-MM-DD hh:mm:SS',
	    displayFormat: 'YYYY-MM-DD hh:mm:SS',
            multiple:false,
            value : 'value',
            display : 'display'
        },
    };
</script>
Now save the Template.html file and run the report to see the change in the display format of daterangepicker input box.
Note:-You can also create custom input type like date range slider etc.
