In this blog, we will learn how to create Bar chart in open source BI product Helical Insight.

To create a Bar chart in Helical Insight, you need at least one dimension and one measure. In this example, the dimension mode_of_payment is placed in the Columns section and the measure sum_travel_cost is placed in the Rows section. After selecting the Bar option under the Chart section in the Visualization panel, the system generates a vertical bar chart.

how to create Bar chart

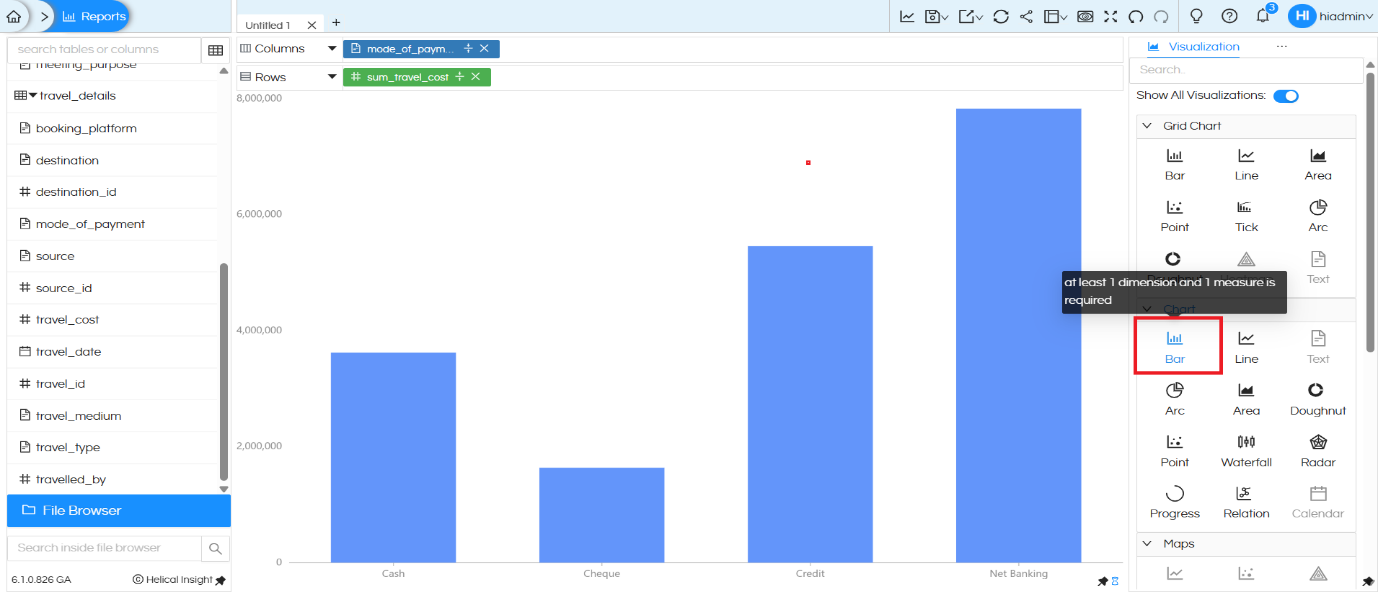
Each bar represents a payment mode (Cash, Cheque, Credit, Net Banking), and the height of the bar indicates the total travel cost for that category. This provides a simple and clear comparison across payment modes.

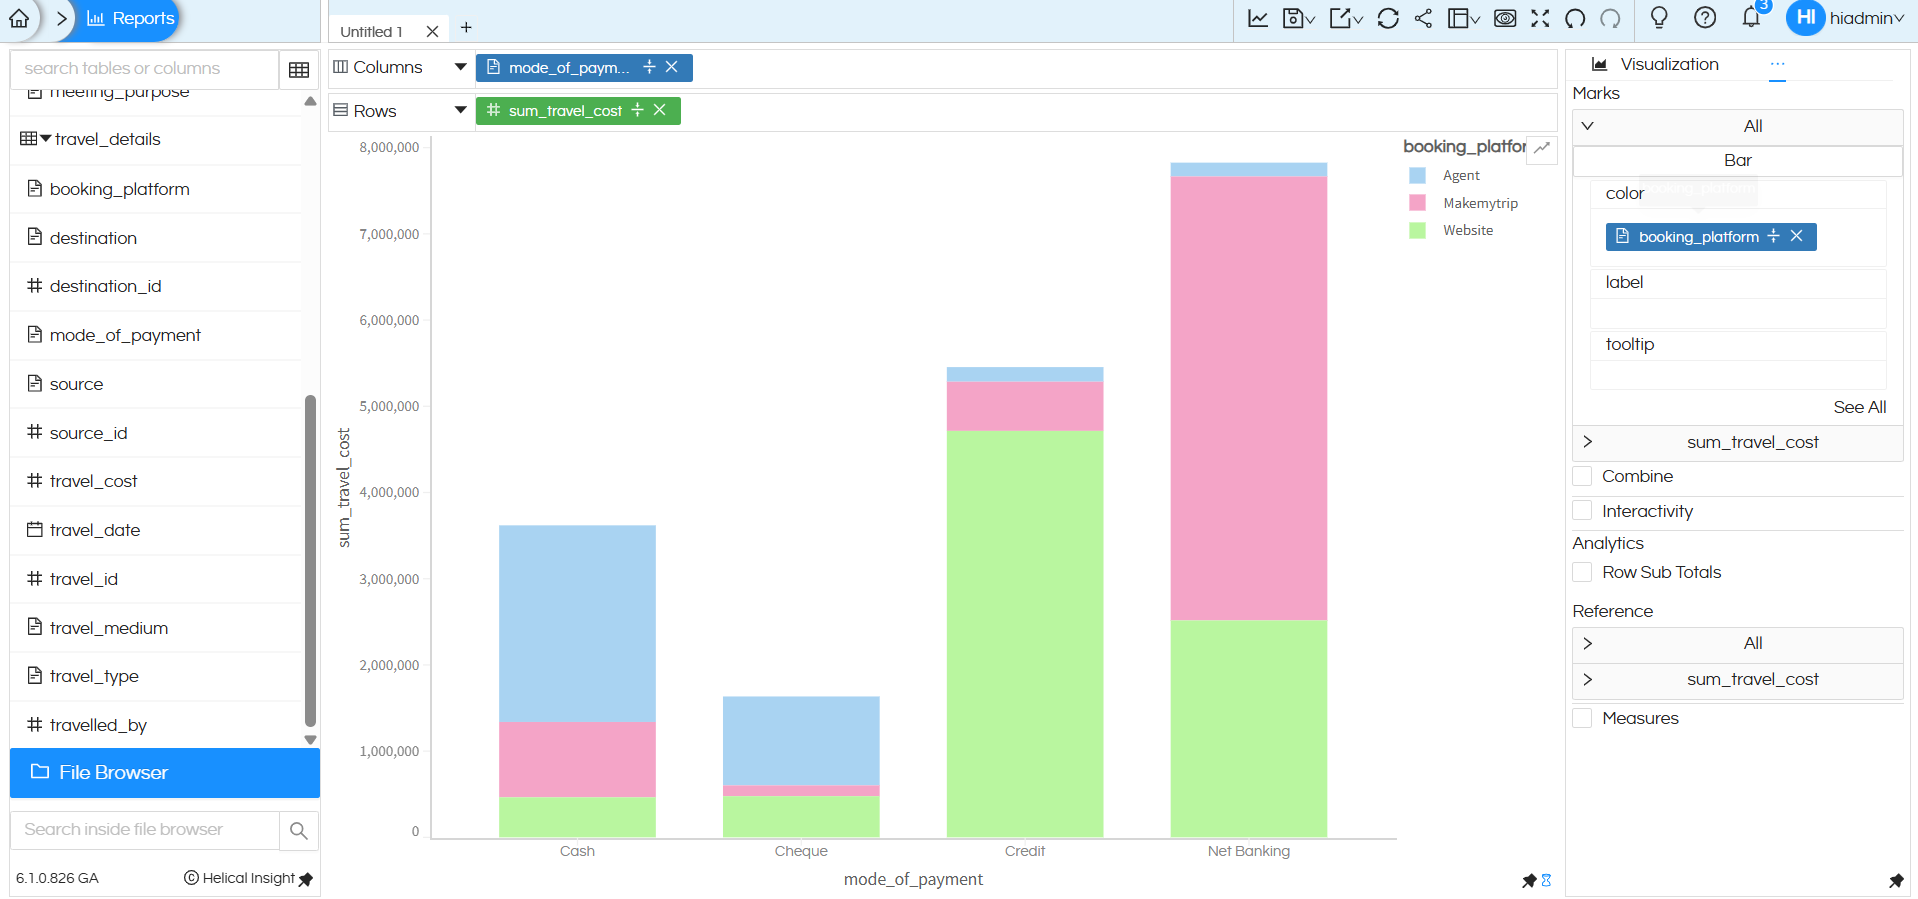
Using Color (Marks Section) to create Stacked Bar Chart:

Right now all the bars are of the same color. We can drag a dimension into the Color section of Marks. This converts the chart into a stacked bar chart based on the values of dimension dragged in color.

how to create Bar chart

Grid Style Bar Chart – Grid Chart Section

In the third example, additional dimensions such as booking_platform and travel_type are added along with the measure sum_travel_cost, and the Grid Chart Bar option is selected.

how to create Bar chart

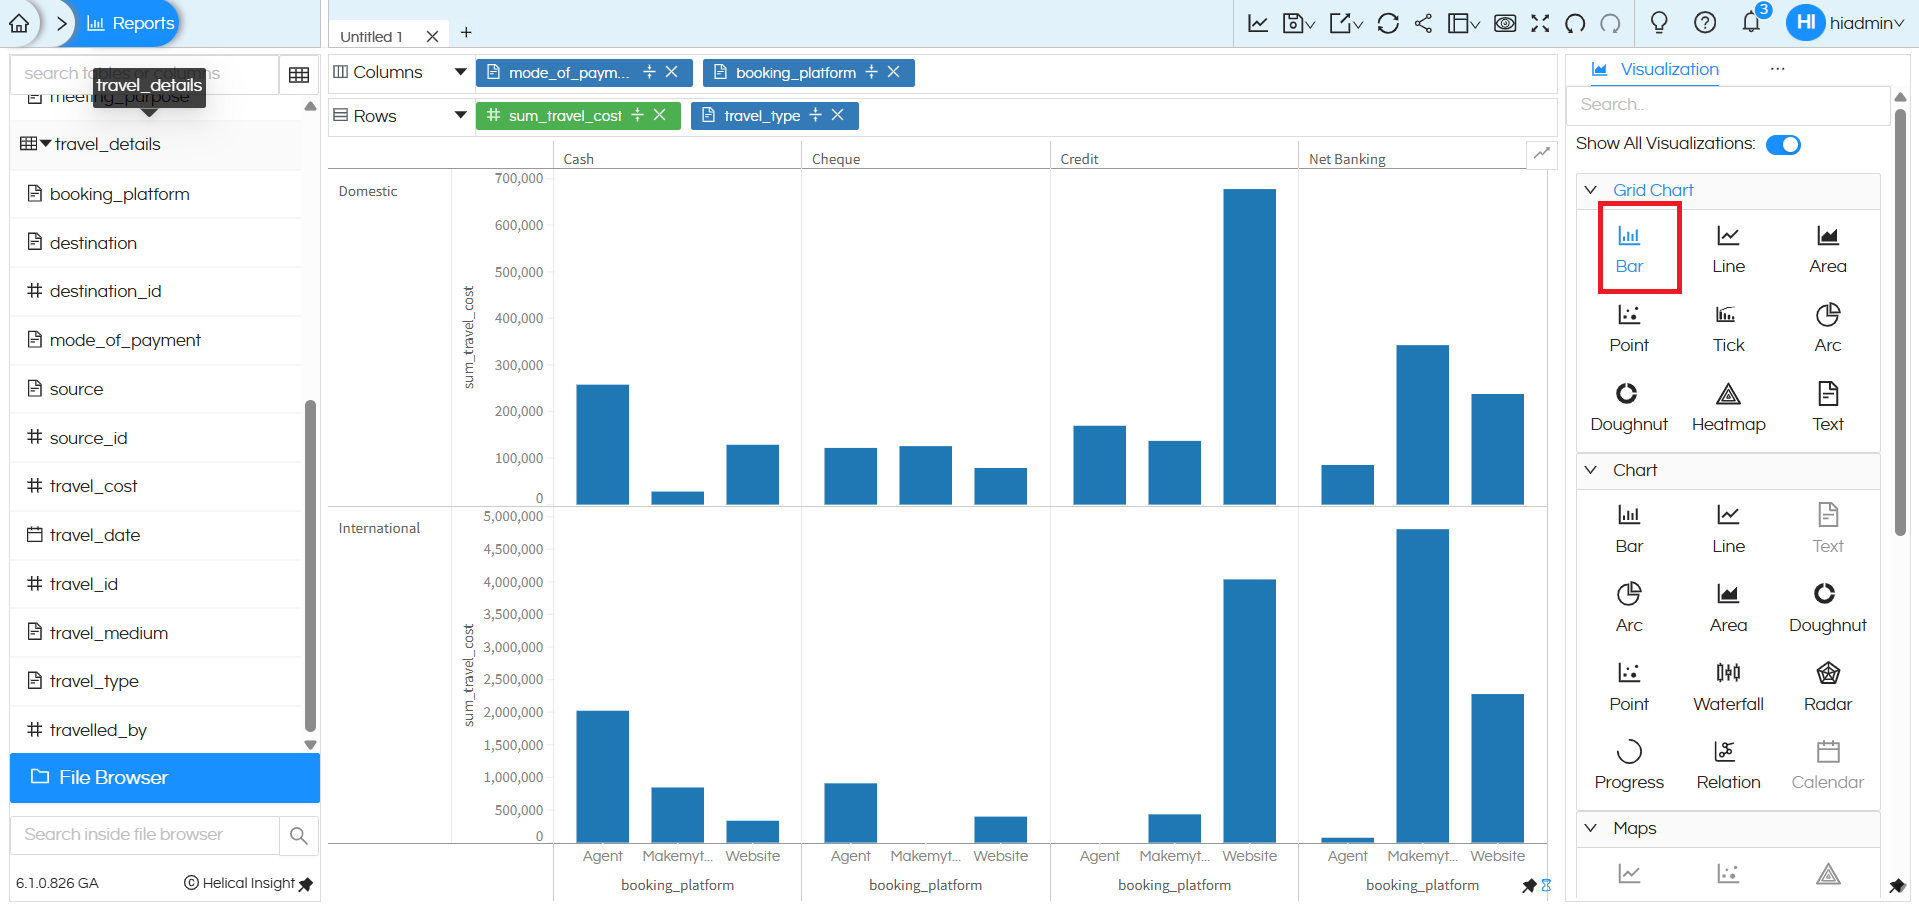
This creates a grid-style layout where the chart is divided into separate panels (for example, Domestic and International). Within each panel, grouped bars are displayed for different booking platforms across payment modes. This type of multi-level grouping and sub-chart creation is supported when using the Grid Chart Bar option.

However, when using the Bar chart from the standard Chart section, it supports only basic dimension–measure plotting and limited grouping. For advanced multi-dimensional analysis with separate panels and hierarchical grouping, the Grid Chart Bar option should be used.

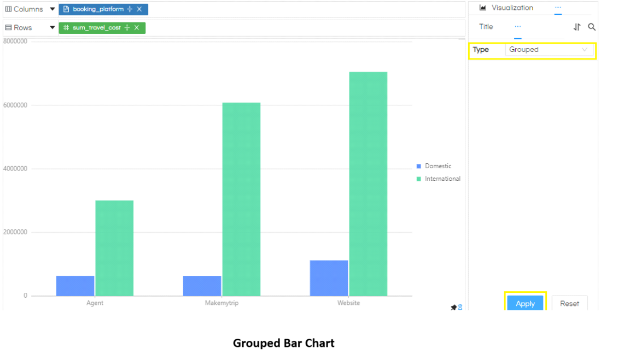
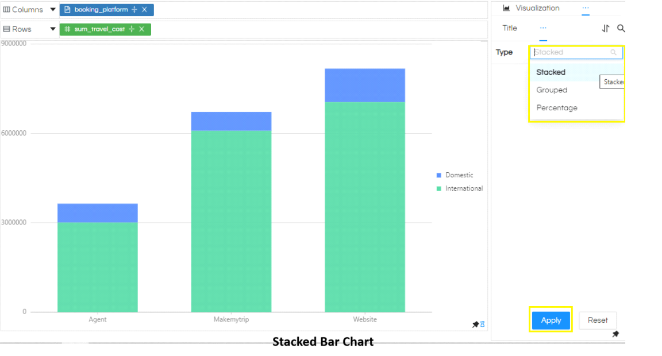
This created stacked bar chart can be converted into Grouped Bar chart (wherein each color instead of stacking with each other will be present next to each other) you can refer to this blog. We have also explained how to convert this stacked bar chart into 100% stacked bar chart.: https://www.helicalinsight.com/selecting-the-type-of-bar-charts-in-helical-insight-5-0/

how to create Bar chart

how to create Bar chart

There are a lot of other customizations like color palette, data format, caching, axis, drill down, drill through etc which can also be used. You can refer to our other blogs to learn about the same.

Reach out to us on support@helicalinsight.com in case of any more questions.

Leave a Reply

Helical Insight’s self-service capabilities is one to reckon with. It allows you to simply drag and drop columns, add filters, apply aggregate functions if required, and create reports and dashboards on the fly. For advanced users, the self-service component has ability to add javascript, HTML, HTML5, CSS, CSS3 and AJAX. These customizations allow you to create dynamic reports and dashboards. You can also add new charts inside the self-service component, add new kind of aggregate functions and customize it using our APIs.
Helical Insight, via simple browser based interface of Canned Reporting module, also allows to create pixel perfect printer friendly document kind of reports also like Invoice, P&L Statement, Balance sheet etc.
If you have a product, built on any platform like Dot Net or Java or PHP or Ruby, you can easily embed Helical Insight within it using iFrames or webservices, for quick value add through instant visualization of data.
Being a 100% browser-based BI tool, you can connect with your database and analyse across any location and device. There is no need to download or install heavy memory-consuming developer tools – All you need is a Browser application! We are battle-tested on most of the commonly used browsers.
We have organization level security where the Superadmin can create, delete and modify roles. Dashboards and reports can be added to that organization. This ensures multitenancy.
A first-of-its-kind Open-Source BI framework, Helical Insight is completely API-driven. This allows you to add functionalities, including but not limited to adding a new exporting type, new datasource type, core functionality expansion, new charting in adhoc etc., at any place whenever you wish, using your own in-house developers.
It handles huge volumes of data effectively. Caching, Pagination, Load-Balancing and In-Memory not only provides you with amazing experience, but also and does not burden the database server more than required. Further effective use of computing power gives best performance and complex calculations even on the big data even with smaller machines for your personal use. Filtering, Sorting, Cube Analysis, Inter Panel Communication on the dashboards all at lightning speed. Thereby, making best open-source Business Intelligence solution in the market.
With advance NLP algorithm, business users simply ask questions like, “show me sales of last quarter”, “average monthly sales of my products”. Let the application give the power to users without knowledge of query language or underlying data architecture
Our application is compatible with almost all databases, be it RDBMS, or columnar database, or even flat files like spreadsheets or csv files. You can even connect to your own custom database via JDBC connection. Further, our database connection can be switched dynamically based on logged in users or its organization or other parameters. So, all your clients can use the same reports and dashboards without worrying about any data security breech.
Our application can be installed on an in-house server where you have full control of your data and its security. Or on cloud where it is accessible to larger audience without overheads and maintenance of the servers. One solution that works for all.
Different companies have different business processes that the existing BI tools do not encompass. Helical Insight permits you to design your own workflows and specify what functional module of BI gets triggered