From version 7.0 onwards, Helical Insight has introduced an AI analytics module, allowing user’s to have conversational chat based data analysis capabilities. In the first version Instant BI module works as a QnA agent, allowing users to ask questions from the data, get instant answers in the form of data numbers & charts, save the chat and share with other users as well. In subsequent versions, we would be adding more and more agentic capabilities.
Row level data security: Even if a chat is shared with other user / a user is using the AI module to ask questions from the data, proper row level data security will still get applied. Hence people will be able to see their data only based on their access levels.
Agentic Layer: In order to use the InstantBI module, a new layer is introduced called as Agent Layer. This agent layer is created on top of previously created metadata. The agent layer helps in defining various things like synonyms, custom calculations and KPIs etc. This agent layer helps a lot in ensuring that the LLM’s do not hallucinate.
Step 1: Open the Agent Creation Panel
Click the ribbon icon to expand it, then select “Agent” to begin creating a new one.

Step 2: Add Your Metadata
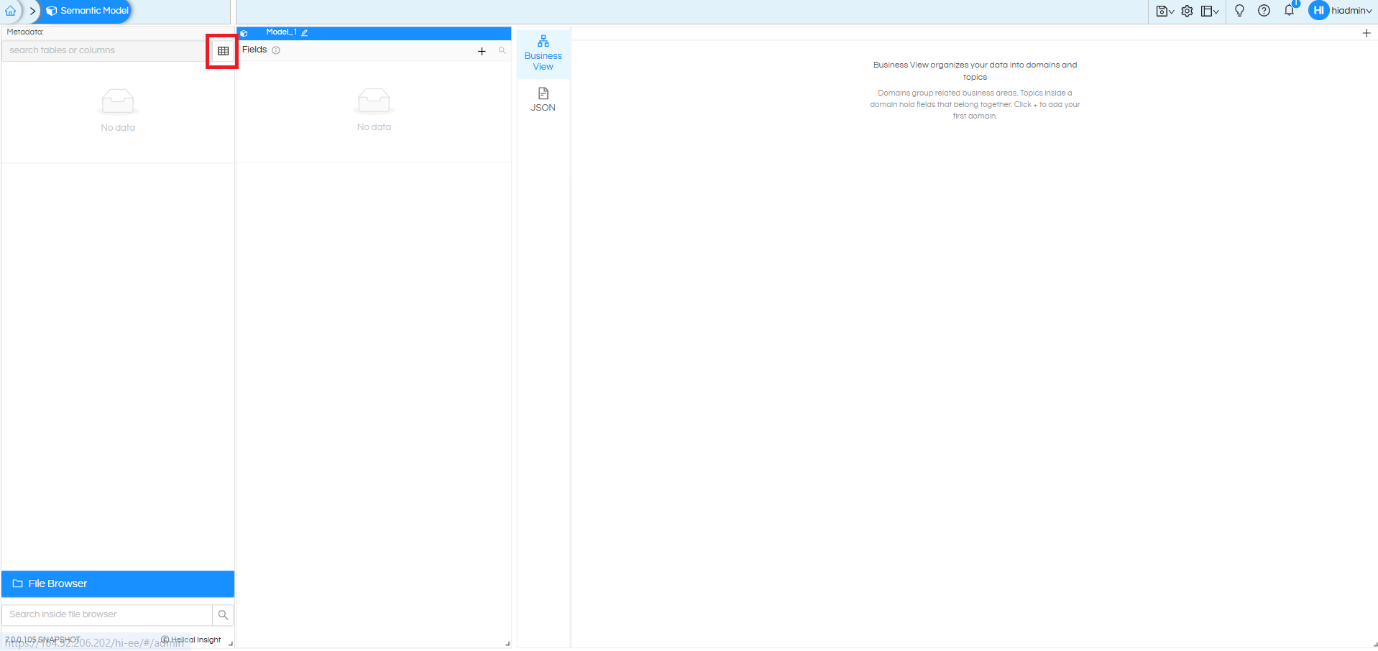
Before an agent can answer questions, it needs metadata — the structured description of your data that tells the agent what each field means and how to use it. Once you’re in the agent creation screen, add the metadata you want this agent to work with. Click on the icon, highlighted in the below image, to open the metadata in the Agent module.
To know more about how to create metadata you can refer this blog: https://www.helicalinsight.com/creating-metadata/

Step 3: Fill in the Agent Details
With your metadata added, you’ll see a set of Fields that define how the agent behaves.
Here’s what each one means:

| Field | Description |
|---|---|
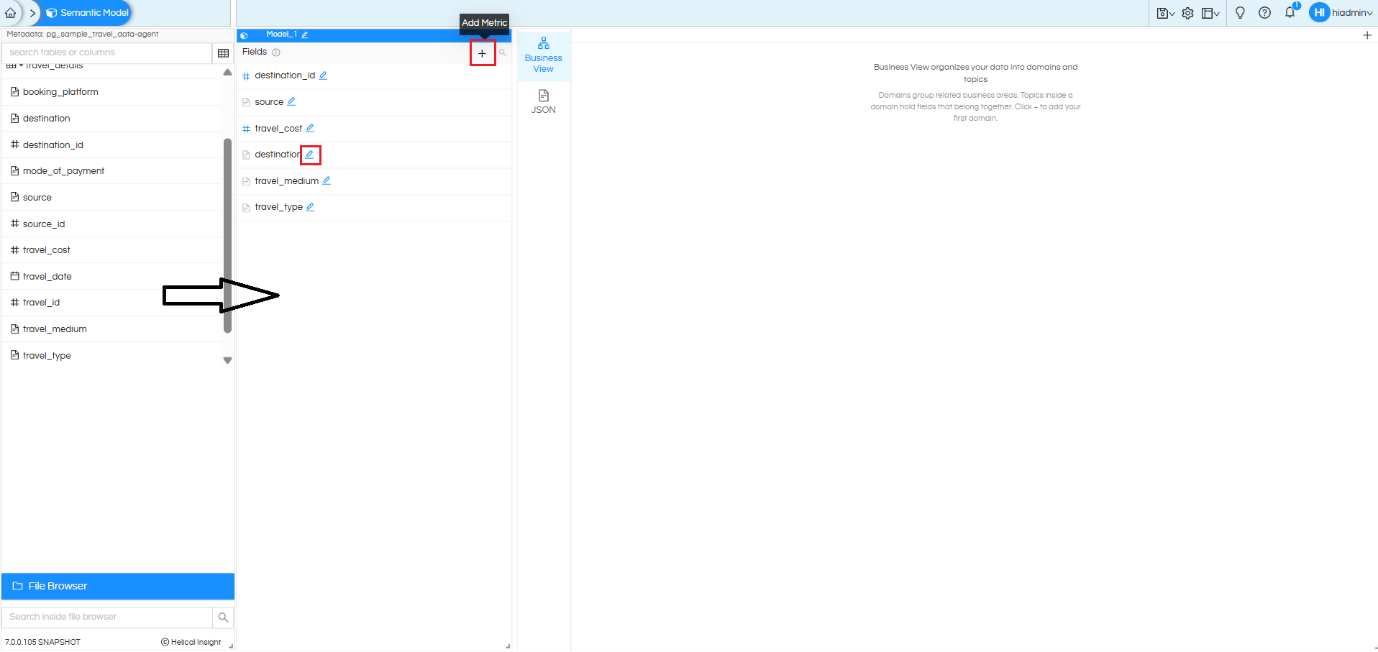
| Add Fields (+) | Click the highlighted + icon to manually add a new field to the section. This option allows you to create and configure custom fields according to your requirements. |
| Agent | The name of this agent file (for example, Finance Agent). This name is used whenever you save the agent. |
| Domain | The data that you have connected here, you can mentioned the domain in this space. Example of domain includes things like Travel, Sales, Operations, Retail, HR, Finance etc. This gives the AI some idea about what kind of data fields and the data will be there. |
| Description | A short summary of what this agent covers and how it should be used. This field is required when saving the agent. |
| Topic | The business topics this agent relates to. Enter comma-separated values, such as Sales, Travel. |
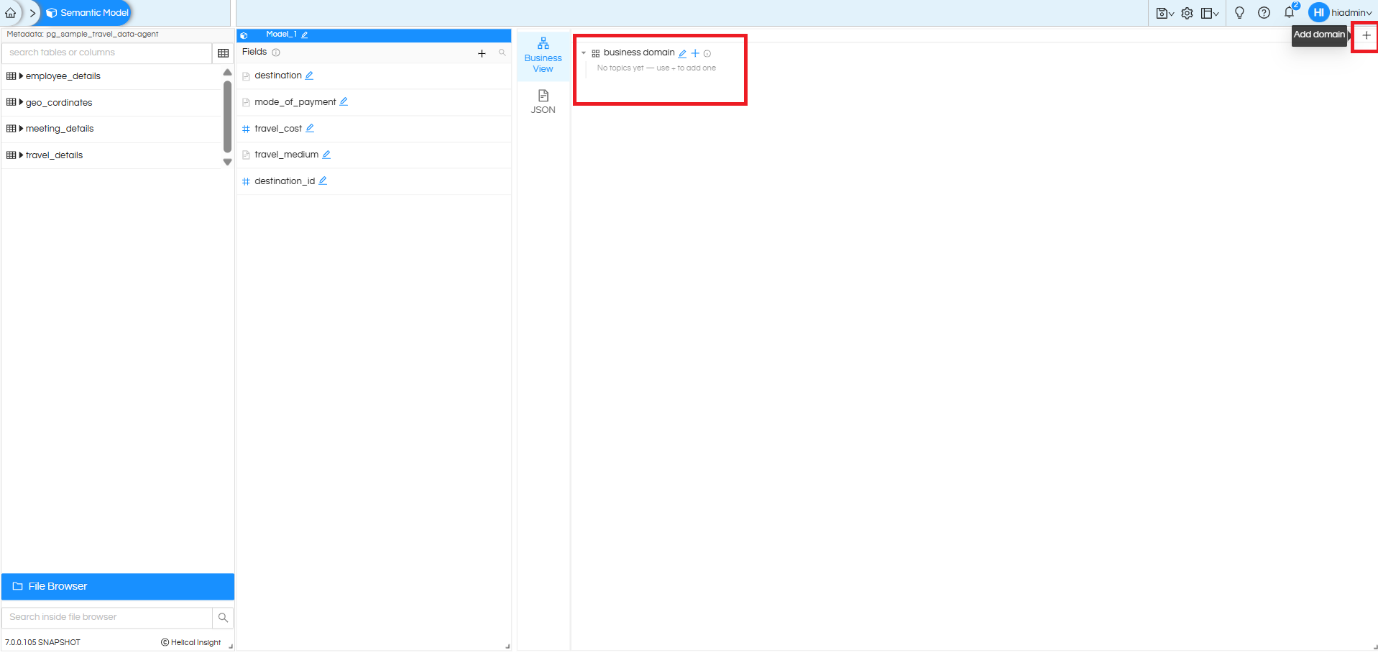
The hierarchy is something like below
├── Domain
│ ├── Topic
│ │ ├── Semantic Model
│ │ │ ├── Facts
│ │ │ ├── Dimensions
│ │ │ └── Measures
Example: The sample data that we have is a travel metadata having information like source, destination, cost, date of travel, reason for travel etc.
Domain: “Travel”
Description: “This metadata belongs to the Travel domain, the data has the employee of the travel management, and they have traveled to different business trips. They have different mode of transportation. They have meeting with different Companies MNC and meeting status is maintained in the meeting table. The Geocordinate defines the place of travel by the employees. The travel cost is also noted in the travel table.”
Topic: “Meeting”, “Travel Cost”
| Field | Description |
|---|---|
| Fields | The display name for each column in your agent’s metadata. Right-click any field for more actions. |
| Dimensions | Toggle between Dimension and Measure. Dimensions are used for grouping and filtering, while Measures are numeric values that can be aggregated. Use the (⋯) menu to configure data type and display format when Measure is selected. |
| Semantic Type | Select the appropriate semantic type from the dropdown (for example, Person, Organization, Category, String, Text, Numeric, DateTime, Location, Geography, Geography Latitude, or Geography Longitude) so the agent can correctly interpret the column values. |
Step 4: Adding a field/Bring in Fields from Your Metadata
There are two methods through which you can add fields
- By clicking on the “+” icon at the top right (explained earlier in the blog)
- Second option is by simply dragging the required field from the metadata pane. It is possible to drag any field from any table into the agent layer.
We should keep only those fields here which we think will be mainly used by the business users while interacting with the data in English language.

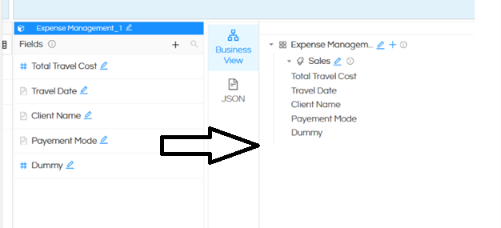
Fields added to the agent from the metadata panel.
Step 5: Edit and Refine Your Fields
Once fields are added, first thing is you can rename the field simply by clicking on the pencil icon and give it another name.

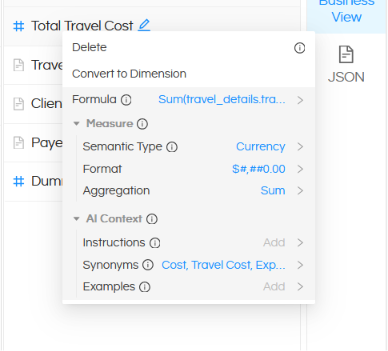
When a field is added here, there are right-click options on the added field allowing more operations like
Delete
If some field is added which you do not want to include, you can delete it.
Formula
In many cases if we are specifying a metric, we can click on + and add a metric. Give it a name (like “Cancellation Rate”). And then in the formula we can mention the formula (as close to SQL as possible to avoid chances of hallucination like count(field1)-count(field2)). Any column from the metadata can also be mentioned in the formula even if it’s not part of the agent.
(count(travel id) when meeting_cancellation_status=true))/count(travel id)*100
Description
This is a small description of the field, so that users and AI will understand.

Numeric Field Options
For fields with the Numeric semantic type, the three-dot (⋯) menu becomes available. This menu lets you configure additional properties for the field:
| Option | Description |
|---|---|
| Data Type | Select whether the numeric value should be treated as a Number or a Date. |
| Format | Choose the display format for numeric values, such as 0.00 or 00.00, depending on your reporting requirements. |

These options help control how numeric data is interpreted and displayed in reports and AI-generated insights when these specific fields are used. We would be adding more and more options over here, allowing you to control the way the data is visible at the frontend.
View Mode Settings
The Settings (⚙️) icon in the top-right corner lets you switch between Normal and Advanced view modes for the Agent configuration screen.
| Mode | Description |
|---|---|
| Normal View | Displays only the essential configuration options, providing a simplified interface for quickly creating and managing agent metadata. |
| Advanced View | Displays all available configuration options, including advanced field settings such as Sort, Aggregation, Partition, semantic type configuration, formatting options, and other metadata properties for fine-grained control. |

Sort
The Sort option controls when this field is used at the AI layer, in which order the data will appear by default. When enabled via the checkbox option, click the three-dot (⋯) menu to specify the default sort order:
| Option | Description |
|---|---|
| Ascending (ASC) | Sorts values from smallest to largest or A to Z. |
| Descending (DESC) | Sorts values from largest to smallest or Z to A. |
| None | When none is selected, the data will appear |
NOTE:
In our AI prompt while creating report also, we can specify the sorting sequence as well. If not, then the sequence mentioned here for that respective field will be used.
Aggregation
The Aggregation option is available for measure (numeric) fields. It determines how values are summarized when that field is used in AI-generated queries. When enabled via the checkbox option, use the three-dot (⋯) menu to choose an aggregation function such as:
- Sum – Adds all values together.
- Average – Calculates the mean value.
- Count – Counts the number of records.
- Minimum – Returns the smallest value.
- Maximum – Returns the largest value.
- Distinct Count – Counts and shows only the distinct values
NOTE:
In our AI prompt while creating report also, we can specify the aggregation function to be applied as well. If not, then the aggregation mentioned here for that respective field will be used.
Partition
The Partition option marks a field as a partitioning dimension. When enabled, data can be logically divided or grouped based on the values in that field. This helps the AI agent organize, process, and analyze large datasets more efficiently by treating each partition independently. Typical partition fields include Date, Region, Department, or Category.
Step 6: Reuse Your Agent with JSON
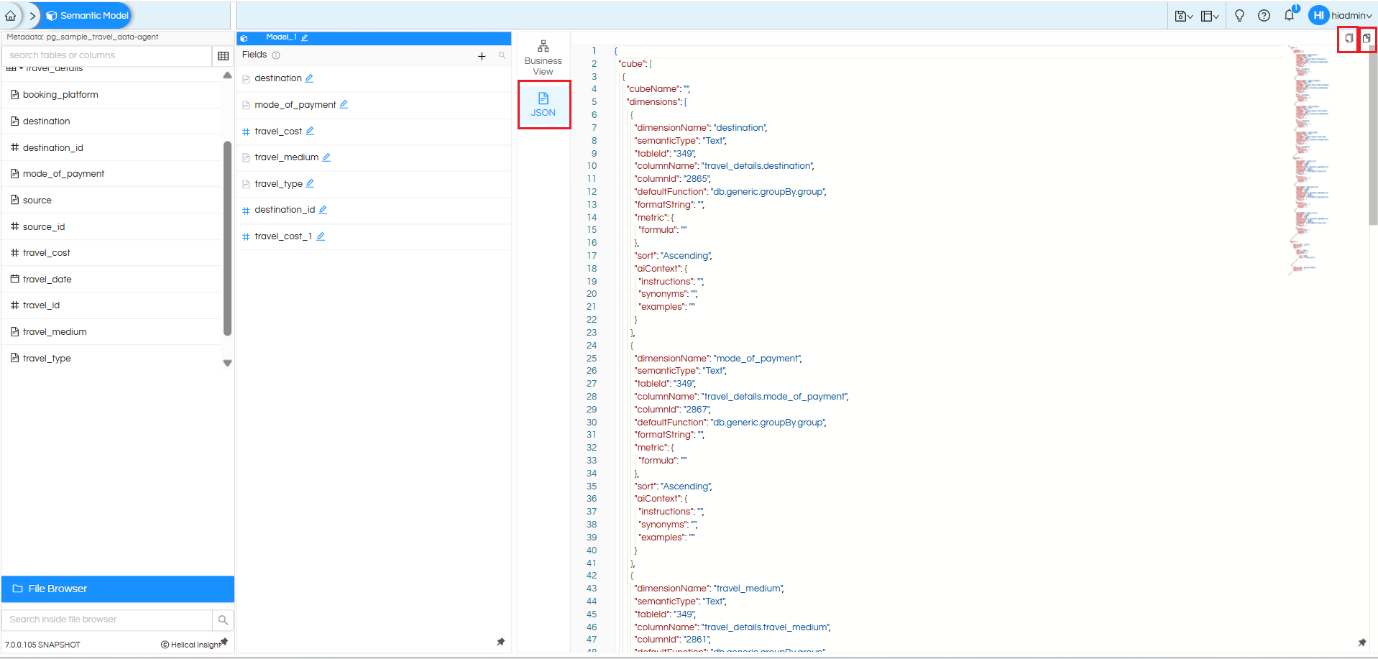
With every actions that is performed here at the backend we are creating a JSON. You can click at the top and will get options like view the raw JSON, copy the JSON, paste the JSON etc. It is even possible to make changes in these raw JSON also.
Once your agent is set up the way you want, you can copy it as JSON. This makes it easy to reuse the exact same agent configuration on a different server, or share it with a teammate, without rebuilding it from scratch.

To bring an agent configuration back in, click the paste-JSON icon in the middle of the toolbar. This opens a pop-up where you can paste JSON that was copied earlier, or that you’ve written in the same structure.

Paste a previously copied JSON configuration to recreate an agent.
If you’d rather work with the raw configuration directly, use the switch icon to toggle between the visual Editor and Raw JSON views. You can edit the JSON directly, then switch back to the editor view at any time using the same icon.

Switch between the visual editor and raw JSON to edit the agent directly.
Step 7: Save Your Agent
Once everything looks right, save your work. You can save or “save as” directly into the Helical Insights file browser — either as a standalone file or inside a folder — so your agent is ready to use whenever you need it.