In this blog we are going to learn how to implement inter panel communication on charts i.e. clicking on one chart the other panels of the dashboard should get updated. In case if you want to implement inter panel communication on table you should refer to this blog
For using Inter-panel communication functionality, user needs to create two reports i.e. a parent report & a child report:-
Parent report: Primary report to which the Inter-panel communication functionality is to be applied
Child report: Secondary report which will reflect the data according to the click on the parent report columns
Note: Child report should have a filter which would be the input parameter to be passed in parent report. It is always better to create the Child report first.
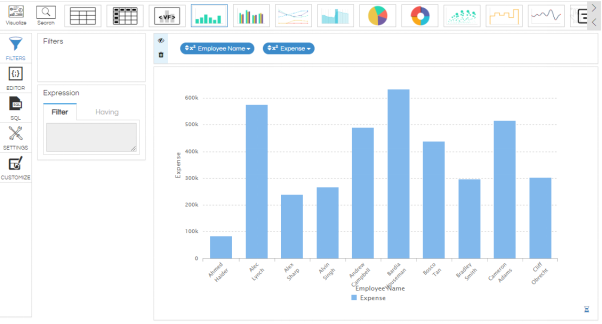
Example: Let us create a bar chart report of Employees and their expenses. We will then apply Inter-panel communication functionality on the Employee name; so if any of the employee names is clicked, a report showing Travel date and Destination will refresh and show data for that particular selected Employee name.
So in this case, parent report is the one which shows Employee name & Expenses. And Child report is the one which shows Destination & Travel date.
We will first see how to create the child report. Following are the steps to create child report:
Step 1: Create a report with Destination & Travel date as columns
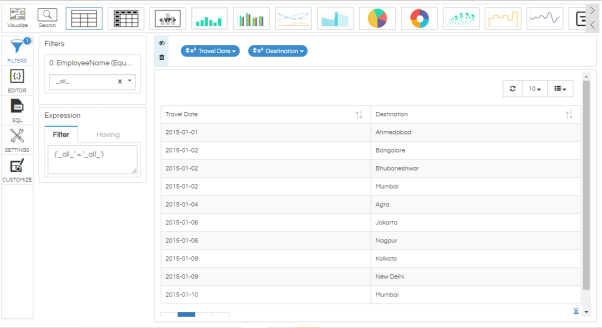
Step 2: Now add ‘Employee name’ column in the filter section and edit the filter
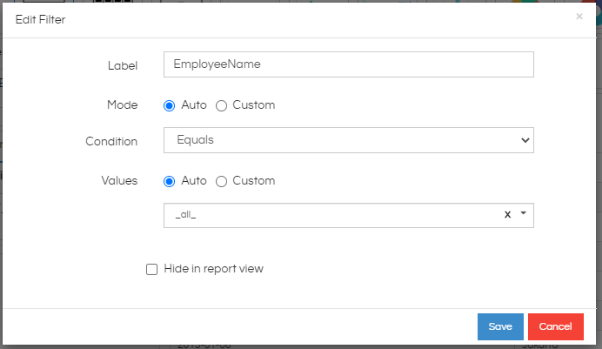
Step 3: Select mode & values as ‘auto’. Select any employee name as a default
Step 4: Click on Generate report
Step 5: Save this report in the file repository by giving an appropriate name
The child report is now ready. We can now make the parent report to which IPC functionality is to be applied. Following are the steps to create a parent report:
Step 1: Create a bar chart report with Employee name & Expense as columns
Step 2: Click on the ‘Customize’ button
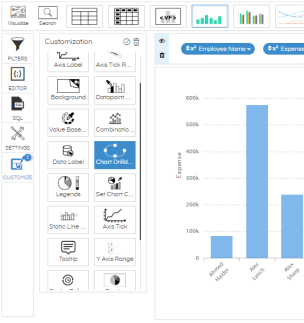
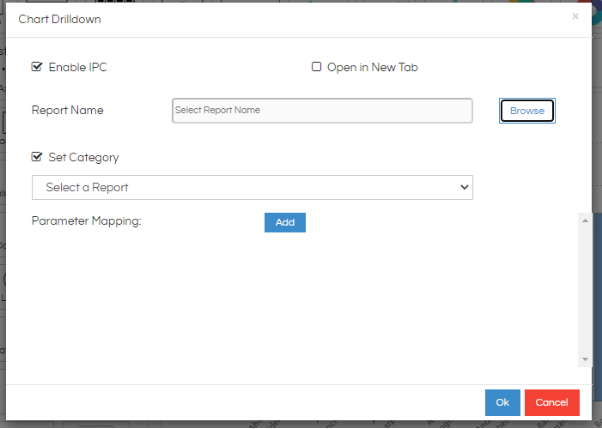
Step 3: Double-click on ‘Drill down’ icon and select Enable IPC checkbox. Click on Browse button.
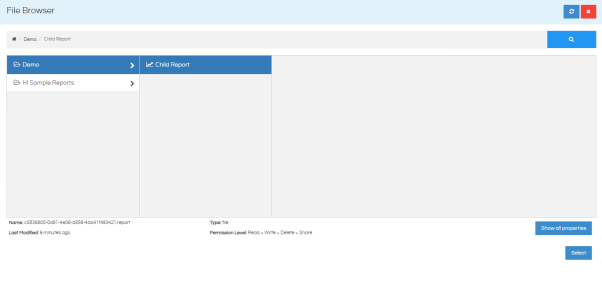
Step 4: Navigate to the child report from the file browser. Click on Select button.
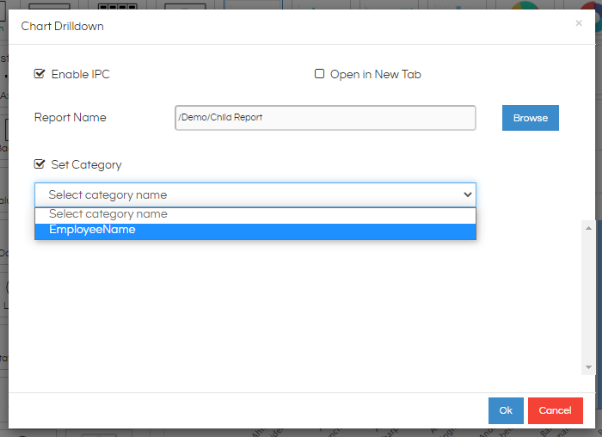
Step 5: In Set Category, select the parameter that you are going to pass (EmployeeName) from the list. Here it will show the list of all the filters which the child report is having. If there are multiple filters it will show all. Make sure you are selecting the correct Category.
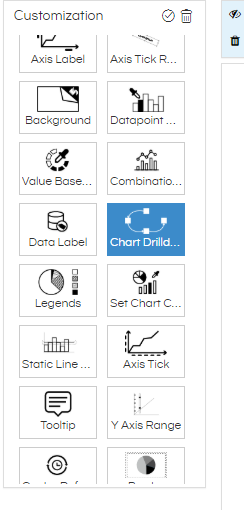
Step 6: Click on OK. Click on the small tick mark at the right corner of Customisation pane to apply the customisation.
Step 7: Save the report with the appropriate name.
Step 8: Now open dashboard designer and drag the parent and child report in the dashboard canvas
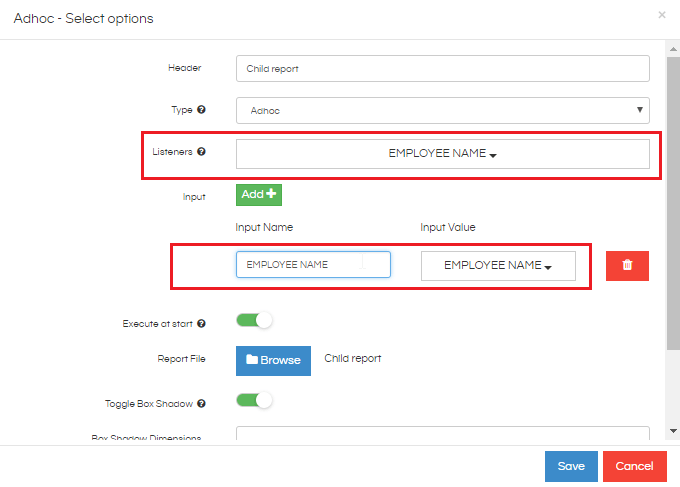
Step 9: Click on the edit icon of the child report and set the listener with the appropriate input parameter. Please note, that if the variable name is not visible, go to Variables section and refresh and save the changes. The variable will now be available.
Users can now see that if any employee name is clicked from the parent report, the child report refreshes and shows data for that particular employee.
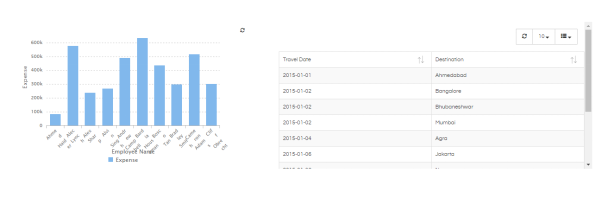
After Clicking on particular Employee Name

Your dashboard can also have multiple charts whose value should get changed when clicked on the parent report. So all those other charts also can be added to the dashboard canvas (they should also have the relevant filter i.e. in this case the other reports also should have employee_name filter) you can click on edit and apply listeners to them as well.
Thus multiple charts can be updated simultaneously by adding the relevant listener and input parameters to the charts.
For More Info, Contact us at support@helicalinsight.com
