With version 5.0 onwards we have revamped the entire UX of dashboard designer and made it much more smoother and easier to use.

On the dashboard designer page, there are multiple operations and functionalities which can be done by right-clicking. Now on whatever component the right click happens, the functionality/UX changes get applied to that specific component. For instance, the components can be added reports, added images, added text boxes, or a group.

Right-Click Operations In Dashboard Designer

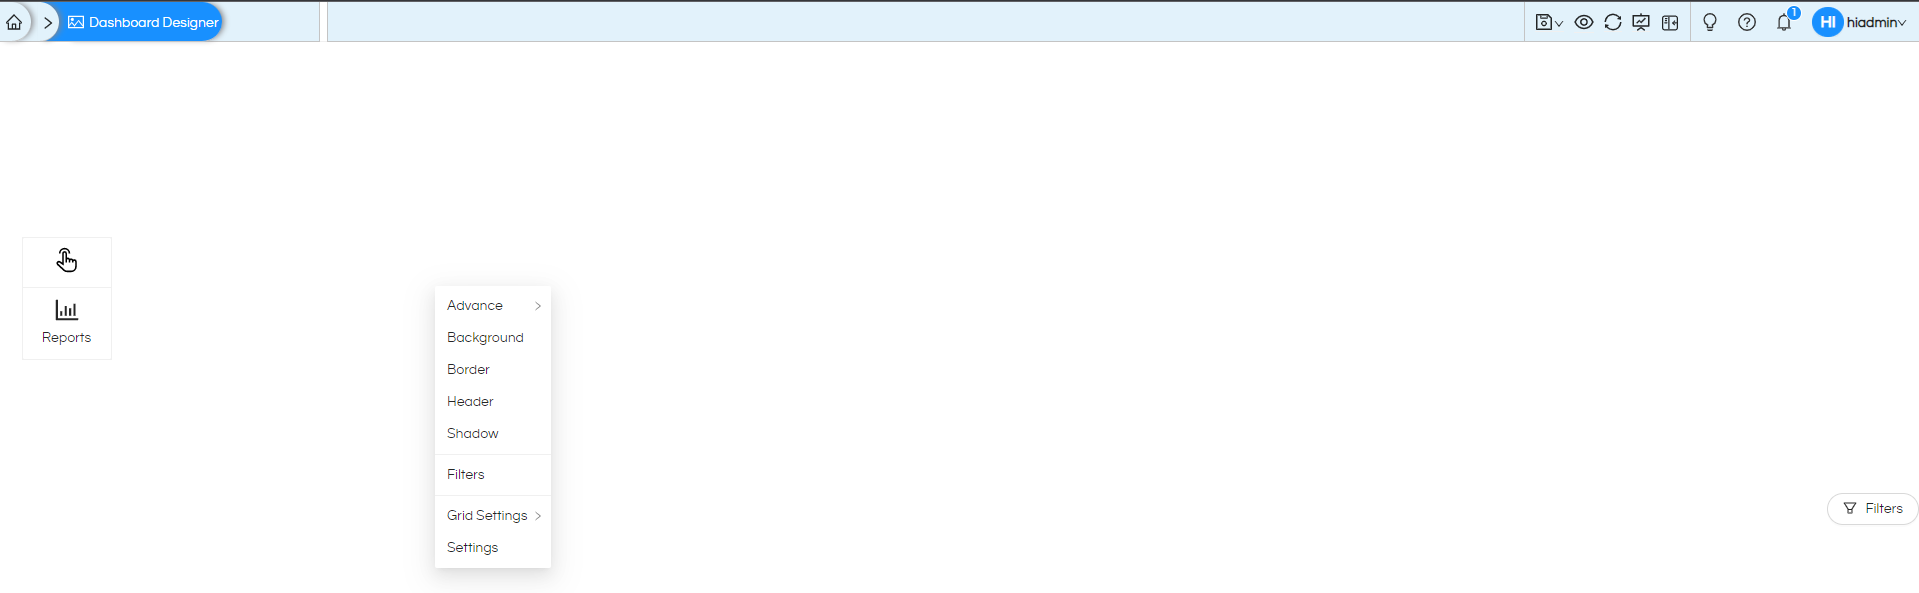
Please note that some of the options may/may not appear on right-click based on the kind of component we have clicked on.

Below we have explained the various options of right-clicking.

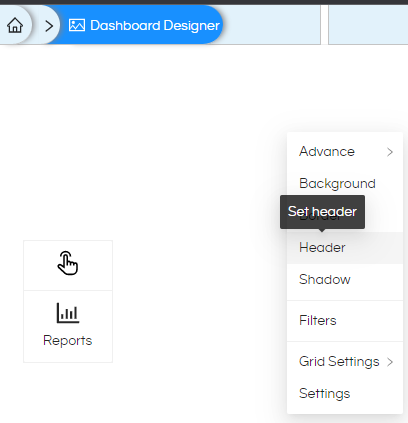
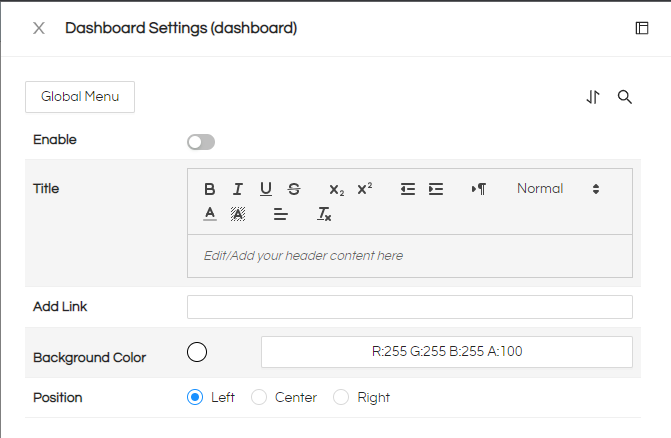
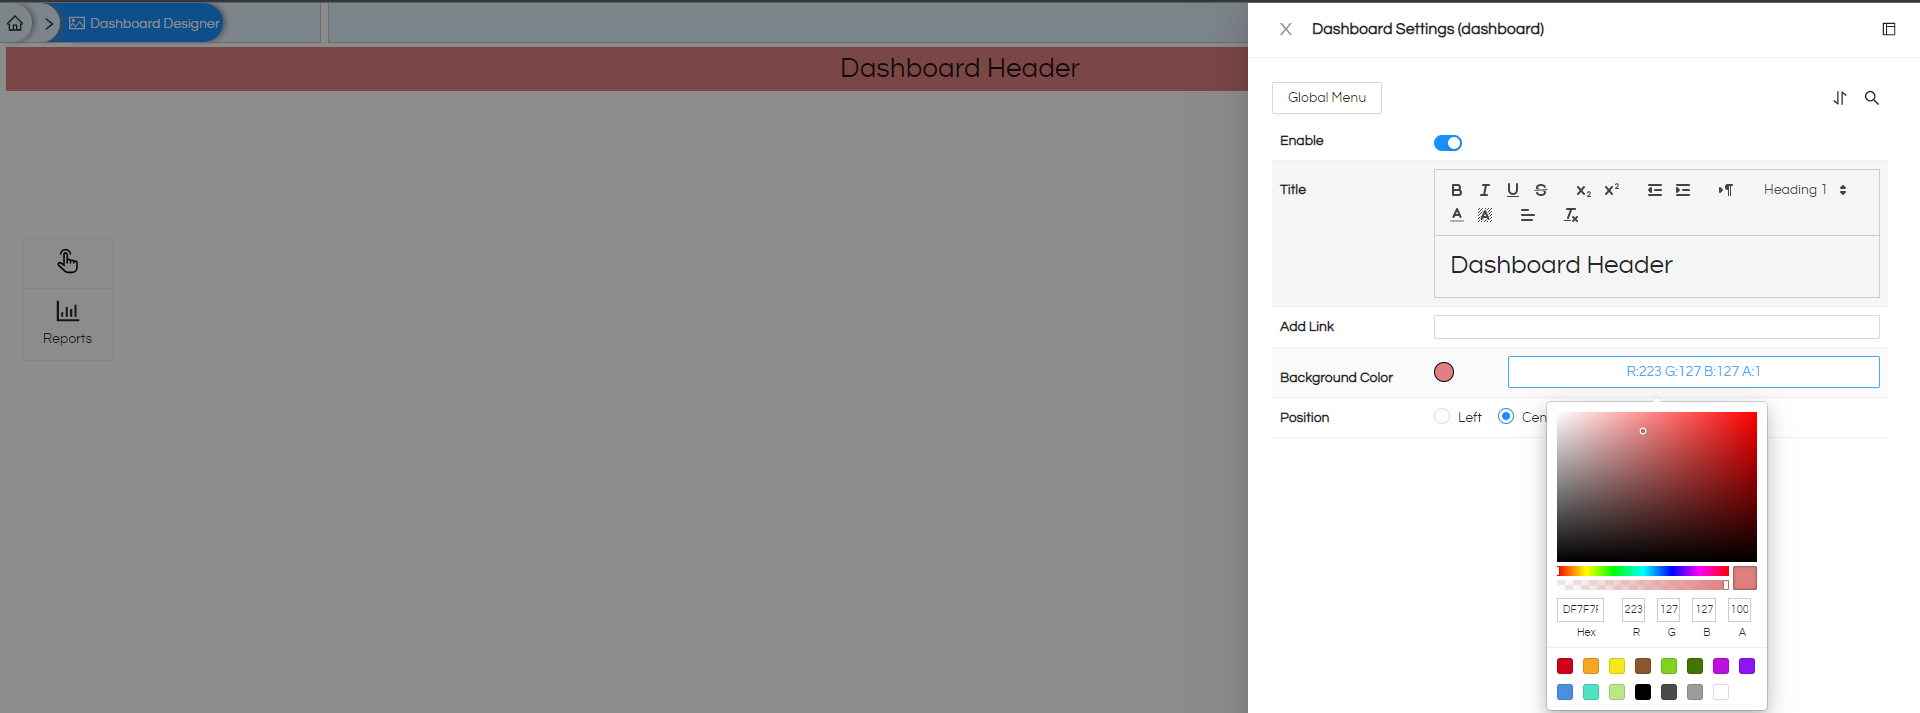
Header: The header option allows to give the entire dashboard or individual components a header. When clicked and enabled it allows you to write content for the header and format it like size, color, alignment, position, etc. The header component also allows you to add an “Add Link” to the header as well as define the “BackgroundColor”.

Whenever any report is added, it has by default a header of bluish color background with report name as header. The same can be changed

Right-Click Operations In Dashboard Designer

Right-Click Operations In Dashboard Designer

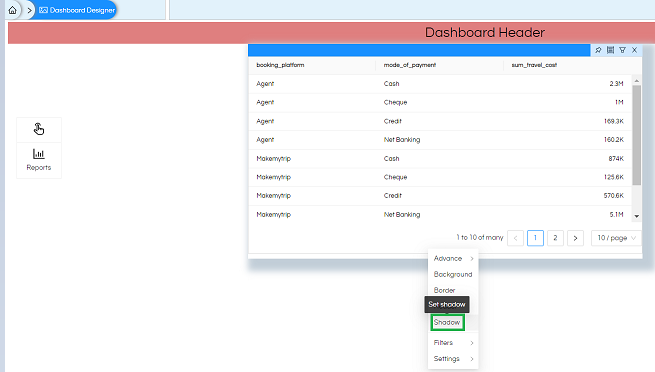
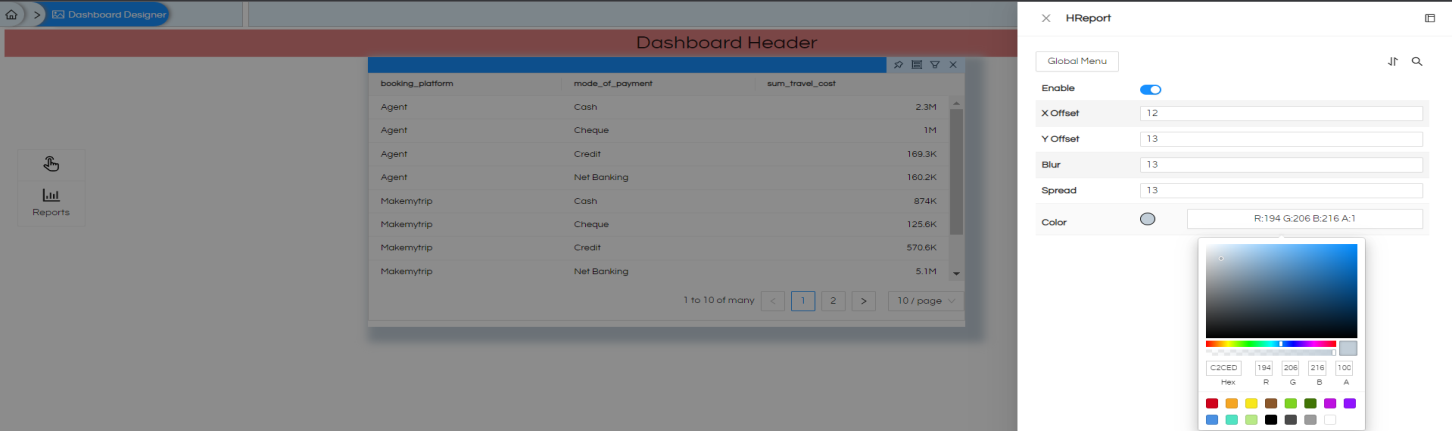
Shadow: Shadow allows you to give shadow to a component or entire dashboard. You can define the X-offset, Y-offset, Blur, & Spread. Then decide the color as well as its transparency using the “a” option.

Right-Click Operations In Dashboard Designer

Right-Click Operations In Dashboard Designer

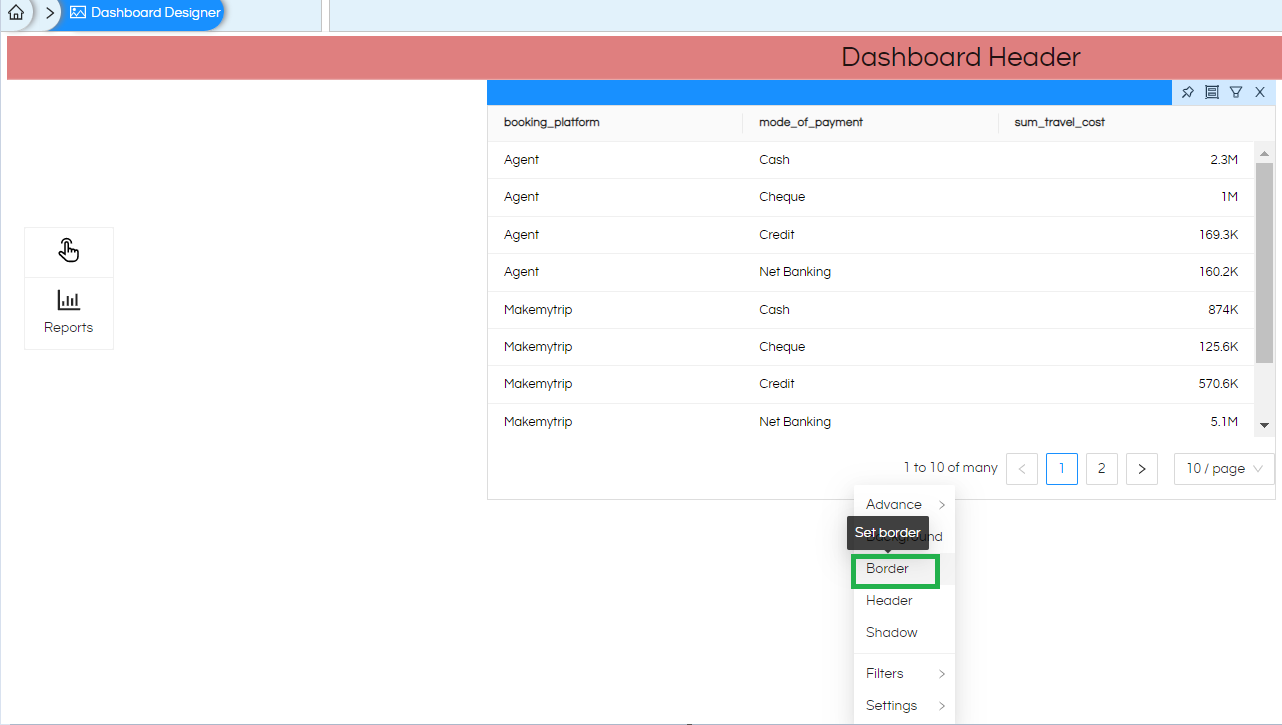
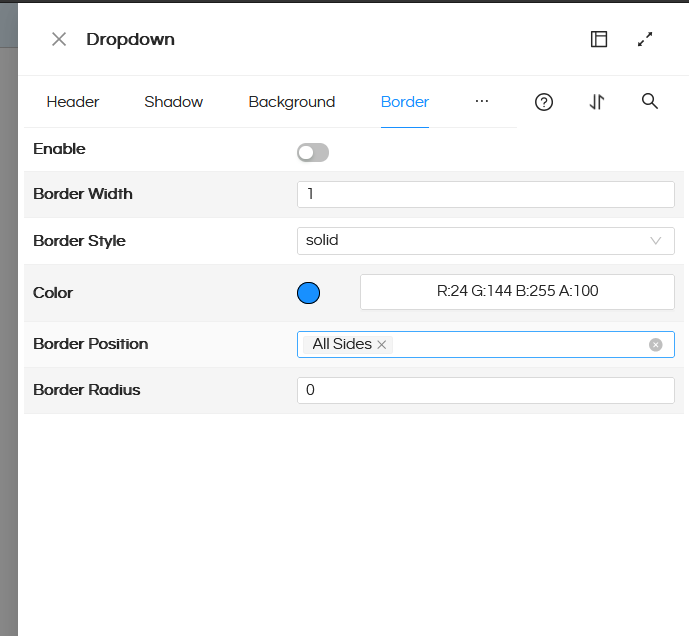
Border: Border allows you to give a border to a component. You can select the border width, Border Style, and border color.

Right-Click Operations In Dashboard Designer

Right-Click Operations In Dashboard Designer

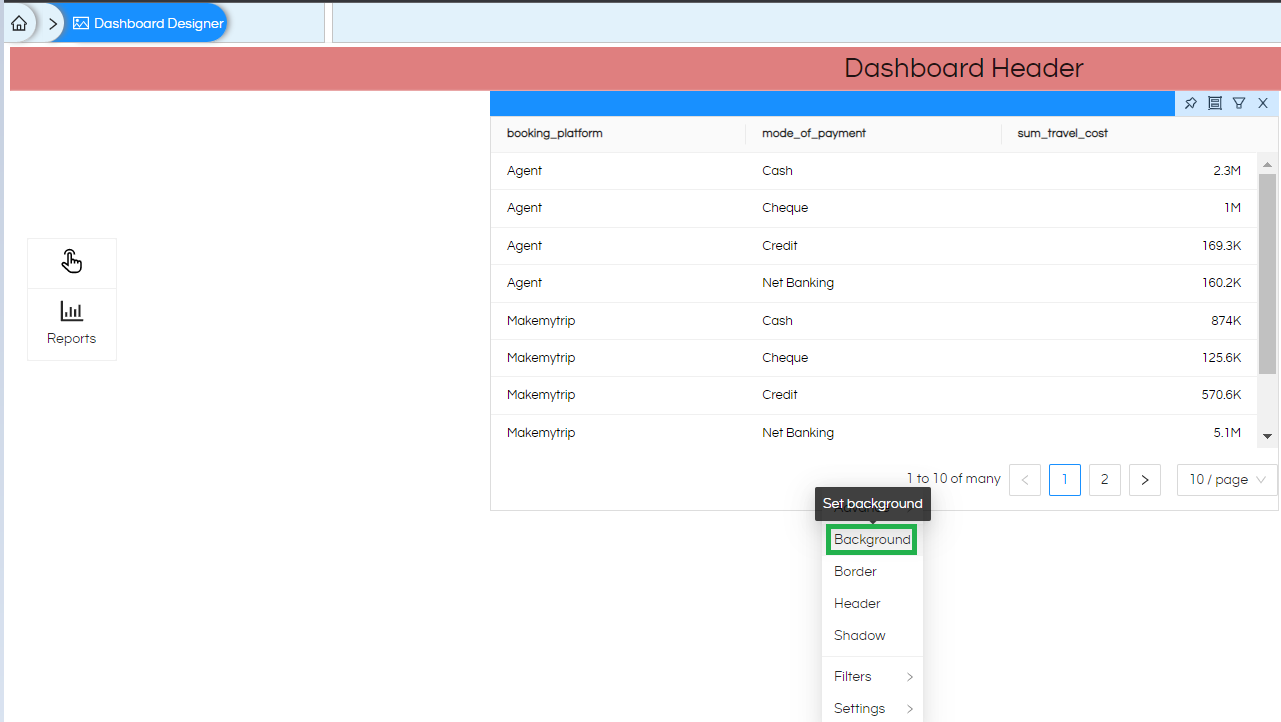
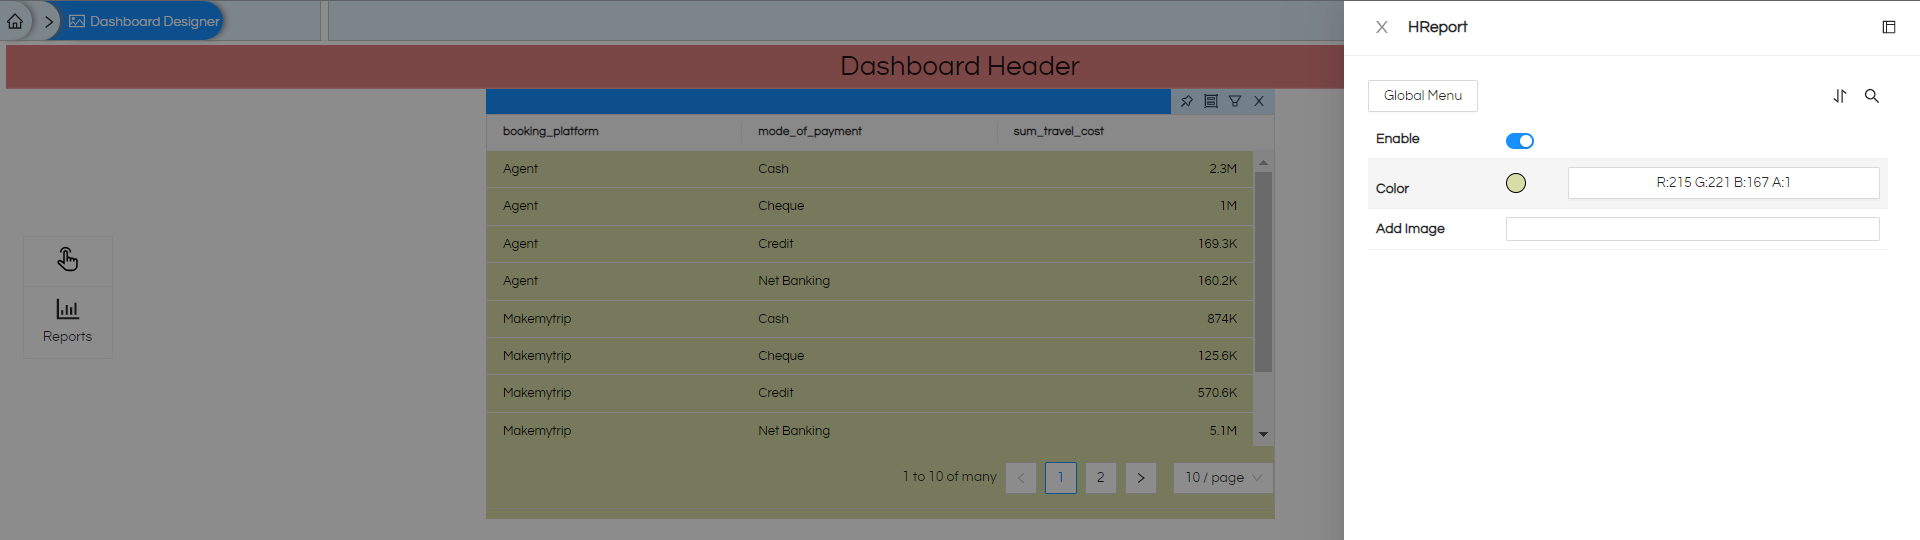
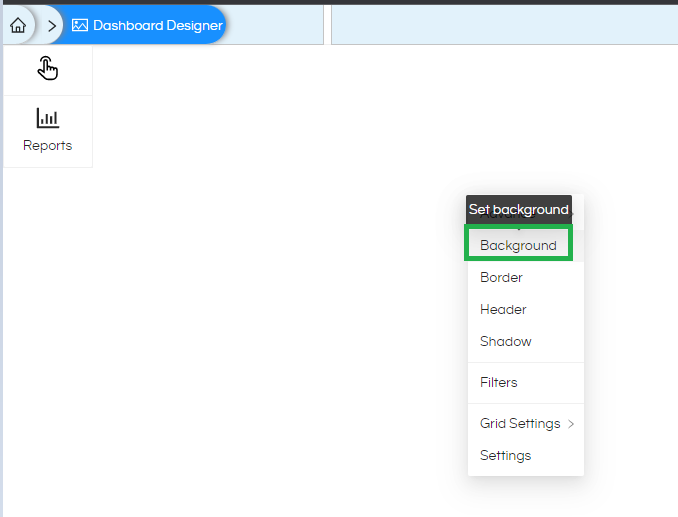
Background: The background option allows you to give a background to a component or to the entire dashboard. The background can be either a color or an image also. You can give color to the background by clicking on color and specifying the required color (while selecting the color you can use hex code or RGB A).

Right-Click Operations In Dashboard Designer

Right-Click Operations In Dashboard Designer

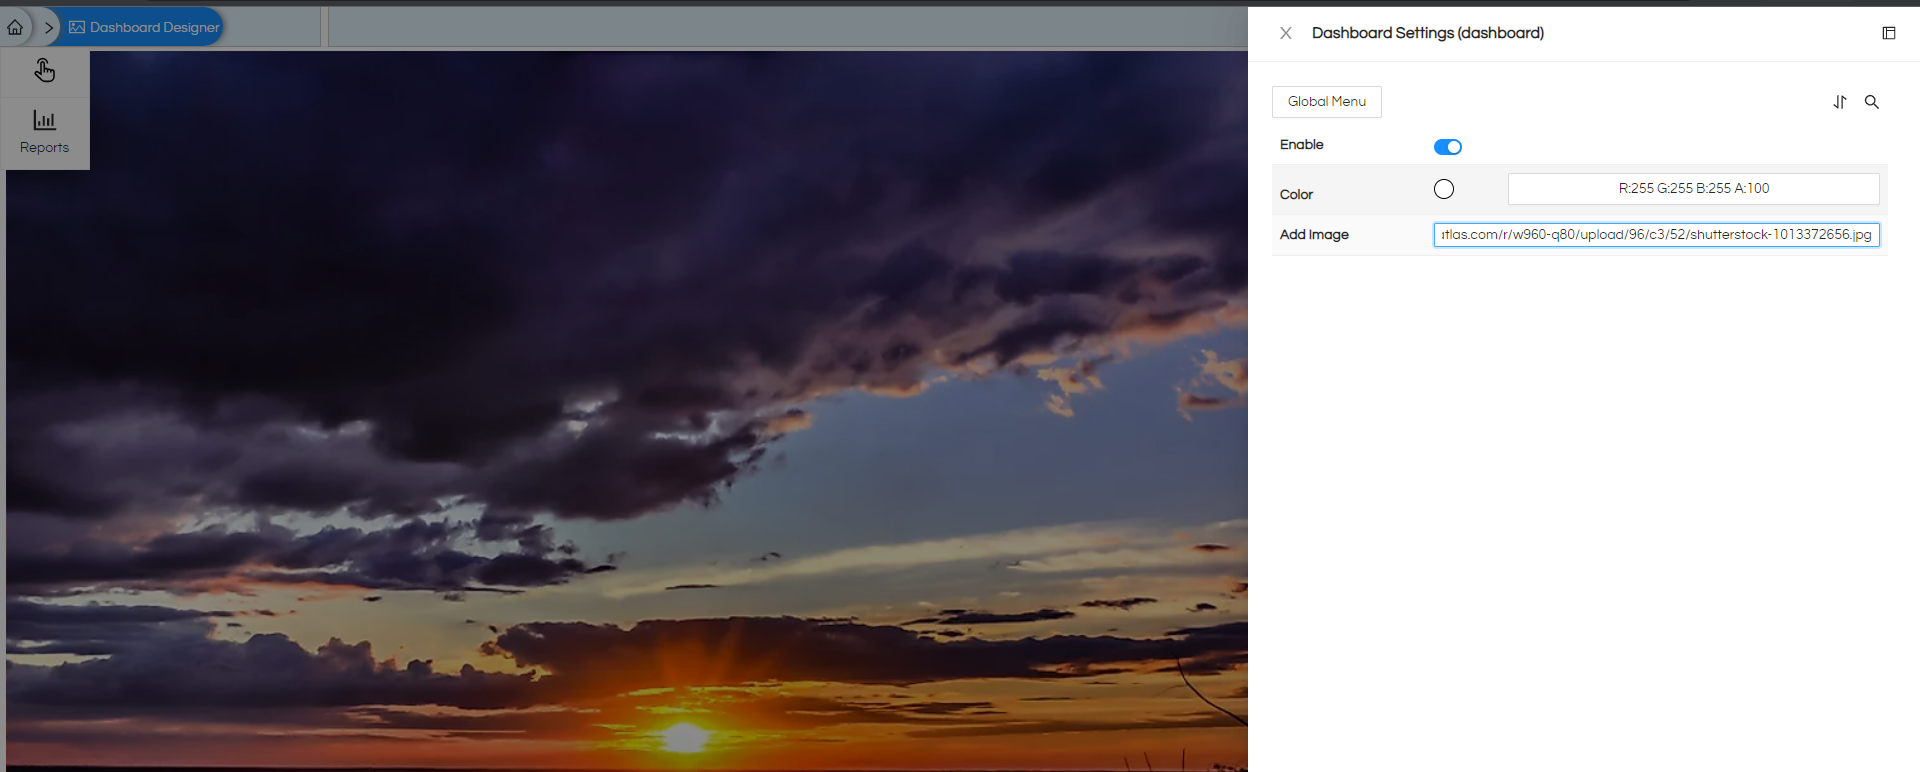
You can also give an image as a background. Provide the complete URL of the image (from the local server or internet) in the “Add Image” section

Right-Click Operations In Dashboard Designer

Right-Click Operations In Dashboard Designer

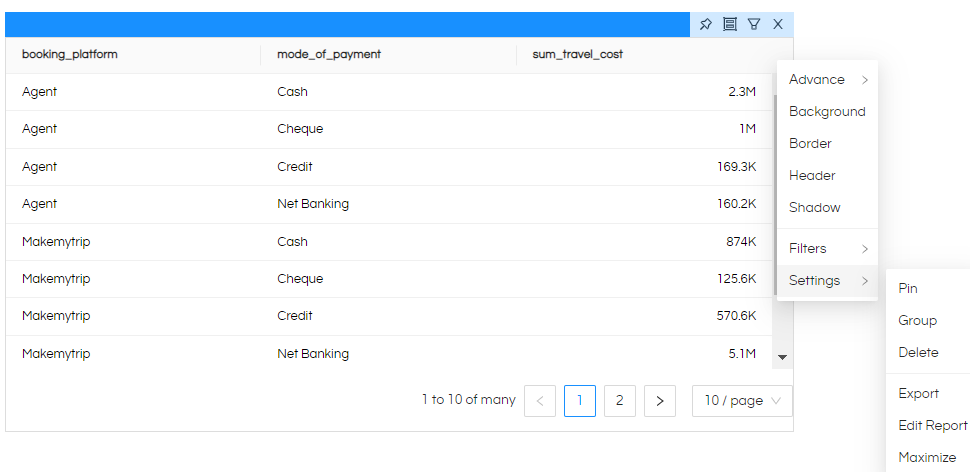
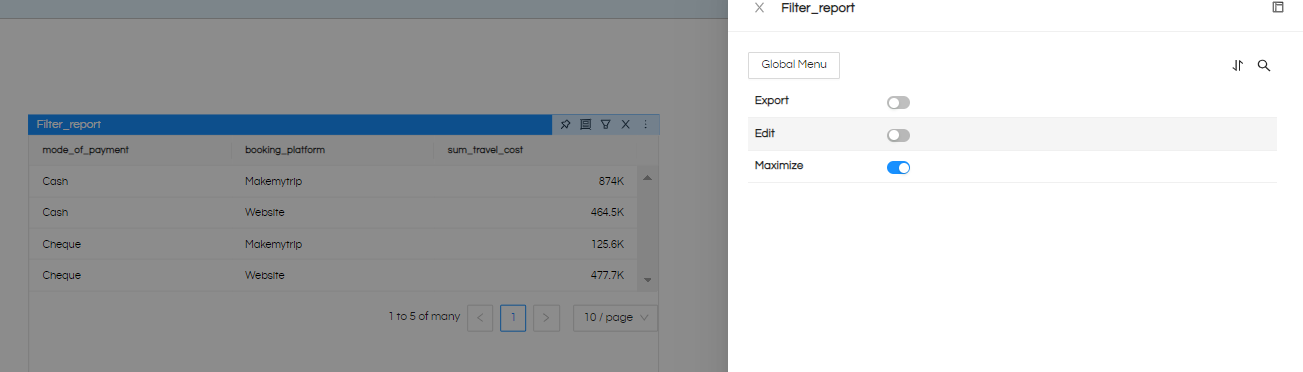
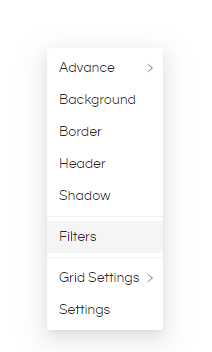
Settings: From version 5.0 onwards, on right-click on a report panel, you see the “Settings” option. On hover, you see the following options:

  • Pin: It pins the panel so that it does not move when other components are resized or repositioned. You can specify the size and fix a panel to a specific place and then pin it. So that while you align other components it will not affect this specific component’s position.
  • Delete: To remove the panel from the dashboard
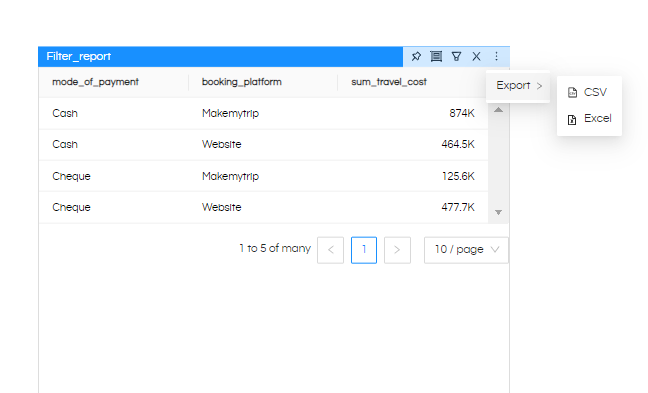
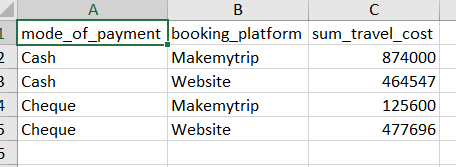
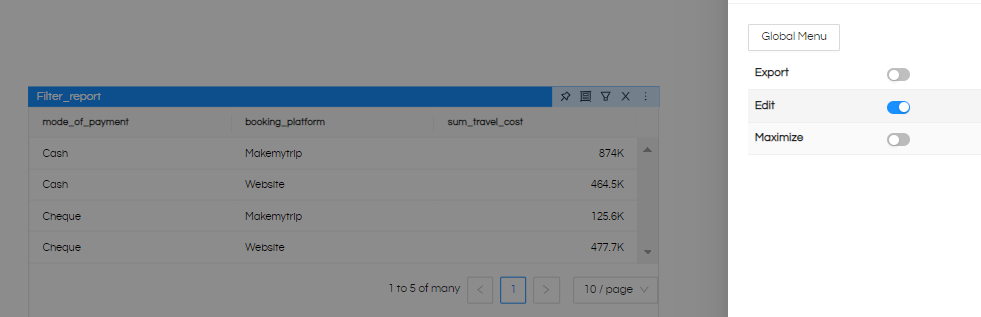
  • Export: Enable Exporting options for individual report panels when the dashboard is being viewed. Kebab menu (3 vertical dots) will appear on the top right corner of the report panel in open mode.
  • Right-Click Operations In Dashboard Designer

    Right-Click Operations In Dashboard Designer
    Right-Click Operations In Dashboard Designer

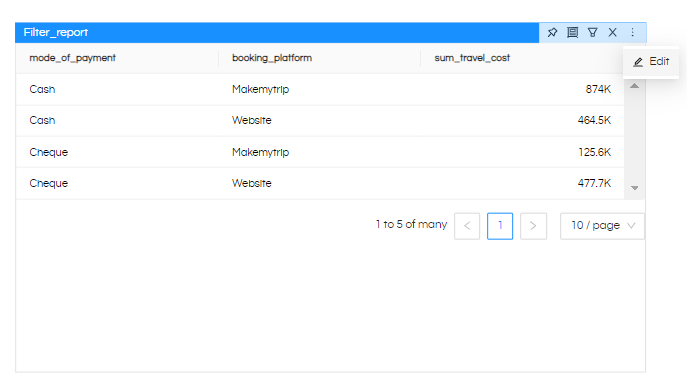
  • Edit Report: When this option is used an option called “Edit” is enabled, using which then the report can be opened in edit mode directly for making any report level changes. This option will work only when the user has got the required permission level to edit. If not, then the user will only view this report
  • Right-Click Operations In Dashboard Designer

    Right-Click Operations In Dashboard Designer

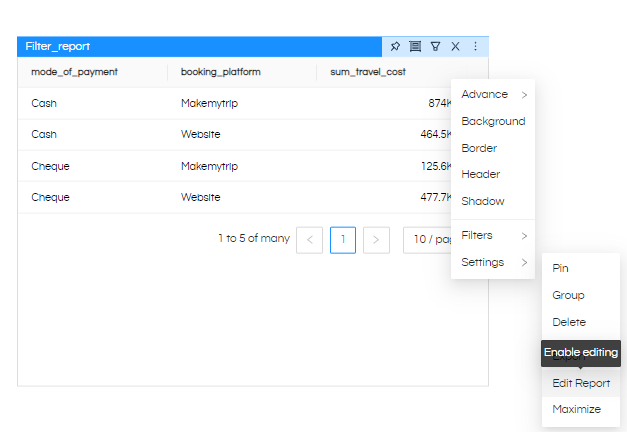
Click on 3 dots “Edit” now you can edit the Report by opening it in editor mode.

Right-Click Operations In Dashboard Designer

Right-Click Operations In Dashboard Designer

Maximize: To open the report in full screen

Right-Click Operations In Dashboard Designer

Right-Click Operations In Dashboard Designer

Right-Click Operations In Dashboard Designer

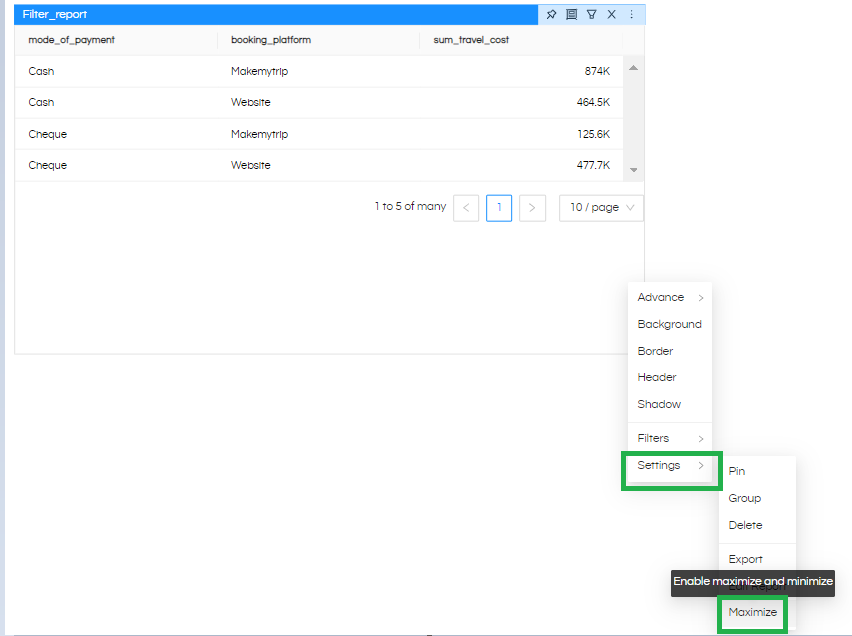
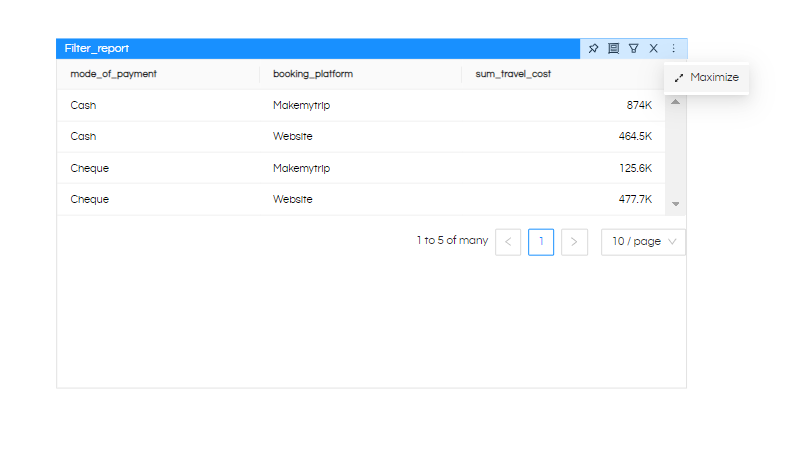
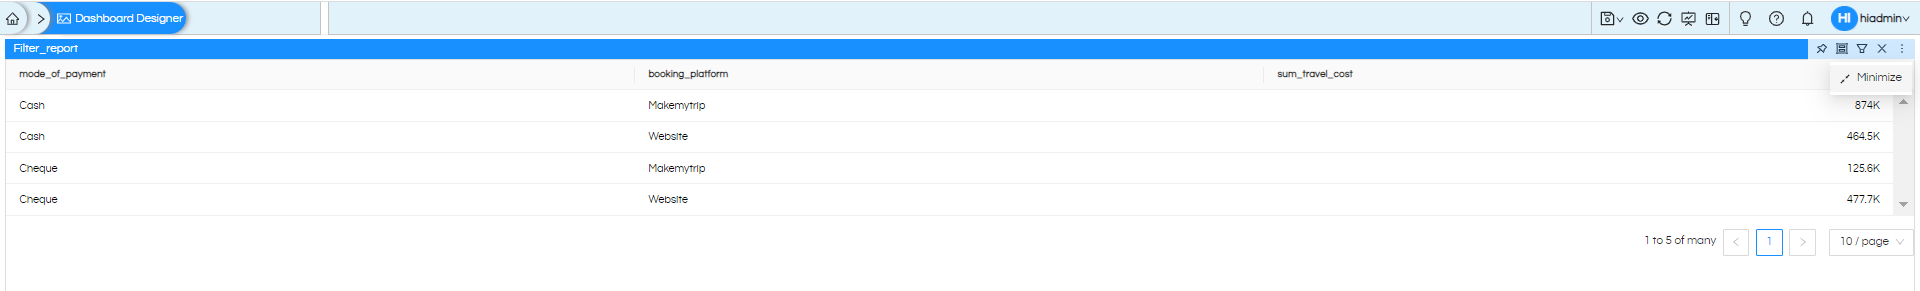
When you click on Maximize it will maximize the report, and in the maximized mode it will have an option to minimize also to return to the original view.

Right-Click Operations In Dashboard Designer

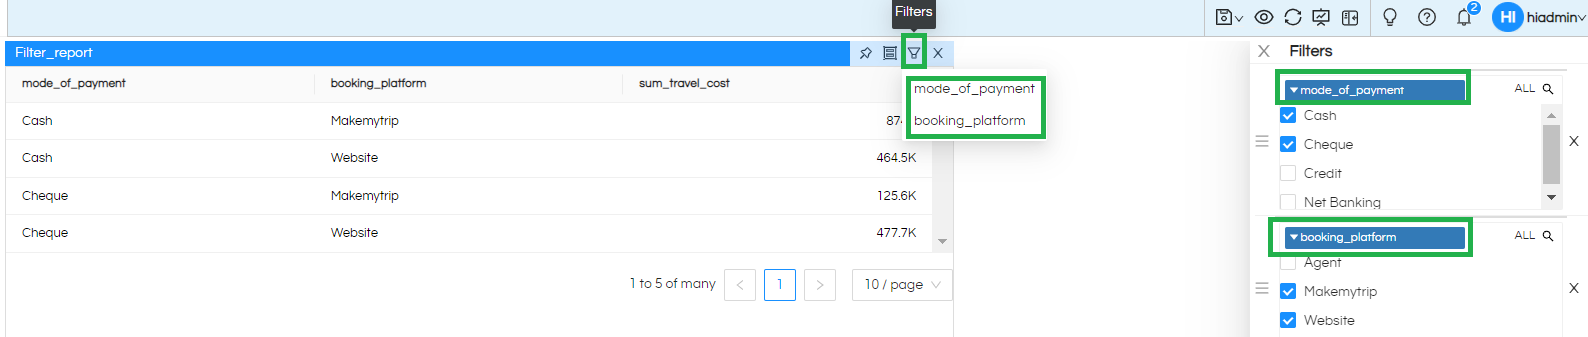
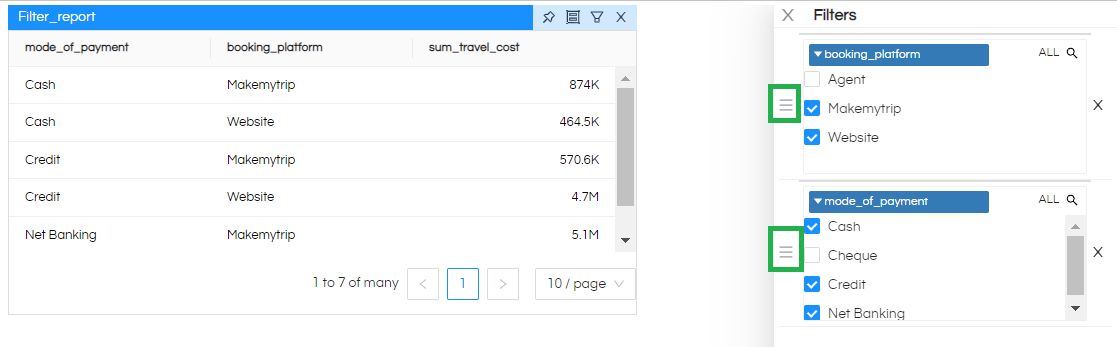
Filters: This option is added on right-click. When you hover on this option, you will find a list of filters that are present for the report.
Click on the filter name to add it to the dashboard..

You can use multiple filters like this.

Right-Click Operations In Dashboard Designer

You can use these 3 lines (Hamburger) to drag or swap the position of filters.

Right-Click Operations In Dashboard Designer

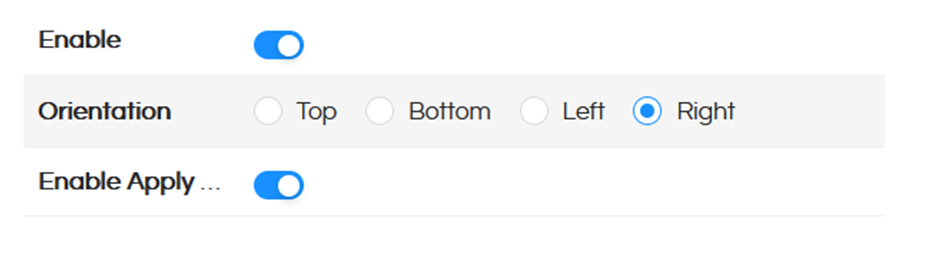
When you Right-click on the Dashboard and then click on the “Filter” option using this you can move the Filter position like (Top, Bottom, Left, Right)

Like this.

Right-Click Operations In Dashboard Designer

With these you can Enable/disable the filter option, enable / disable Apply button, specify the position of the filters in the webpage (like Top Bottom Left Right)

Right-Click Operations In Dashboard Designer

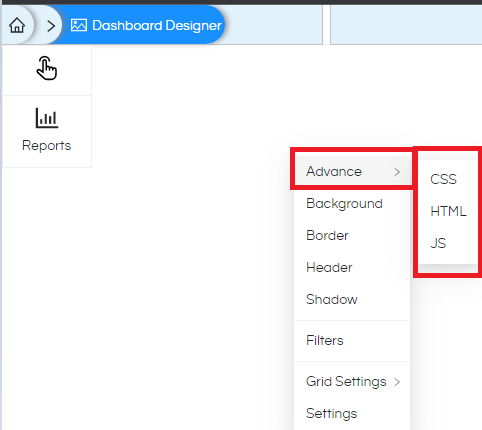
Advance: Helical Insight dashboard designer also allows you to inject your own code at the entire dashboard level or individual report level. On right-click, it has got HTML CSS JS options as well. Again, as mentioned earlier, on whichever component you right-click, the code will get applied to that specific component. Below we have covered examples of inserting code in a report component.

For example, below the image, you can see we have inserted text in bold via HTML code into the report

Right-Click Operations In Dashboard Designer

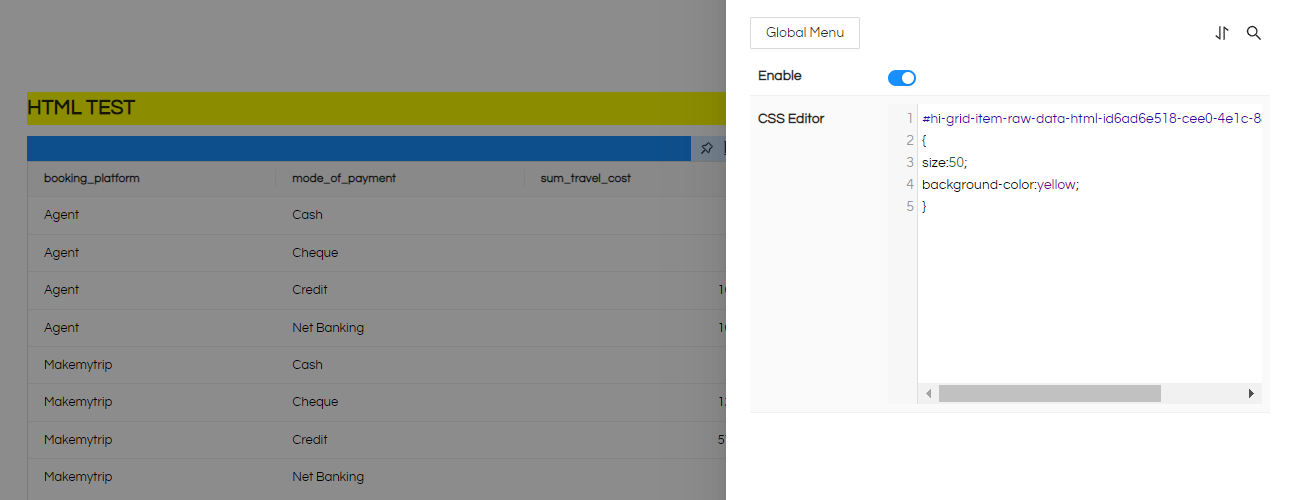
In the below image you can see that we have inserted a CSS code and given a background color to the component. The component id (on which we have right-clicked) is also mentioned in the popup box.

You can find divs, Ids, and HTML classes using the browser console (developer tools) inspect tool, then apply the required properties.

Right-Click Operations In Dashboard Designer

Grouping: Grouping allows you to make multiple components and make them part of one group.

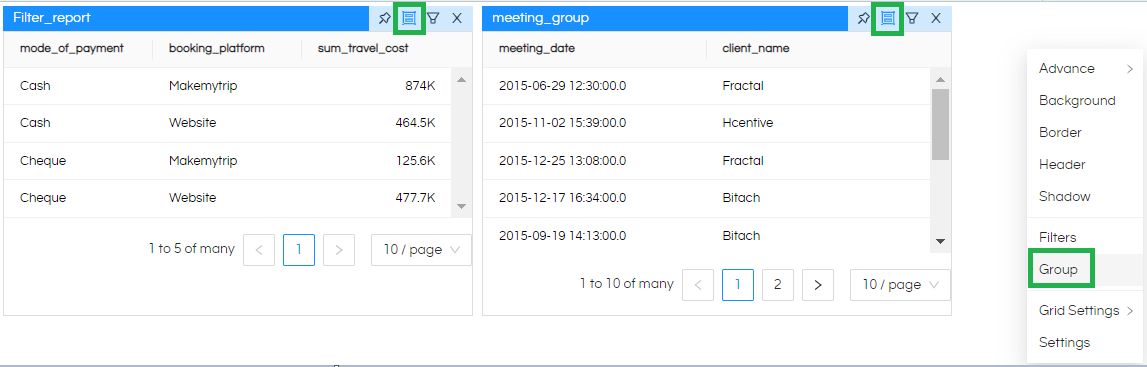
While creating a group you can select 2 or more reports/components like this and then click on the selected Group icon (which appears when we right click on dashboard designer page). Then automatically those reports will appear within a single group.

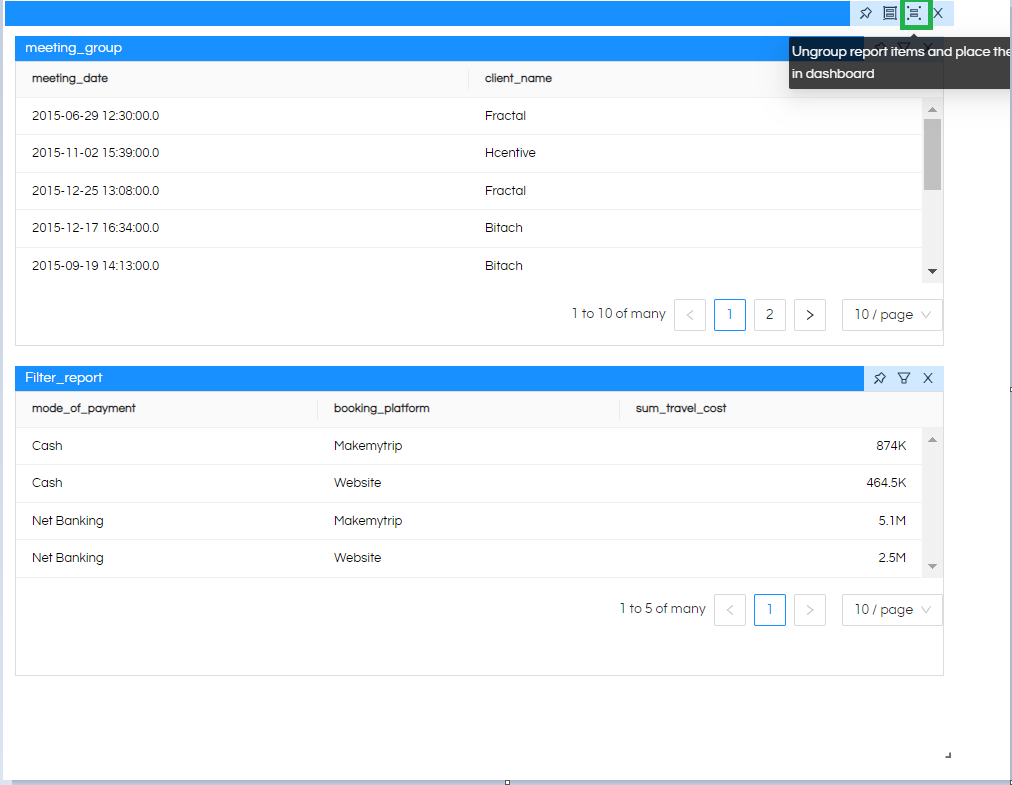
As you can see here these reports are now Grouped. You can simply resize the reports within that. You can also pin the components with the group, or pin the group also all together while doing resizing.

Right-Click Operations In Dashboard Designer

You can add a panel to the already existing group like this. Select another report which you want to add in a group (tag this item for grouping) and tag the group also in which it should added. Then right click on dashboarddesigner and click on “Group” feature (refer image below).

Right-Click Operations In Dashboard Designer

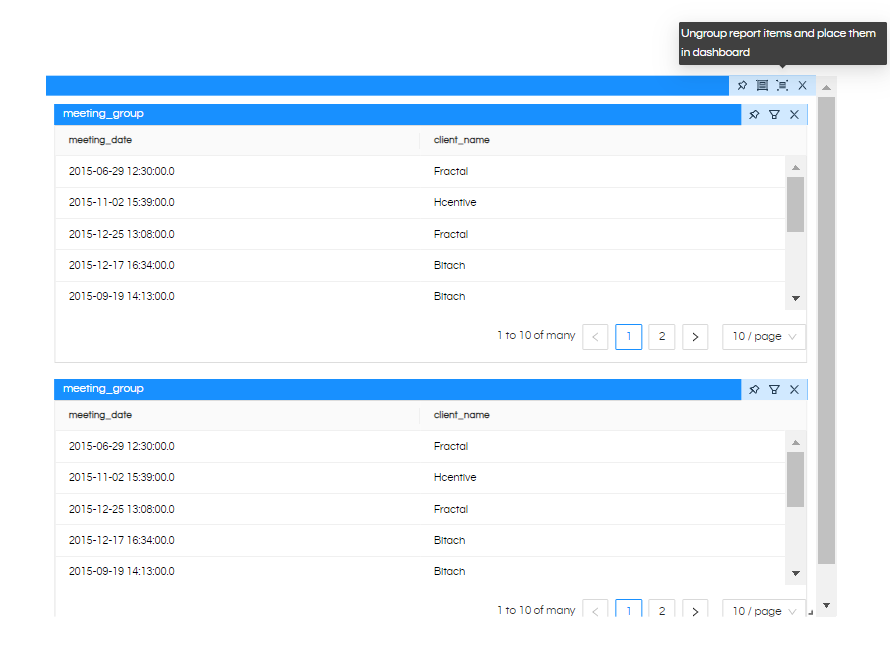
Using the below icon “Ungroup” you can remove item from a group like shown below.

Right-Click Operations In Dashboard Designer

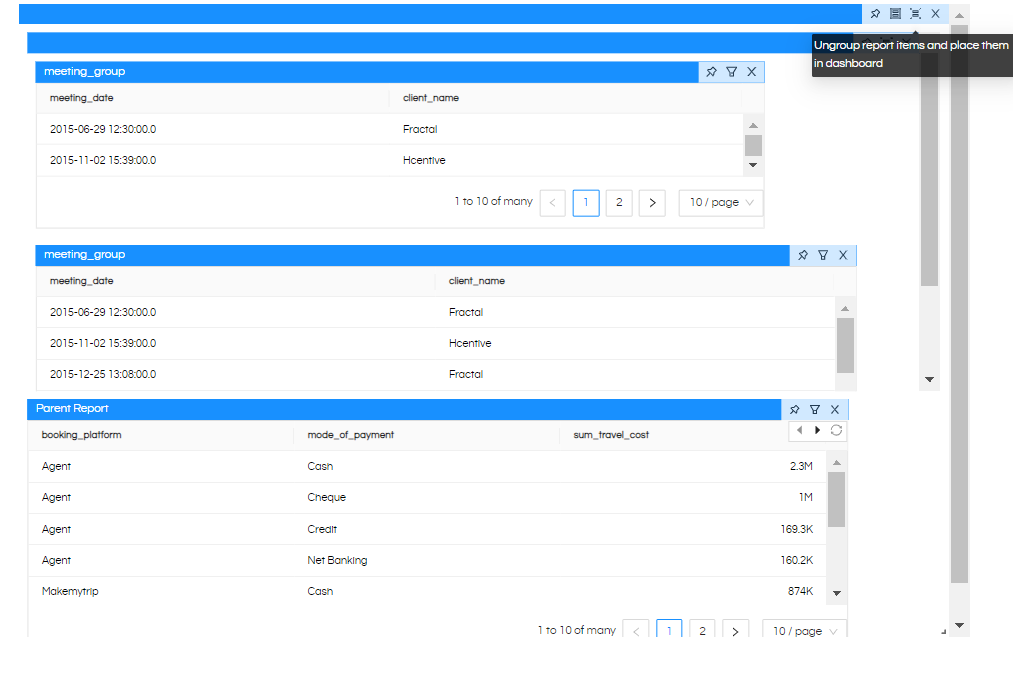
If you hover over the group, you can “delete” the entire group, and using “ungroup” you can simply ungroup the components from the group.

Right-Click Operations In Dashboard Designer

Thank You,
Helical Insight

Helical Insight’s self-service capabilities is one to reckon with. It allows you to simply drag and drop columns, add filters, apply aggregate functions if required, and create reports and dashboards on the fly. For advanced users, the self-service component has ability to add javascript, HTML, HTML5, CSS, CSS3 and AJAX. These customizations allow you to create dynamic reports and dashboards. You can also add new charts inside the self-service component, add new kind of aggregate functions and customize it using our APIs.
Helical Insight, via simple browser based interface of Canned Reporting module, also allows to create pixel perfect printer friendly document kind of reports also like Invoice, P&L Statement, Balance sheet etc.
If you have a product, built on any platform like Dot Net or Java or PHP or Ruby, you can easily embed Helical Insight within it using iFrames or webservices, for quick value add through instant visualization of data.
Being a 100% browser-based BI tool, you can connect with your database and analyse across any location and device. There is no need to download or install heavy memory-consuming developer tools – All you need is a Browser application! We are battle-tested on most of the commonly used browsers.
We have organization level security where the Superadmin can create, delete and modify roles. Dashboards and reports can be added to that organization. This ensures multitenancy.
A first-of-its-kind Open-Source BI framework, Helical Insight is completely API-driven. This allows you to add functionalities, including but not limited to adding a new exporting type, new datasource type, core functionality expansion, new charting in adhoc etc., at any place whenever you wish, using your own in-house developers.
It handles huge volumes of data effectively. Caching, Pagination, Load-Balancing and In-Memory not only provides you with amazing experience, but also and does not burden the database server more than required. Further effective use of computing power gives best performance and complex calculations even on the big data even with smaller machines for your personal use. Filtering, Sorting, Cube Analysis, Inter Panel Communication on the dashboards all at lightning speed. Thereby, making best open-source Business Intelligence solution in the market.
With advance NLP algorithm, business users simply ask questions like, “show me sales of last quarter”, “average monthly sales of my products”. Let the application give the power to users without knowledge of query language or underlying data architecture
Our application is compatible with almost all databases, be it RDBMS, or columnar database, or even flat files like spreadsheets or csv files. You can even connect to your own custom database via JDBC connection. Further, our database connection can be switched dynamically based on logged in users or its organization or other parameters. So, all your clients can use the same reports and dashboards without worrying about any data security breech.
Our application can be installed on an in-house server where you have full control of your data and its security. Or on cloud where it is accessible to larger audience without overheads and maintenance of the servers. One solution that works for all.
Different companies have different business processes that the existing BI tools do not encompass. Helical Insight permits you to design your own workflows and specify what functional module of BI gets triggered