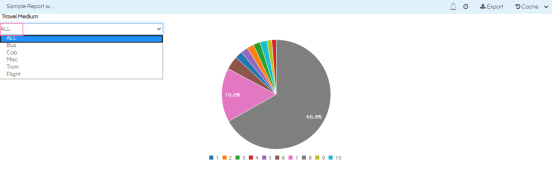
Introduction : There might be certain reports/dashboards wherein we would also need “ALL” as one of the input values, so when ALL is selected the entire data will be shown and then further use can further select any specific value. This ALL can be preset in both single select and multiple select input parameters. In this blog we are going to explain how to set ‘ALL’ as default parameter in Community Edition Reports. Here we are creating a sample report which shows travel cost medium wise.
Please make sure you have gone through the blog “Introduction to Community Reporting Interface”
Steps to create pie chart by setting ‘ALL’ as default parameter
- Data Source
- Dashboard Layout
- Parameter
- Report
- Data source :
- Dashboard Layout :
- Parameters :
- Report :
Create data source connection. Here we are using connection type : managed
In the configuration of data source, provide the details as shown below.
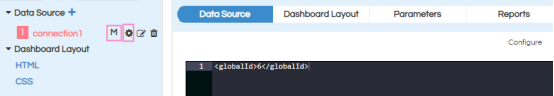
Note : You can choose other kind of data sources. The rest of the steps are the same as others.
In the dashboard layout we basically specify the layout of the reports, dashboards and input parameters which we are creating. All the divs are specified here within which they get rendered.
Here we are creating 2 divs: travel_medium, report
Input Parameter div is: travel_medium
Report div is: report
When you click on dashboard layout a layout similar to below will appear:
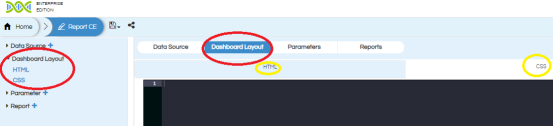
In the above screen shot we find two options (left side)
HTML and CSS .
If you click on HTML/CSS the place holder for respective component will be displayed and highlighted in the Dashboard layout panel.
We can place the code related to HTML, CSS for dashboard layout and styling.
Dashboard layout:
HTML :
<div class="row">
<h4 id="heading"><b>Travel Medium</b></h4>
<div id="travel_medium"> Travel Medium </div>
</div>
<div id="report"></div>
CSS:
#travel_medium{

width :30%
}
#heading{
 padding-left :20px;
}
Parameter are used to filter the report data. These parameters can be single select, multiple select, date range, slider, data picker etc. We can create multiple parameters for the single report/dashboard.
When you click on add button, the parameter is created with default name parameter1. We can rename the parameter name with the help of edit icon and keep as “travel_medium”
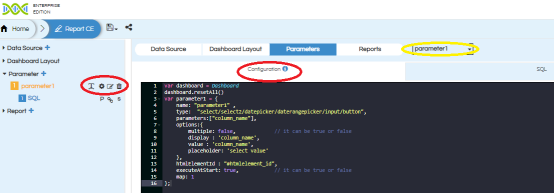
We should place the code for Parameter configuration, parameter query in their respective place holders.
Click on apply button to save all the configurations.
Choose ‘connection’for parameter.
In this sample we are creating single select parameter named “travel_medium”
Note : If we use parameter type :select or select2 then only we should use setting default ALL configuration for parameter.
travel_medium : (single select)
Choose connection as “connection1”(previously created in data sources)
Here “travel_medium” is single-select input control, so we need to choose input type as “String” as shown in below image. By default it is always “String”.
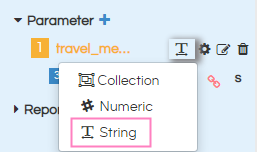
Note : For all multi select parameters we should select “Collection” irrespective of parameter datatype. If it is single select parameter we choose the type based on datatype of parameters.
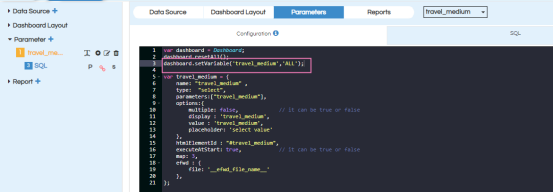
So please note that here we have set the defualt input parameter value as ALL by using the syntax dashboard.setVariable.
Configuration :
var dashboard = Dashboard;
dashboard.resetAll();
dashboard.setVariable('travel_medium','ALL');

var travel_medium = {
    name: "travel_medium" ,
    type:  "select",
    parameters:["travel_medium"],
    options:{
        multiple: false,             // it can be true or false
        display : 'travel_medium',
        value : 'travel_medium',
        placeholder: 'select value'
    },
    htmlElementId : "#travel_medium",
    executeAtStart: true,            // it can be true or false
    map: 3,
    efwd : {
        file: '__efwd_file_name__'
    },
};
SQL :
Note: We need to include “ALL”as a value to the parameter list using below syntax.
select 'ALL' as travel_medium
union
select distinct travel_medium from travel_details
Note: If you do not have any parameters please make sure that you will have to add below code in the “Report”configuration as shown in below.
var dashboard = Dashboard;
dashboard.resetAll();
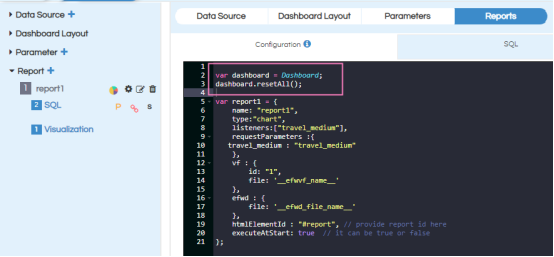
In case if you delete first parameter then also you need to provide above code in “Report” configuration.
We can configure different visualizations to render in different divs in the dashboard layout.
When click on add report button, the layout will appear as show below :
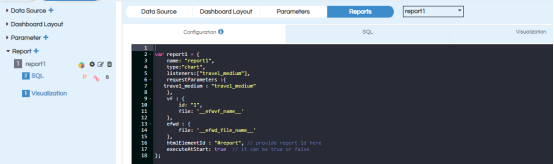
In the left panel we find report, SQL, Visualization related options.
Click on configure, on the right side we can see the place holders for report configuration, SQL, Visualization. Place the respected code apply click on apply.
Here we need to choose chart type as “Pie” , connection as “connection1” and parameter (travel_medium ).
Report Configuration :
var report1 = {
    name: "report1",
    type:"chart",
    listeners:["travel_medium"],
    requestParameters :{
   travel_medium : "travel_medium"
    },
    vf : {
        id: "1",
        file: '__efwvf_name__'
    },
    efwd : {
        file: '__efwd_file_name__'
    },
    htmlElementId : "#report", // provide report id here
    executeAtStart: true  // it can be true or false
};
SQL :
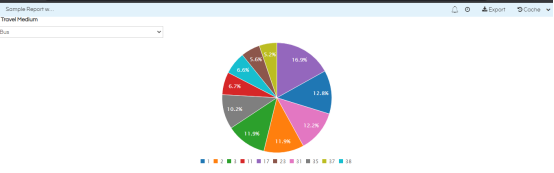
select * from travel_details where (travel_medium = ${travel_medium} or 'ALL'=${travel_medium}) limit 10
Note : Whenever user selects ALL value in the parameter, the where condition will be eliminated because of ör”clause present in SQL and hence the report will show all the data without applying any filter value.
Visualization :
<Dimensions>travel_medium</Dimensions>
<Measures>travel_cost</Measures>
Note: After placing the configuration , SQL , Visualization then click on apply or (control+s)
After completing all the steps save the community edition report :
In the back end server location the following files will be generated
- Efw (report view in the front end)
- Efwce (editable file in the front end)
- Efwvf
- Html
- Efwd
In the front end file browser we can see the below file types:
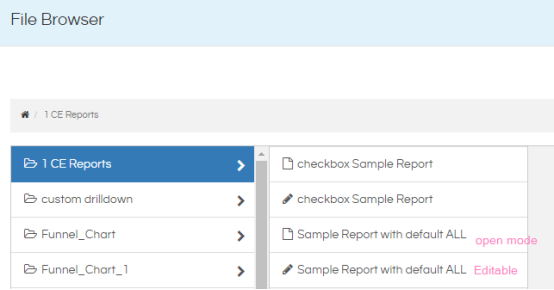
We should right click on the report view file (with the extension efw) choose open in new window then report opens like below. The other file with the extension EFWCE can be used to edit the created report/dashboard again.
Report view with open in new window :
For more details on EFWCE reporting refer the documentation :
EFWCE method of reporting in Helical Insight
For further assistance, kindly contact us on support@helicalinsight.com or post your queries at forum.helicalinsight.com
