In this blog, we are going to learn how to use Crosstab or pivot kind of chart within Open Source BI product Helical Insight.
Generally, the output of SQL in a tabular format is not very optimal information to understand and put to use. If we are dealing with textual information we need to represent information from one column against another column to have a comparative analysis. CrossTab visualization is designed for that purpose.
Basic CrossTab
Let us drag the fields booking_platform and total_cost into either the Columns or Rows section and then select CrossTab from the Visualization panel on the right. (Note: A Crosstab requires at least one measure and one dimension to be generated.)
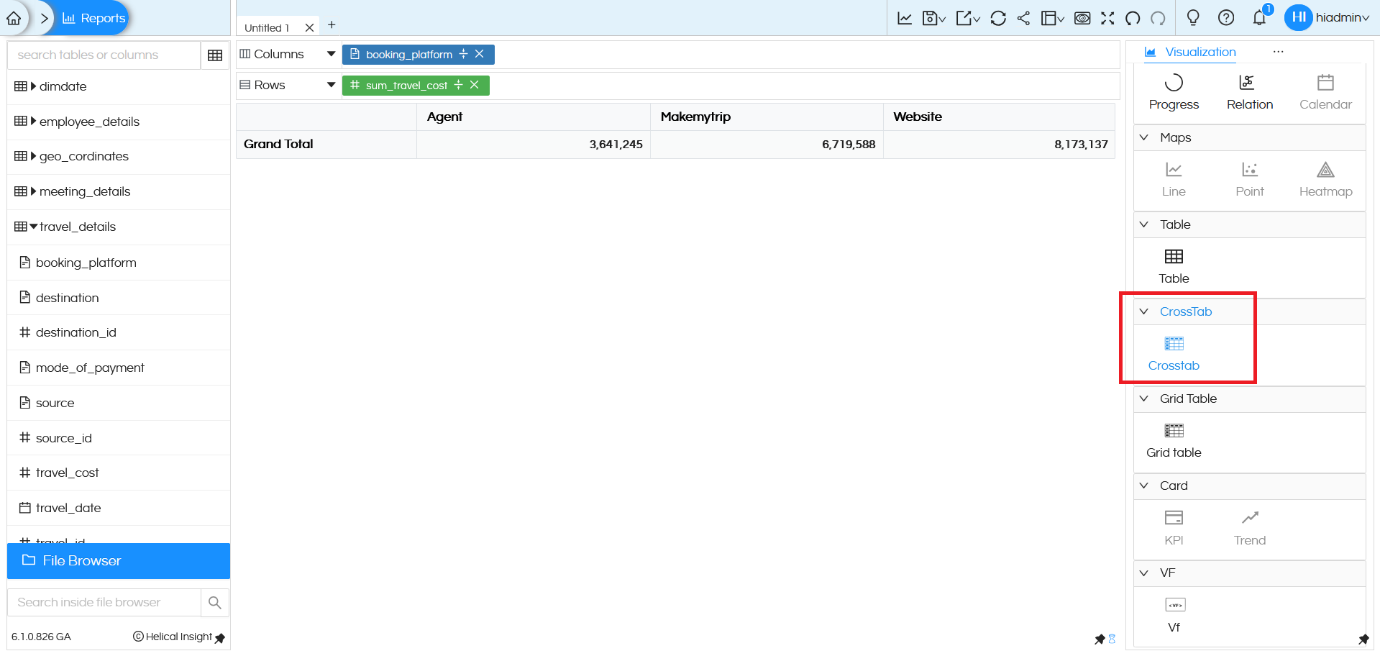
You get the result as shown above.
Always Aggregation
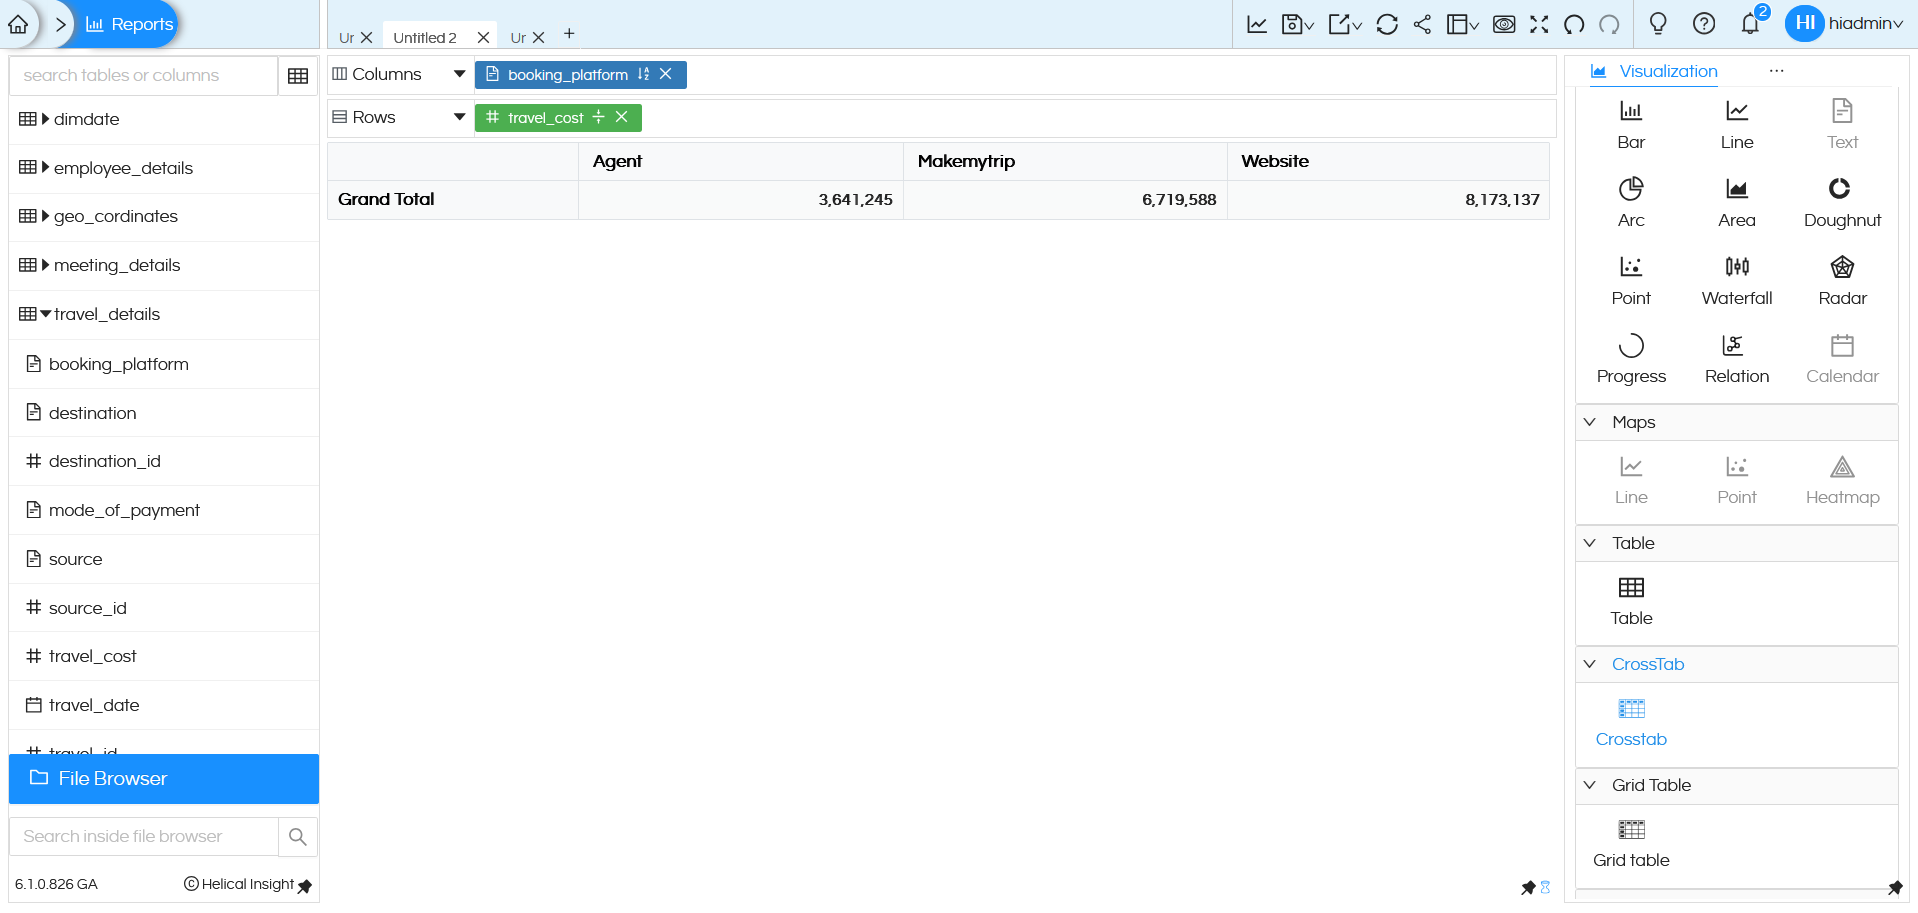
By default, the value we drag to Columns / Rows is always aggregated. All numeric columns (measures) are aggregated as sum, and non-numeric columns are group by.
Remove both the SUM aggregation from travel_cost and the Group By option from booking_platform, then generate the report again. You will notice that the output remains unchanged.
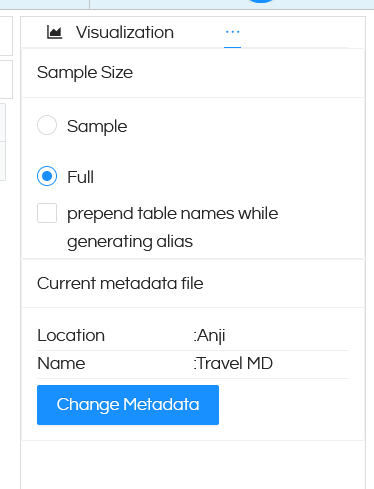
Note that when we do not apply Aggregation and GroupBy at the dragged column level, by default the GroupBy and Aggregation (sum) will happen at the chart level, which can cause slowness and performance issues and hence not advisable. In case if you are removing GroupBy and Aggregation, also please make sure that you remove Sample Size restriction from Settings placeholder and make it full to ensure that the data is correct.
Multiple fields
This chart is best when used with multiple level of dimensions where we need to analyze information across multiple factors. Let us drag booking_platform into Columns and mode_of_payment into Rows along with sum of total_cost (in either Rows / Columns) and generate the report.
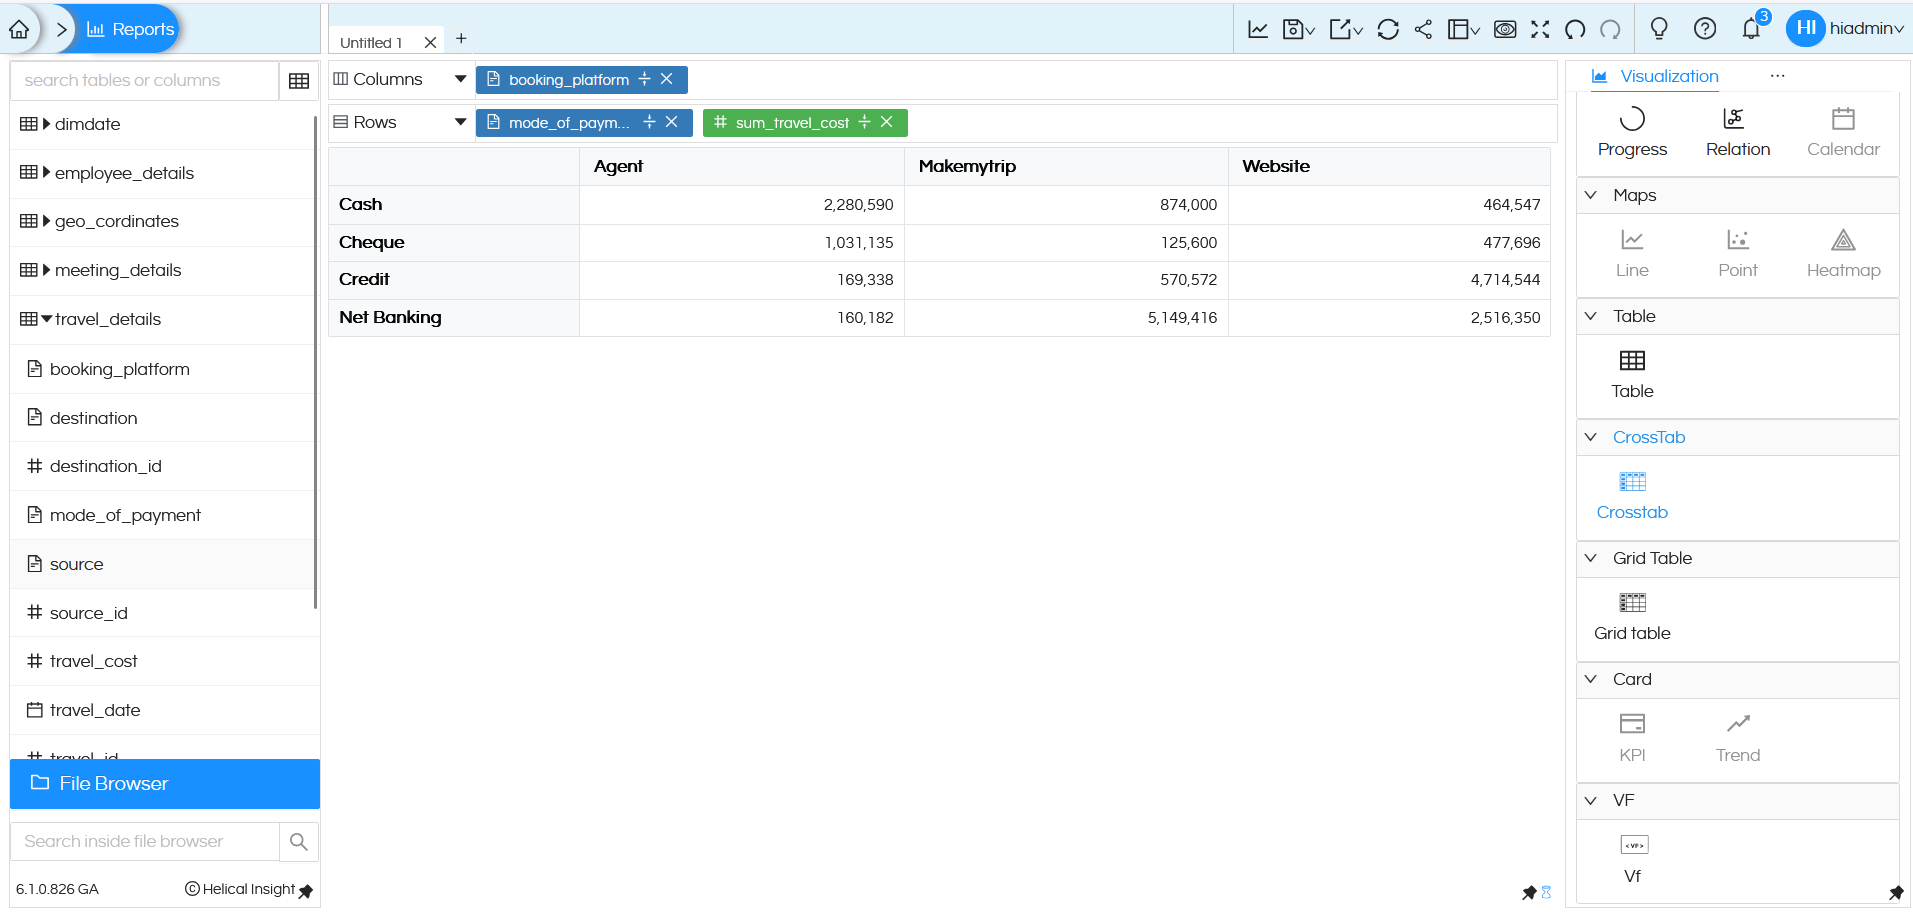
You will see the split of total_cost of travel per booking_platform , per mode_of_payment. What dimension you drag in column forms the column of crosstab, whatever dimension you drag in rows forms the rows of the crosstab and measures forms the values section.
Crosstab visualization is not limited to just one dimension on Columns / Rows / measures. You can add up couple of more dimensions and another measure to the mix (as per your needs) and generate the report
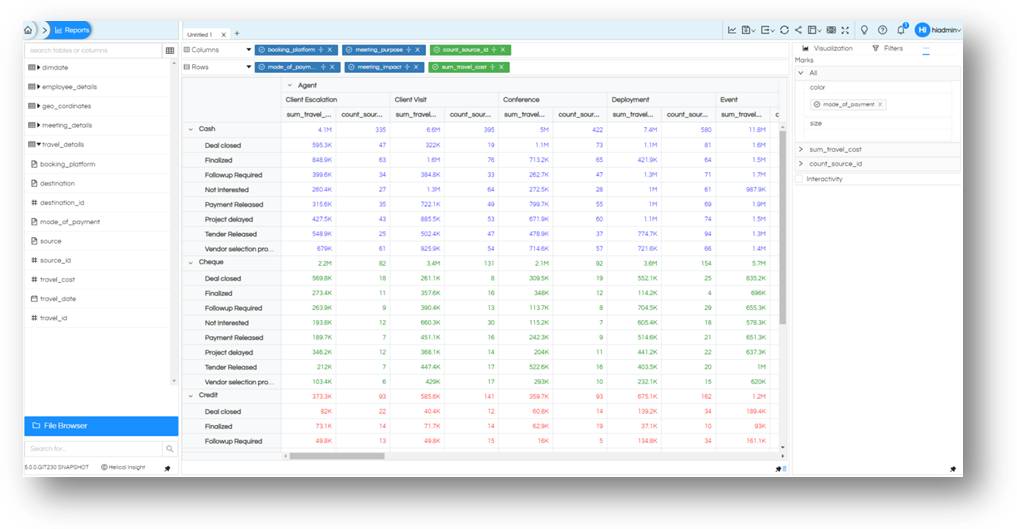
We have added meeting_purpose and meeting_impact as dimension and count of source_id as a measure.
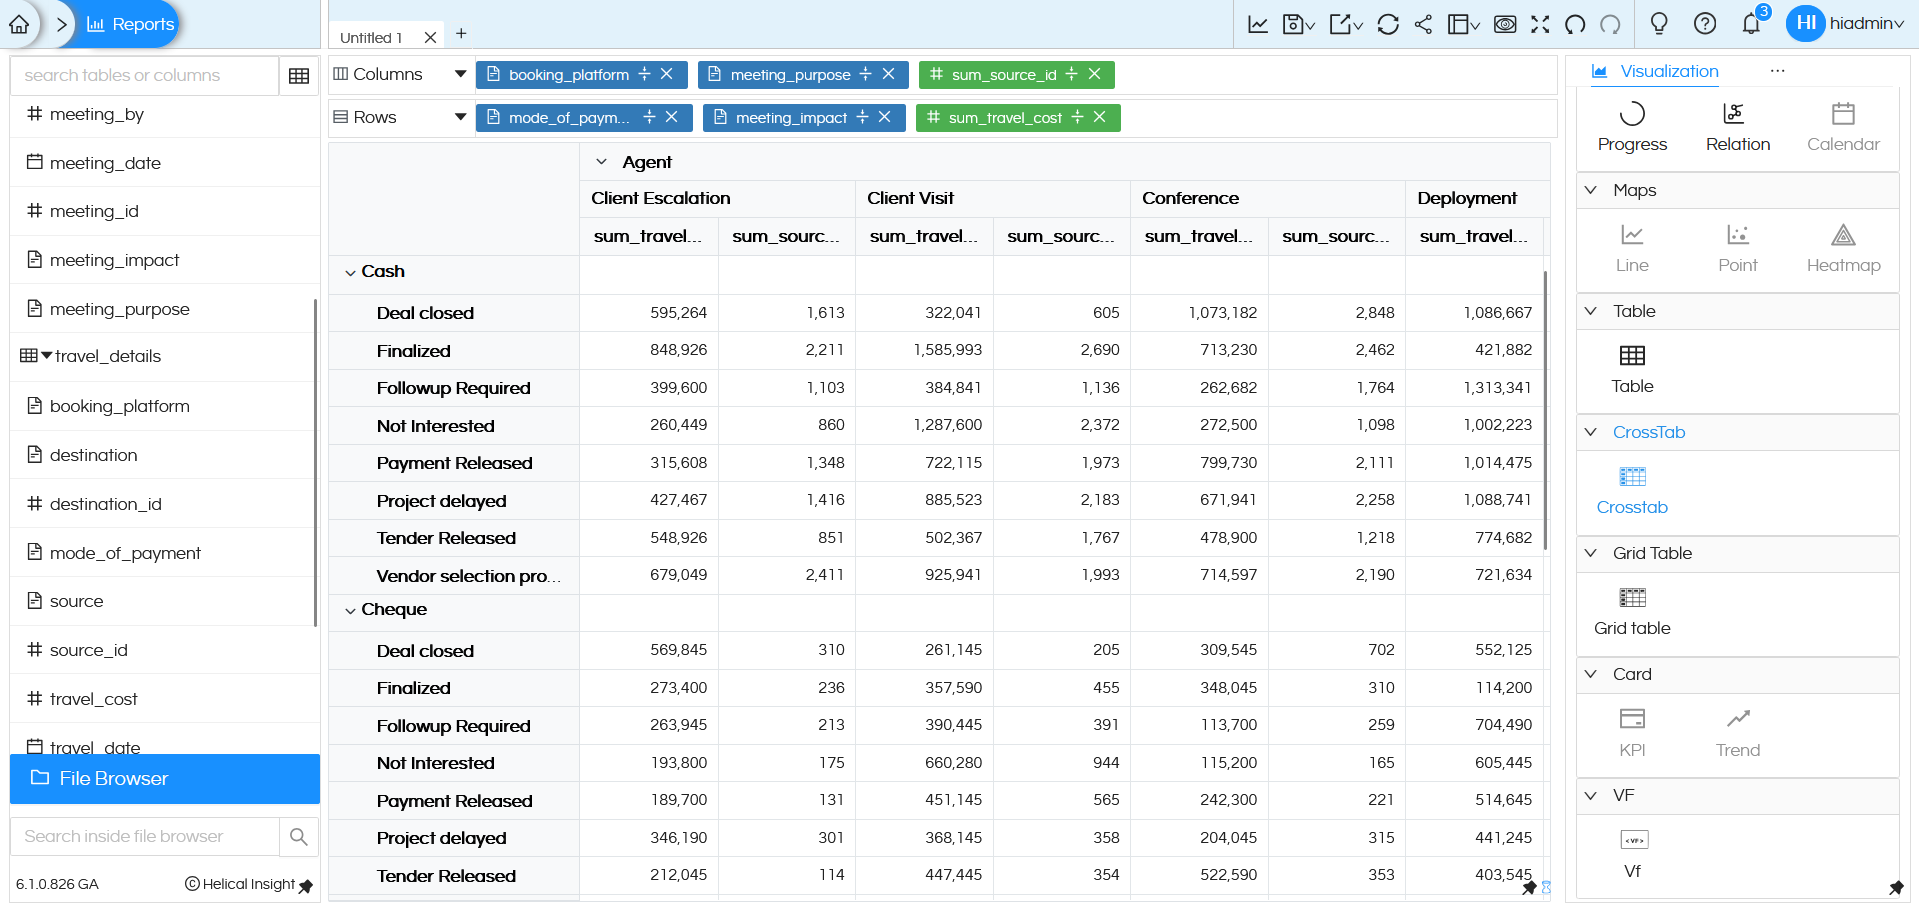
You will see that we have split of the measures as per the dimension. Both the measures are running as two columns, and the dimensions are nested as per the sequence in Columns or Rows respectively.
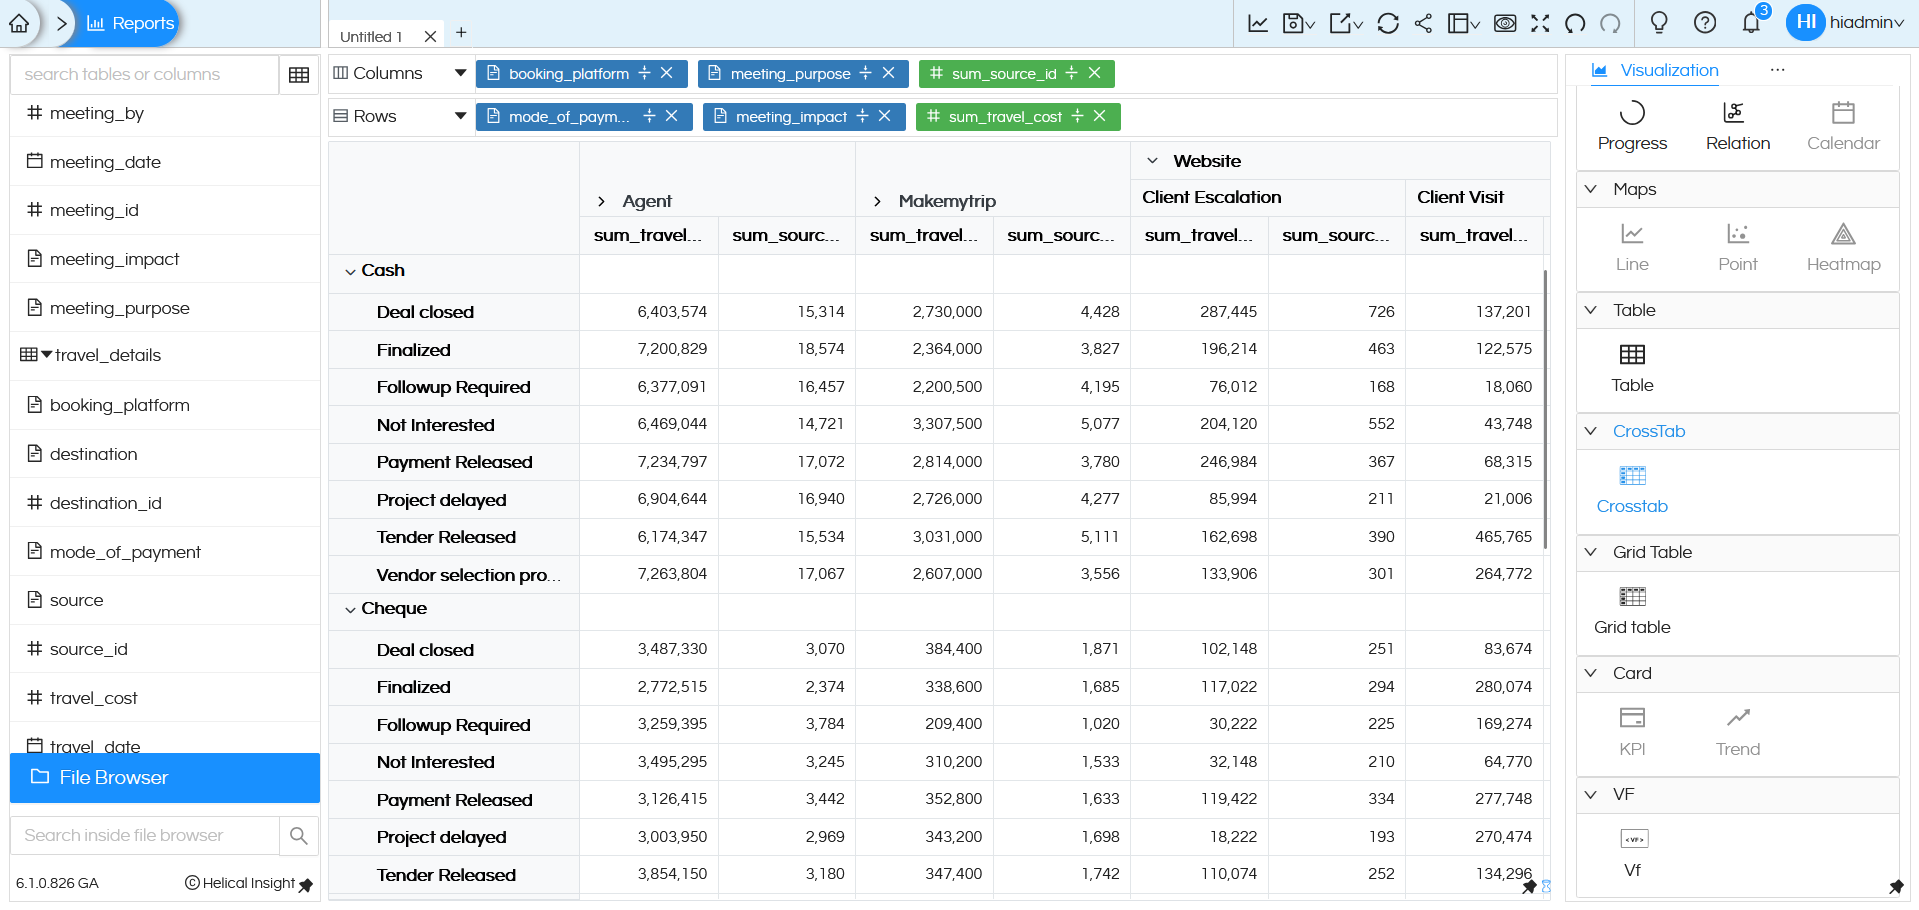
Once you are on the chart, you can also collapse the outer dimension and see the sum of all values inside it.
Marks
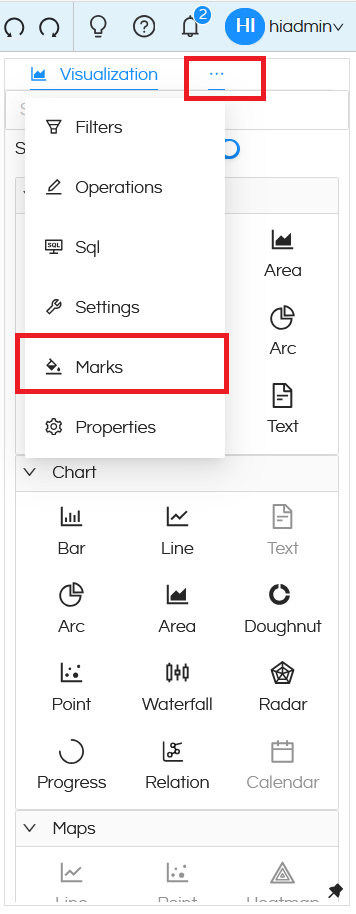
Based on your screen size on the panel to right there are more options to this Visualization. If you do not see ‘Marks’ on the list, you may click on the meatball icon and select ‘Marks’.
Just like table we have option to customize other aspects using Marks like colour or size.
Let us use mode_of_payment for color and generate the report again.
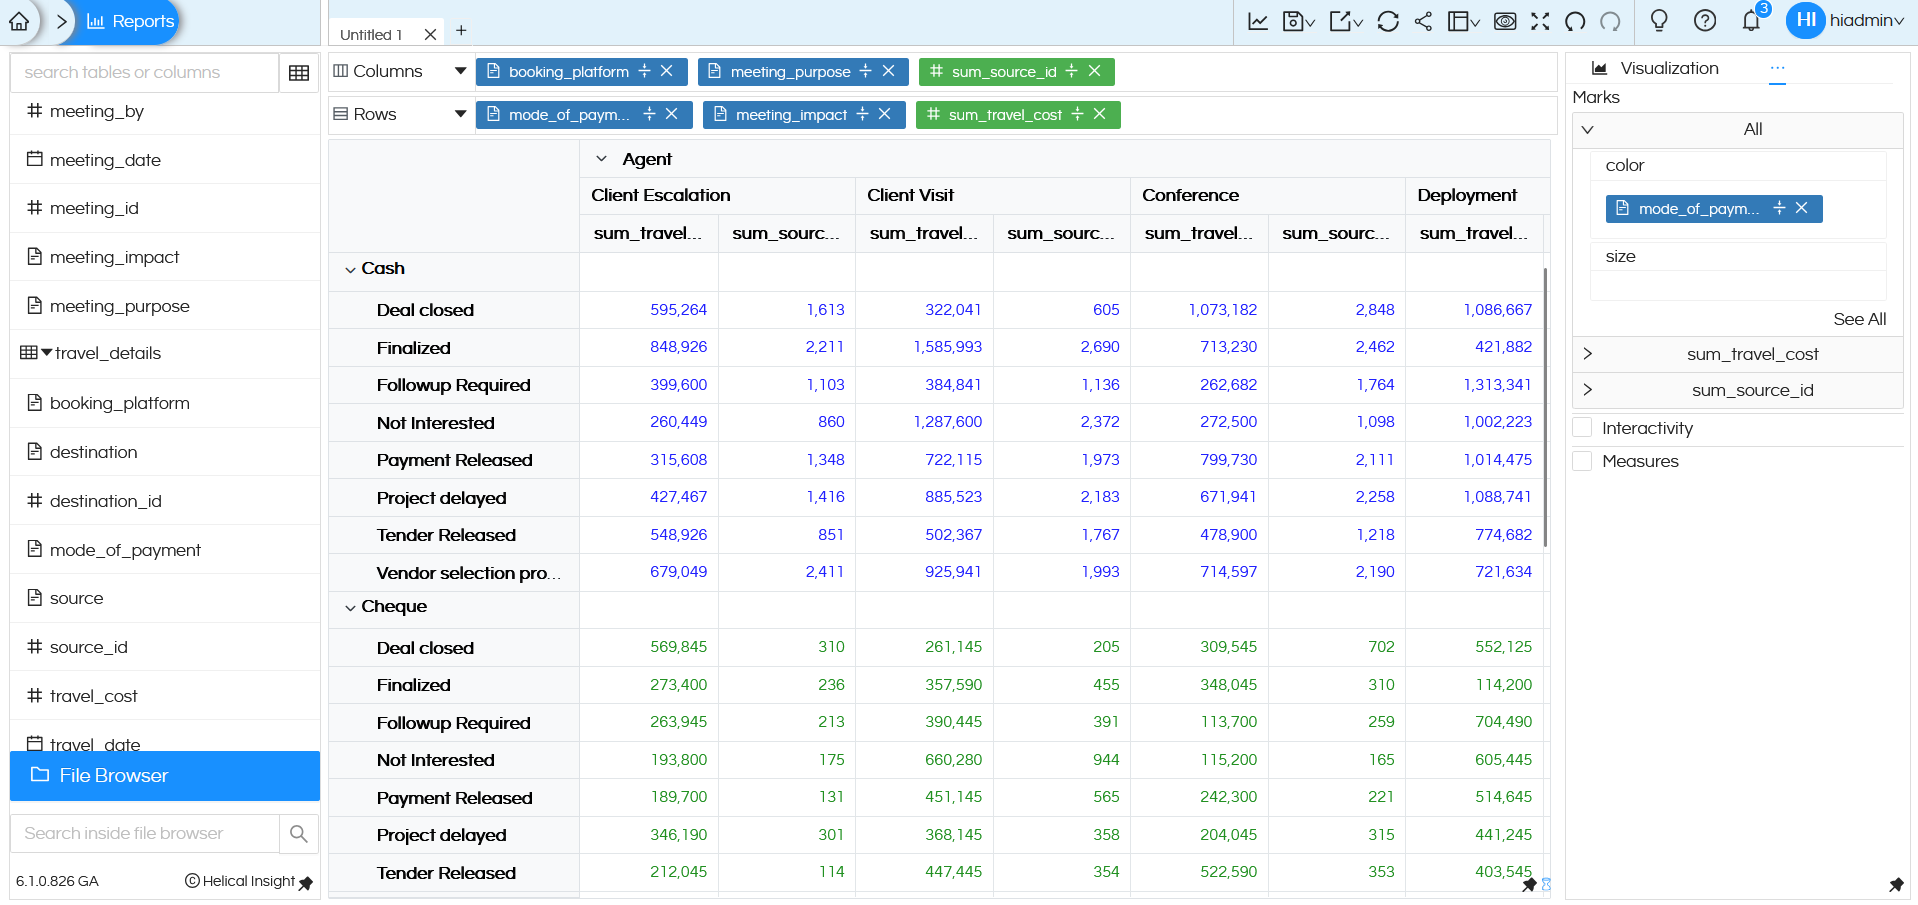
Similarly, the size of text can be controlled the same way, let us add travel_cost to size. In both colors and size right now we have dragged dimensions, in any of them you can drag dimensions or measures based on the requirement.
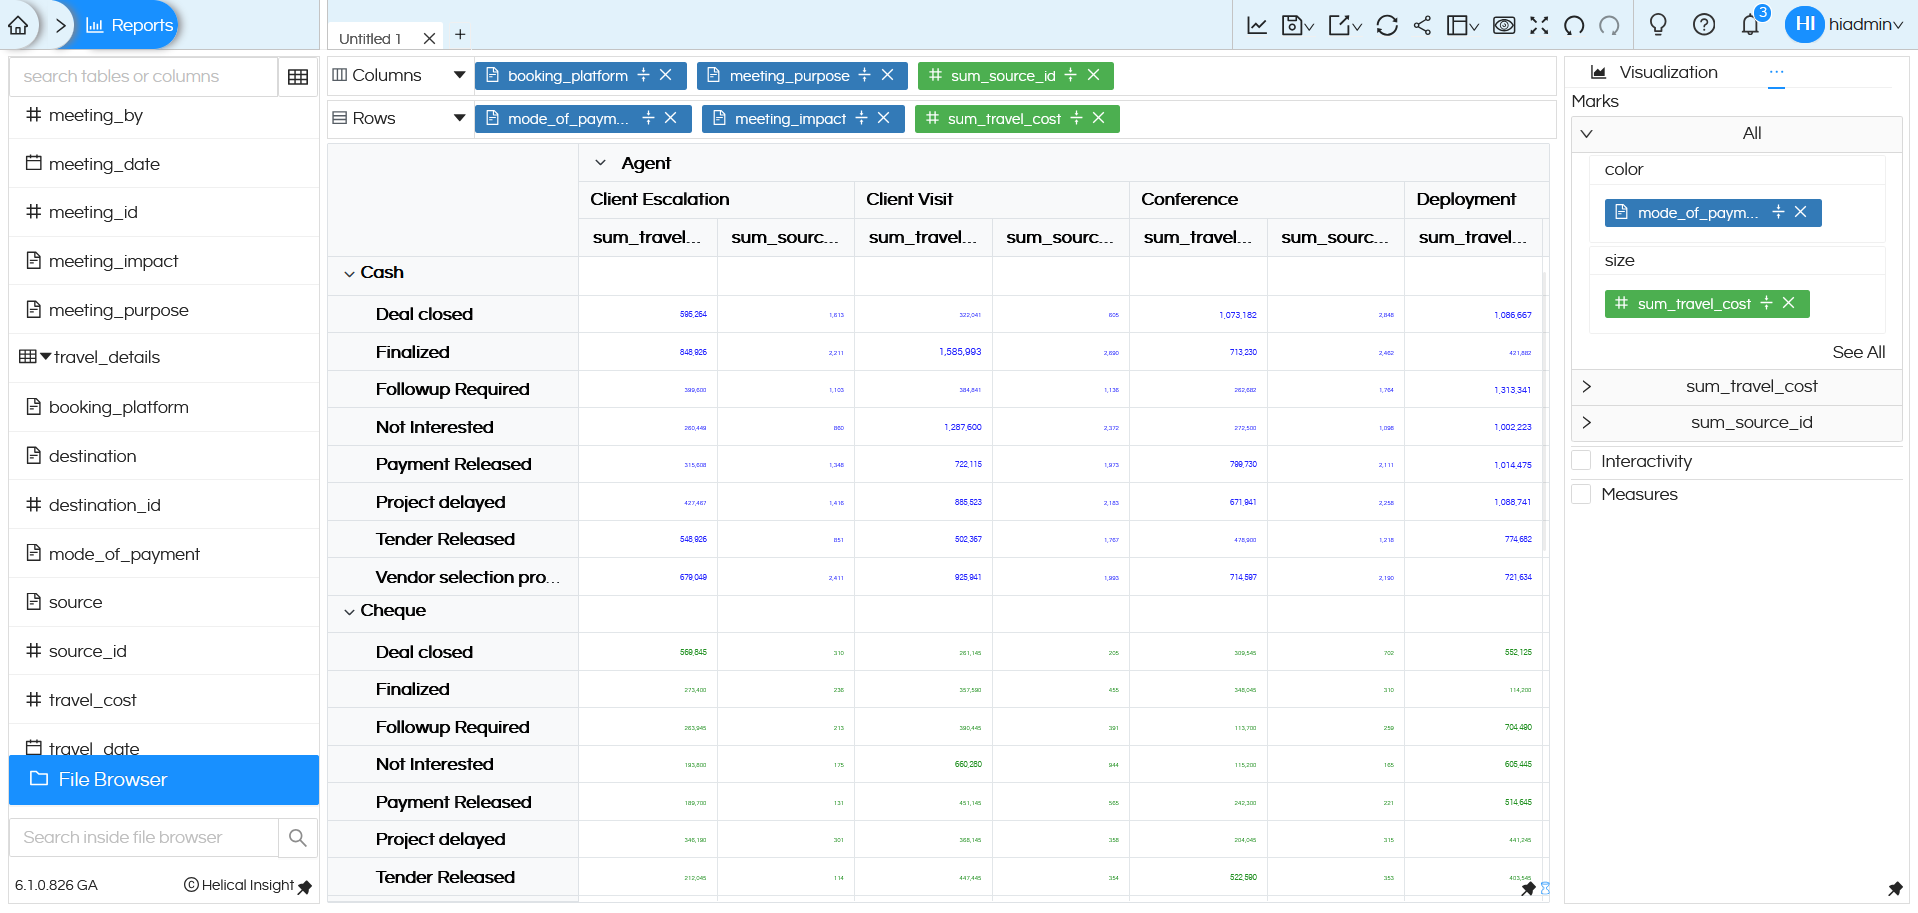
Based on your needs you can use these Marks options for better understanding of data.
There are a lot of other functions like drill down, drill through, formatting, look and feel etc, which we have covered in other blogs. There are also some customizations which works only for Crosstab which can be read here : https://www.helicalinsight.com/crosstab-properties/
Reach out to us on support@helicalinsight.com in case of any more questions.
Thank You,
Helical Insight
