In this blog, we will learn how to implement Condition section display in the canned reporting module of Open Source BI helical Insight.

This functionality allows users to dynamically show or hide specific sections — such as detailed data, summaries, or cover pages — based on user selection/parameter values passed during execution.

To implement this functionality, we first created a parameter by clicking the ‘+’ icon.

Conditional Section Display

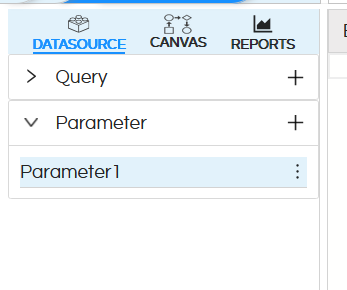
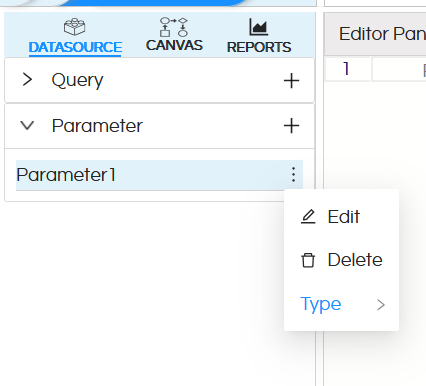
After that, you can edit the parameter name by clicking the three dots — you’ll get an option to edit it.

Conditional Section Display

Here we have named my parameter.

Conditional Section Display

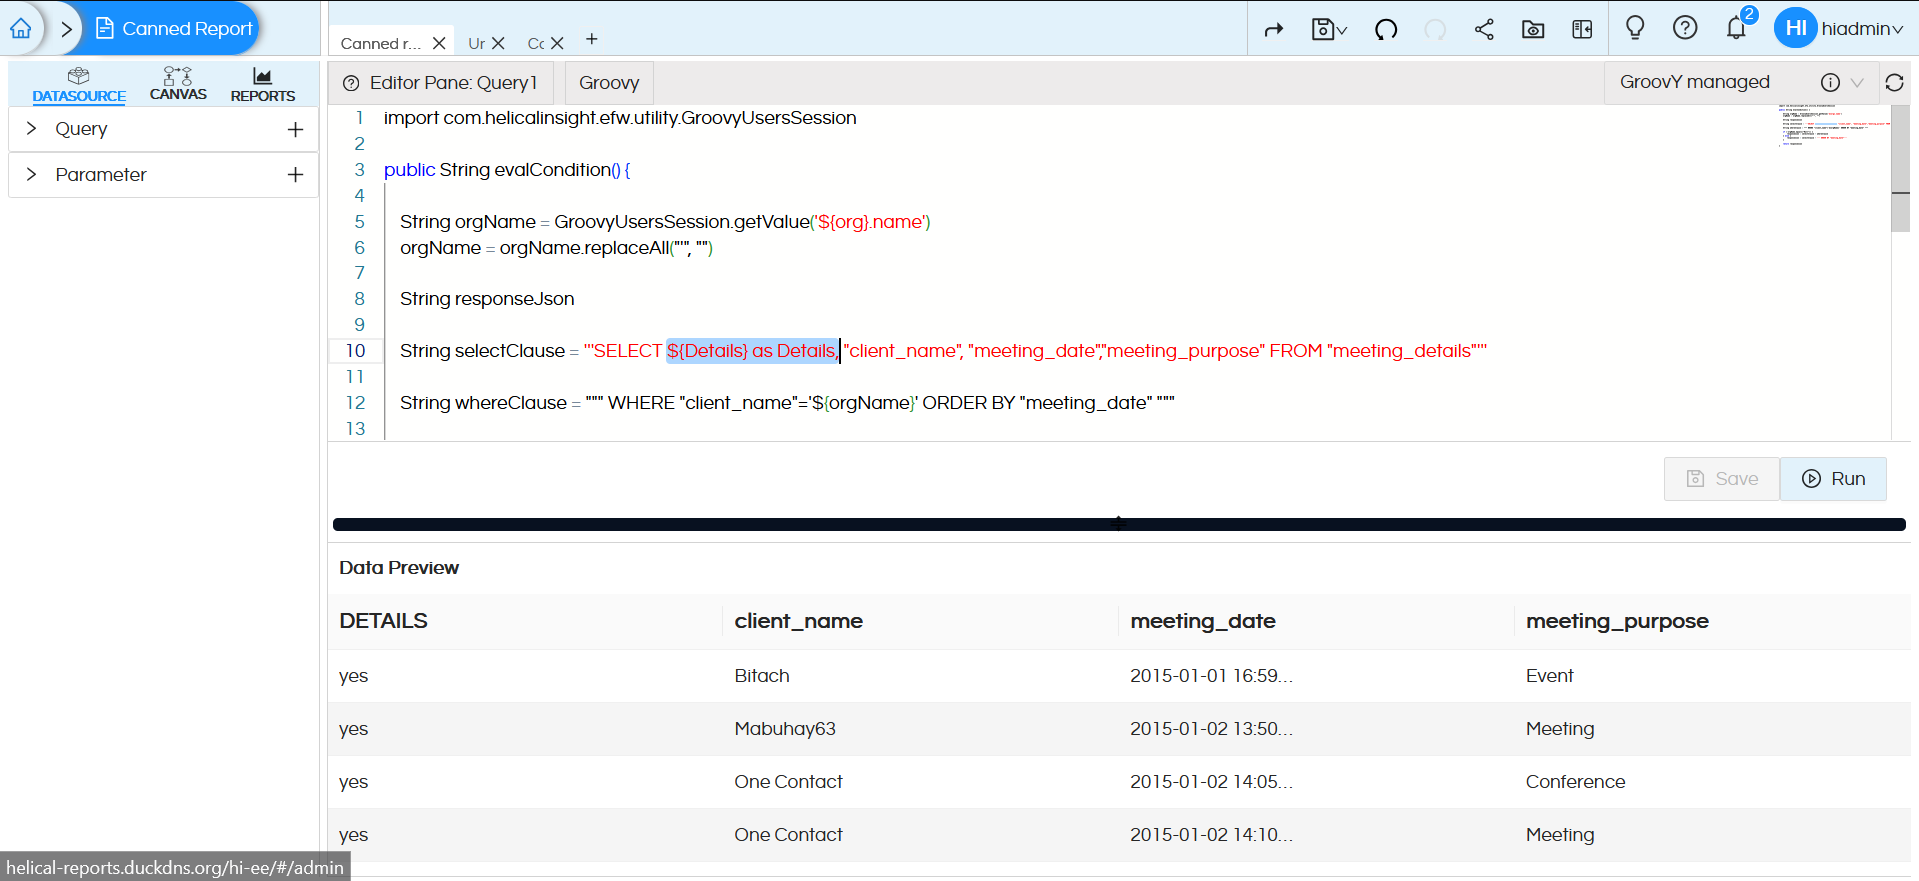
Check the below image — we have added the parameter as a dummy parameter in the select query so that it is available in the canvas.

Conditional Section Display

Conditional Section Display

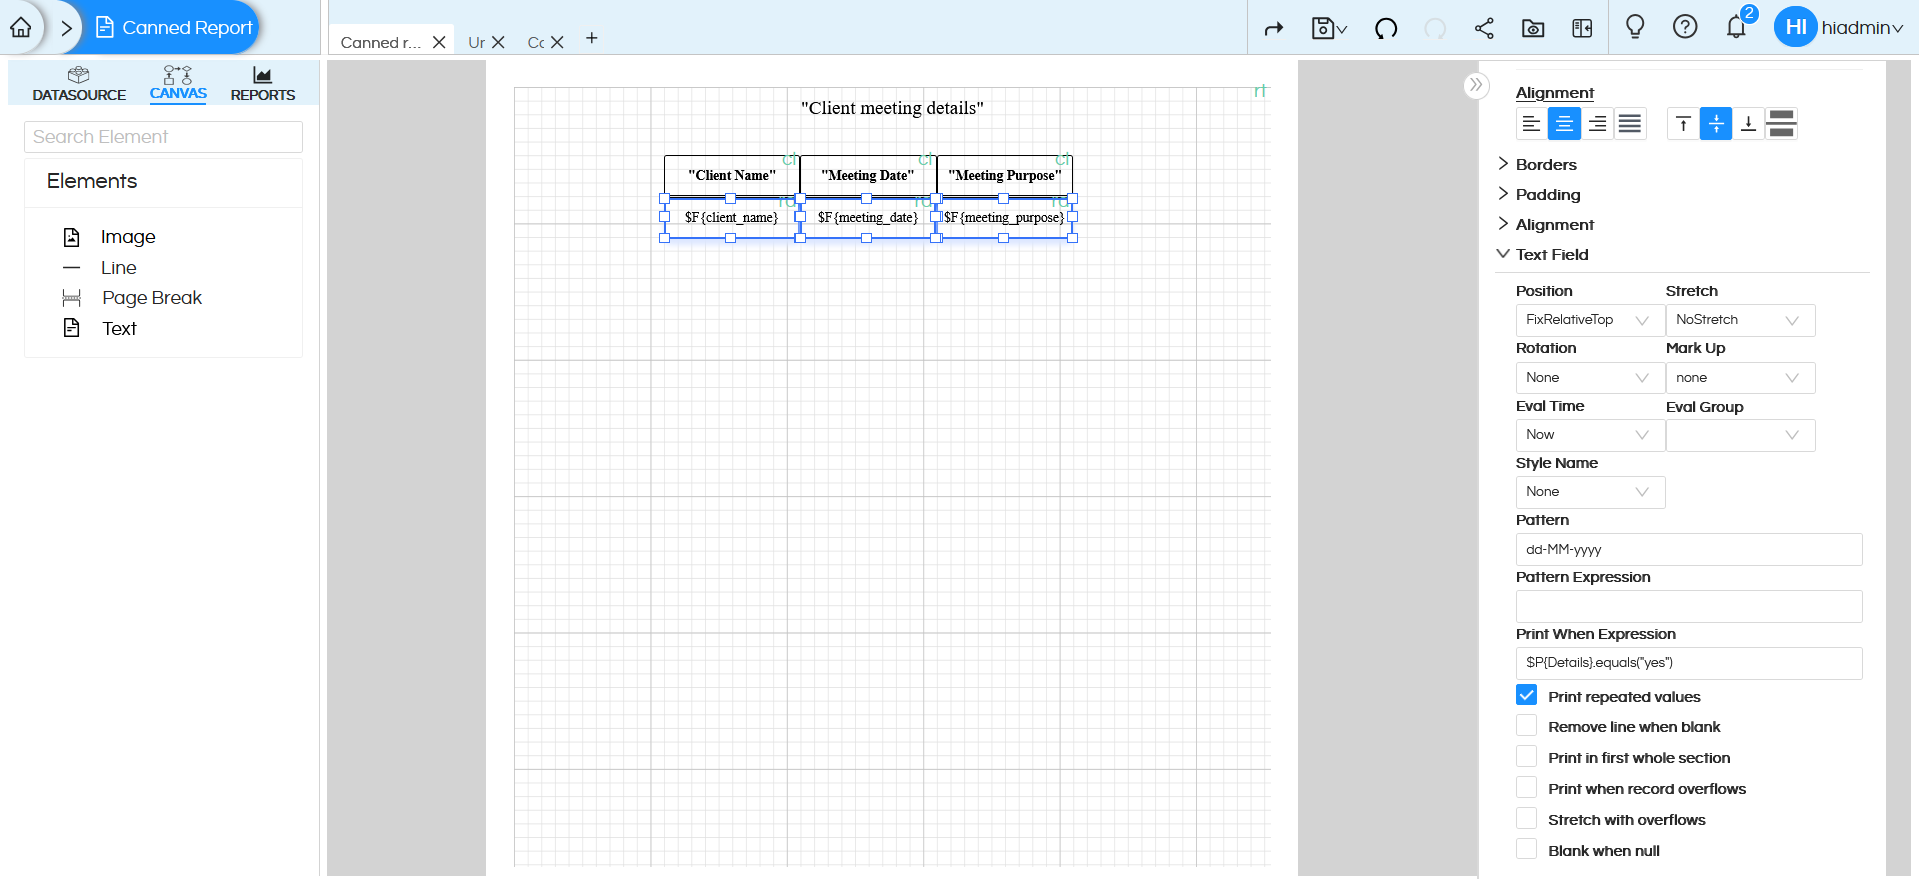
In the above image we have applied $P{Details}.equals(“yes”) expression to all the text fields that belong to the detailed part of the report. Which means when the Details parameter value is set to “yes”, the report displays all sections — including detailed data, When the value is “no”, the report displays only the title and column headers.

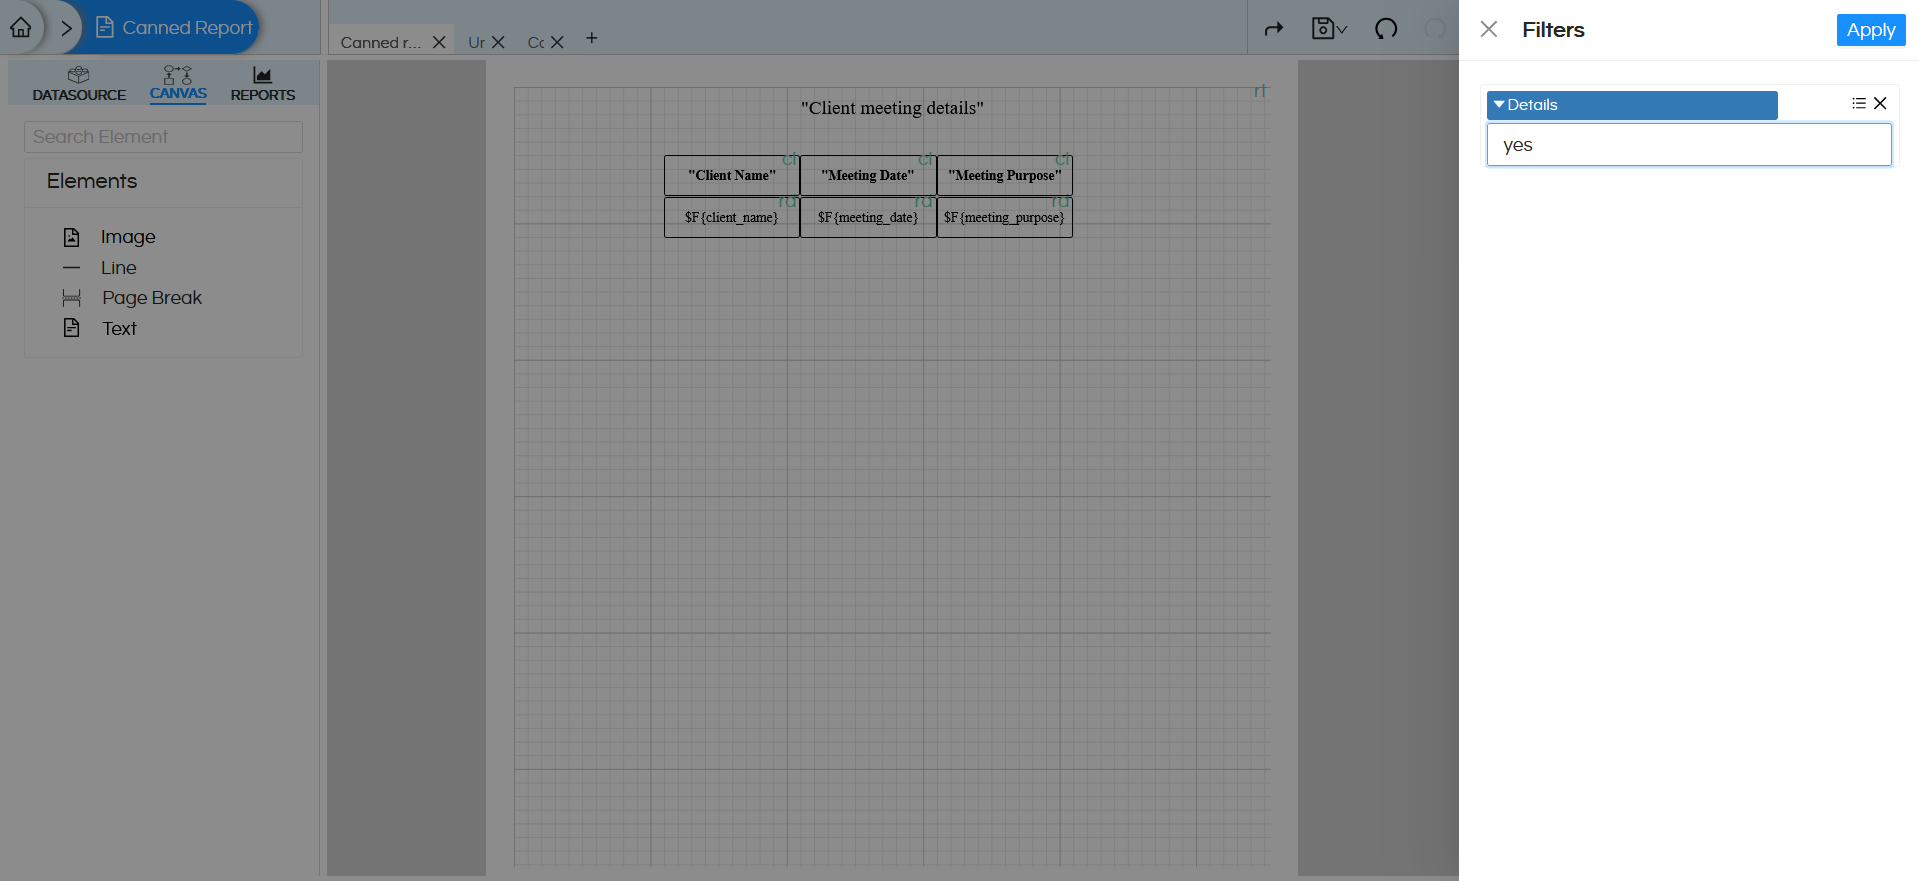
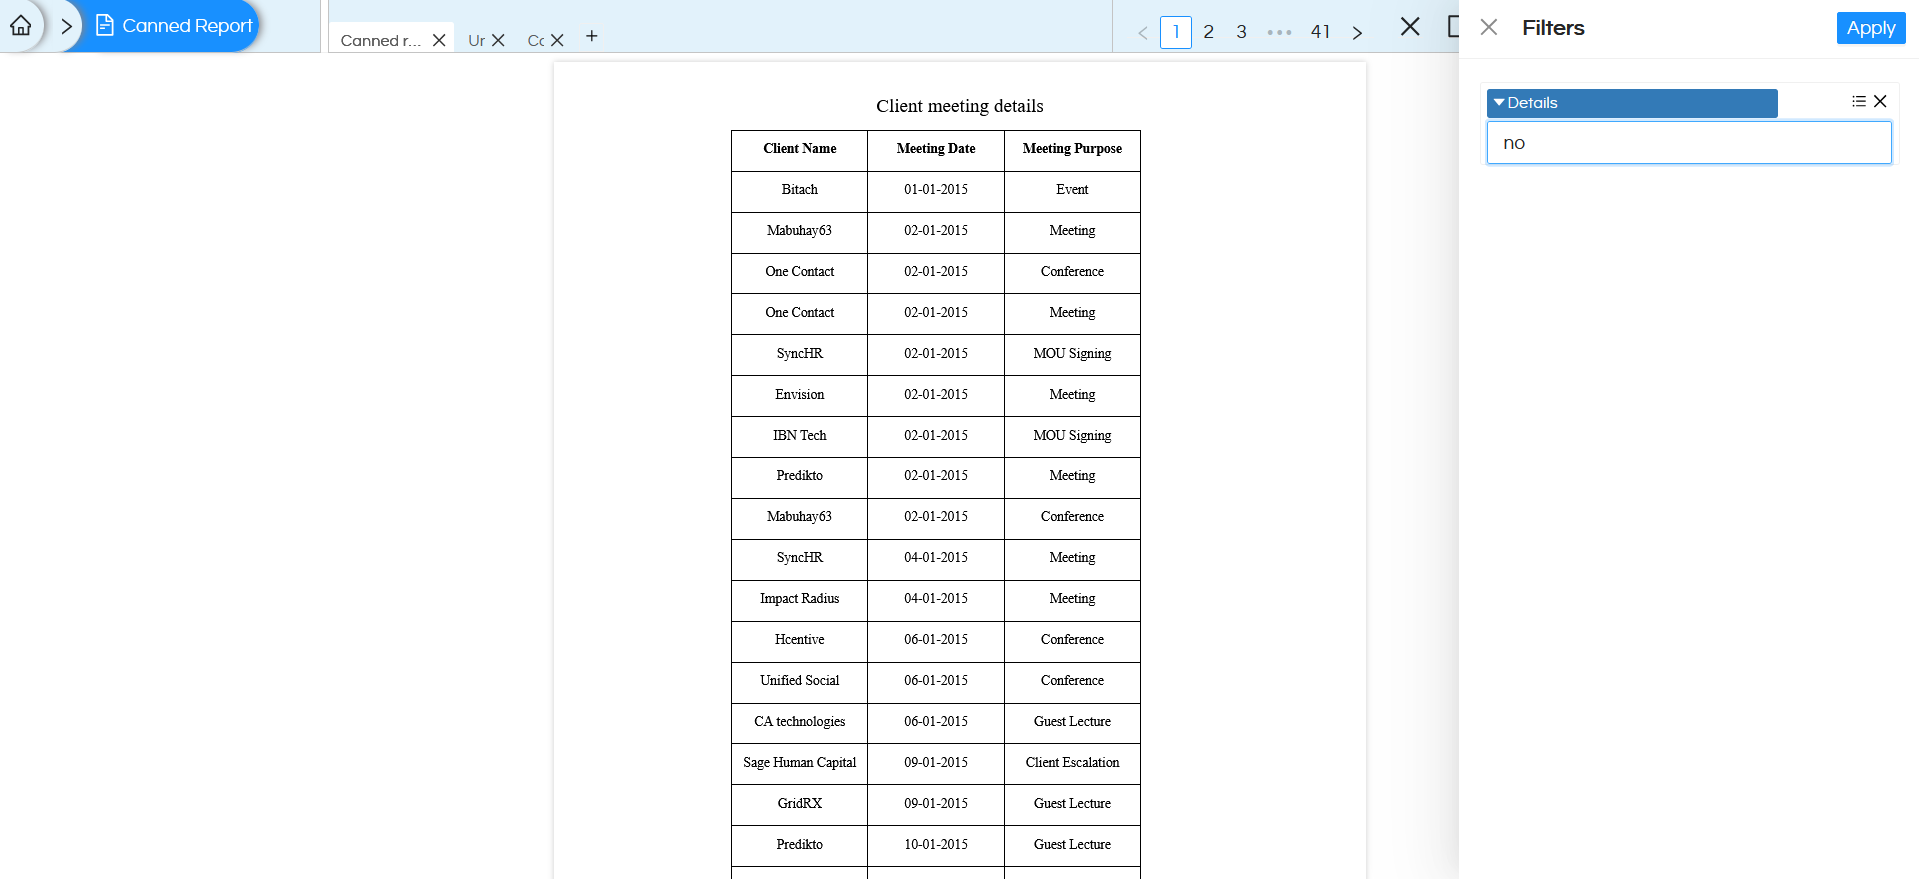
After completing the Canvas configuration click on the Preview option to execute and visualize the report. After clicking Preview, the Filter section will appear with the Details parameter as an input option. Here, when selected “yes” for the Details parameter to verify the conditional display functionality.

Conditional Section Display

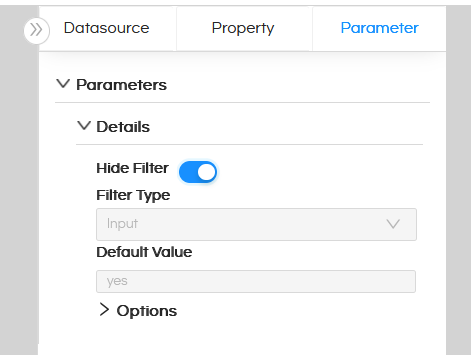
We can also hide the parameter from the user interface by assigning a default value to it. By setting a default value, the parameter is automatically populated during report execution and does not require manual input from the user.

Conditional Section Display

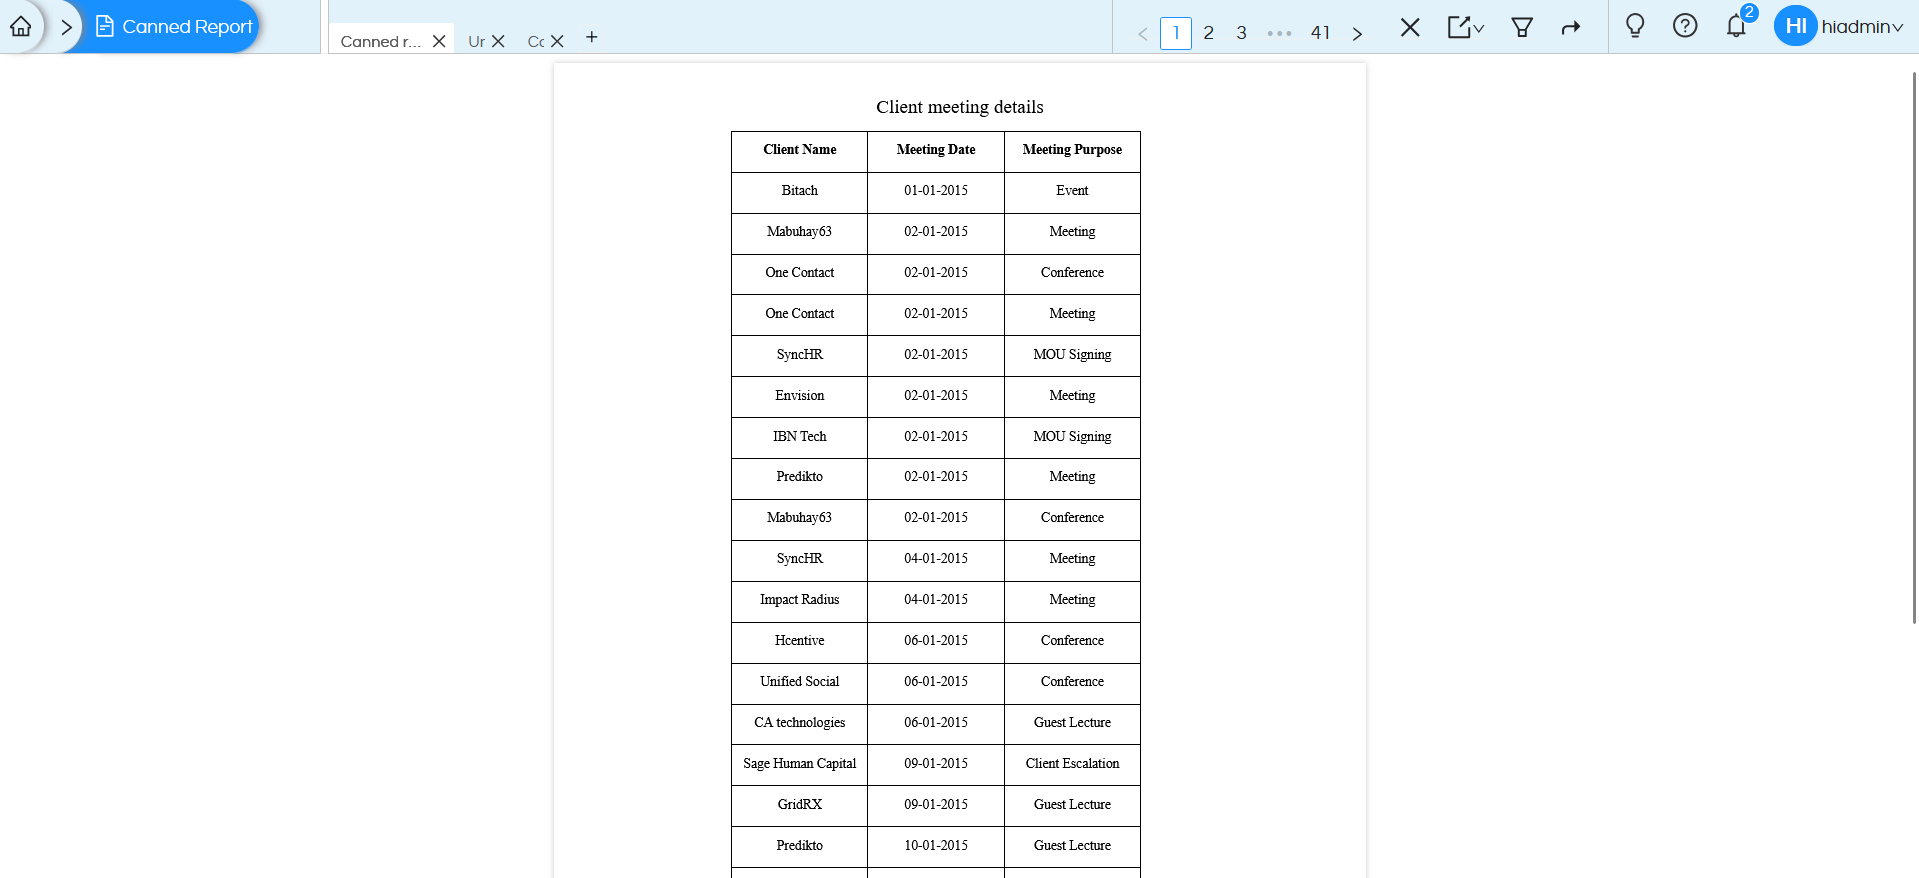
Since the value is set to “yes”, the report displays all the information, including detailed data records, Refer the below image.

Conditional Section Display

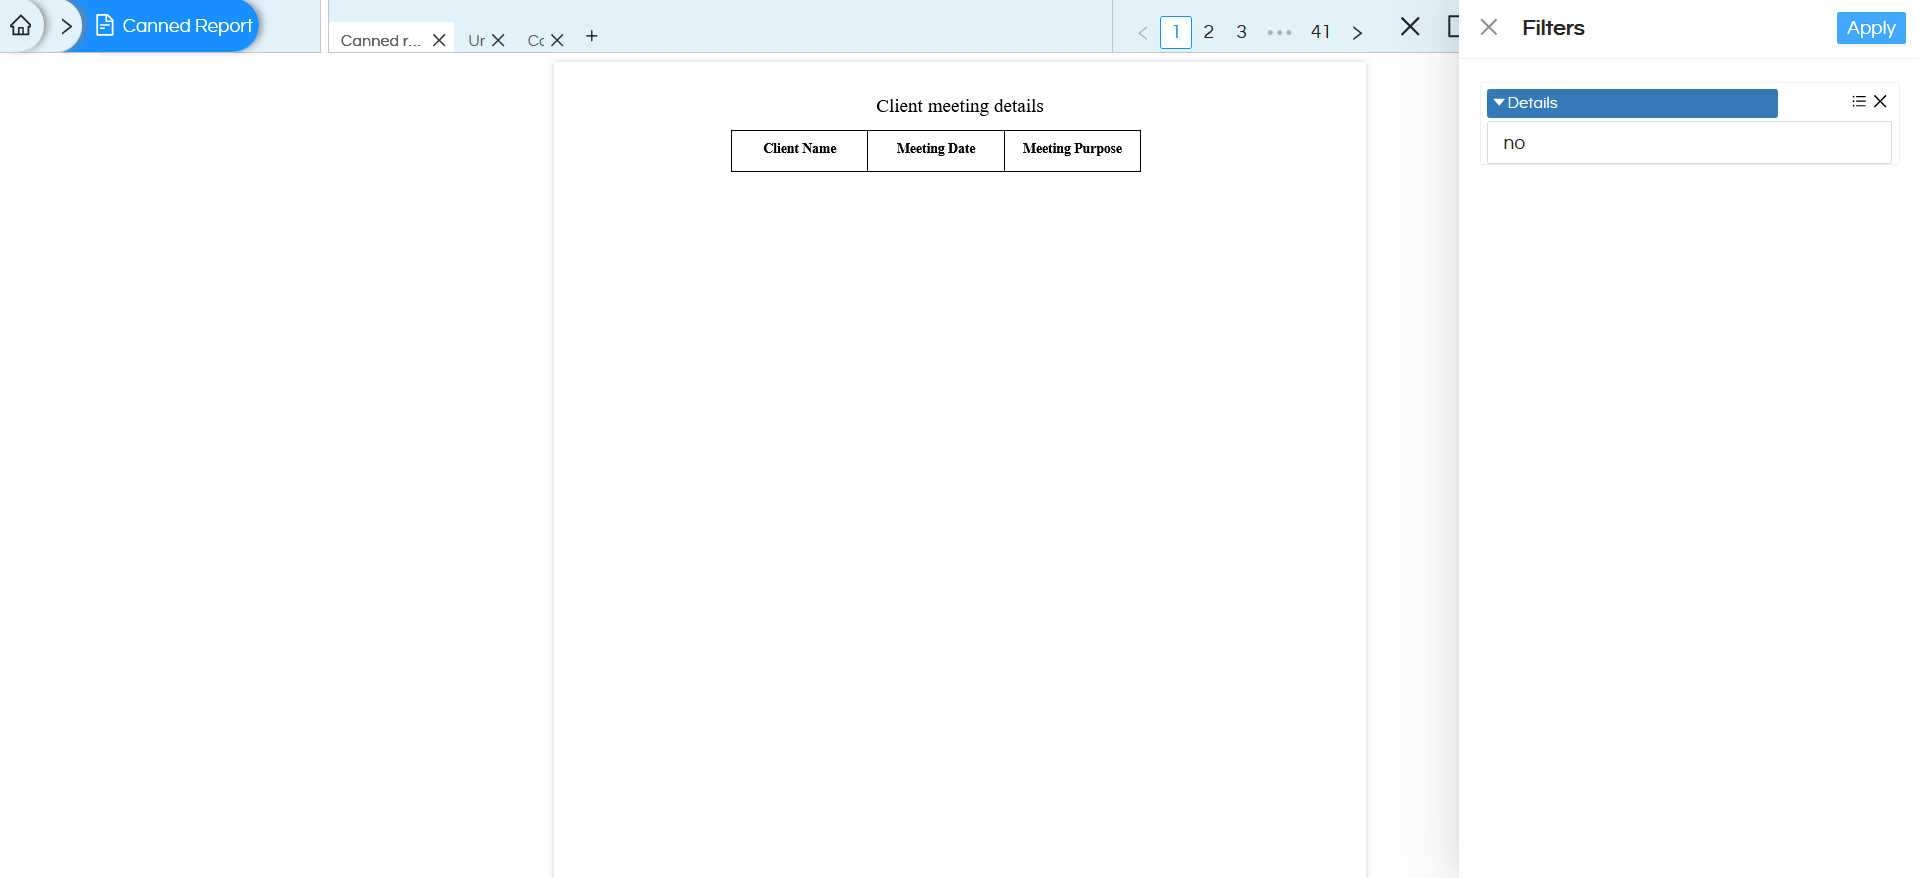
If the Details parameter is set to “no”, only the Title and column headers will be visible, while the detailed rows will remain hidden. Refer the below images:

Conditional Section Display

Conditional Section Display

Overall, this approach enhances usability, reduces redundancy, and provides a more interactive reporting experience.

It is also possible to pass the filtername and filtervalue, rather than from UI, directly into the report URL as well. Hence here we are passing Details is yes or no from the UI, rather it can be passed from some other 3rd party application as well, This is helpful when we are implementing embedding. Refer here to learn more :
https://www.helicalinsight.com/passing-filter-values-in-url-in-helical-insight/

Leave a Reply

Helical Insight’s self-service capabilities is one to reckon with. It allows you to simply drag and drop columns, add filters, apply aggregate functions if required, and create reports and dashboards on the fly. For advanced users, the self-service component has ability to add javascript, HTML, HTML5, CSS, CSS3 and AJAX. These customizations allow you to create dynamic reports and dashboards. You can also add new charts inside the self-service component, add new kind of aggregate functions and customize it using our APIs.
Helical Insight, via simple browser based interface of Canned Reporting module, also allows to create pixel perfect printer friendly document kind of reports also like Invoice, P&L Statement, Balance sheet etc.
If you have a product, built on any platform like Dot Net or Java or PHP or Ruby, you can easily embed Helical Insight within it using iFrames or webservices, for quick value add through instant visualization of data.
Being a 100% browser-based BI tool, you can connect with your database and analyse across any location and device. There is no need to download or install heavy memory-consuming developer tools – All you need is a Browser application! We are battle-tested on most of the commonly used browsers.
We have organization level security where the Superadmin can create, delete and modify roles. Dashboards and reports can be added to that organization. This ensures multitenancy.
A first-of-its-kind Open-Source BI framework, Helical Insight is completely API-driven. This allows you to add functionalities, including but not limited to adding a new exporting type, new datasource type, core functionality expansion, new charting in adhoc etc., at any place whenever you wish, using your own in-house developers.
It handles huge volumes of data effectively. Caching, Pagination, Load-Balancing and In-Memory not only provides you with amazing experience, but also and does not burden the database server more than required. Further effective use of computing power gives best performance and complex calculations even on the big data even with smaller machines for your personal use. Filtering, Sorting, Cube Analysis, Inter Panel Communication on the dashboards all at lightning speed. Thereby, making best open-source Business Intelligence solution in the market.
With advance NLP algorithm, business users simply ask questions like, “show me sales of last quarter”, “average monthly sales of my products”. Let the application give the power to users without knowledge of query language or underlying data architecture
Our application is compatible with almost all databases, be it RDBMS, or columnar database, or even flat files like spreadsheets or csv files. You can even connect to your own custom database via JDBC connection. Further, our database connection can be switched dynamically based on logged in users or its organization or other parameters. So, all your clients can use the same reports and dashboards without worrying about any data security breech.
Our application can be installed on an in-house server where you have full control of your data and its security. Or on cloud where it is accessible to larger audience without overheads and maintenance of the servers. One solution that works for all.
Different companies have different business processes that the existing BI tools do not encompass. Helical Insight permits you to design your own workflows and specify what functional module of BI gets triggered