Generally, when a canned report is created the fields on which Grouping (GroupBy), sorting and type of sorting (like ascending/descending), aggregate function and type of aggregate function (like sum, count, max, min etc) are already specified in the SQL. Mostly the use case is like this only.
However there could be certain use cases wherein we want an end user to specify on which fields they would ideally like groupby, sorting and type of sorting, aggregation and type of aggregation etc to happen. Report layout remains the same, but the data etc gets changed based on this and the query is not really static but is very dynamic. Hence, in this document we are going to cover how such a requirement can be handled.
The same can be handled via two methods.
- Passing variables in SQLQuery itself.
- Second method is via dynamic groovy method.
First method is more simpler to implement. Even though this Groovy method is more complex to implement, however it can be even used to achieve more complex use cases also.
Method 1: Using SQL Method:
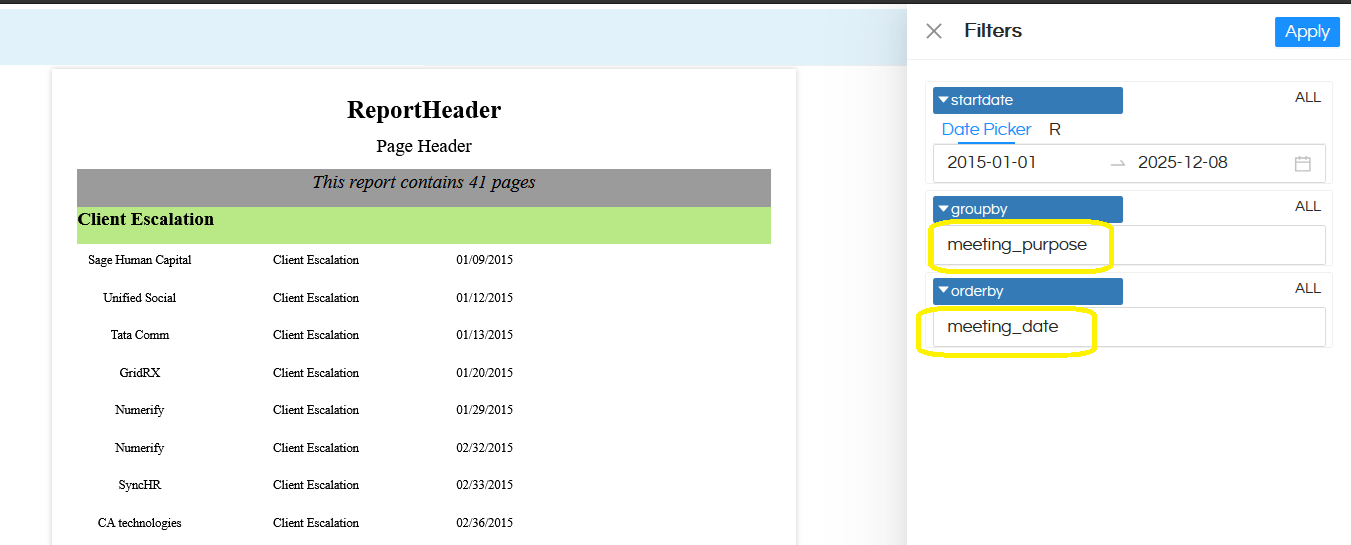
In this documentation, we are going to cover addition of one dynamic groupby field and dynamic orderby field wherein an end user can pass the field value and according to that field GroupBy will happen and OrderBy will happen. It will also have a default value. The end output of the report will look like below
In this method, you can create the normal canned report. However in the SQL, we will pass on a dummy GroupBy field and OrderBy field as shown below
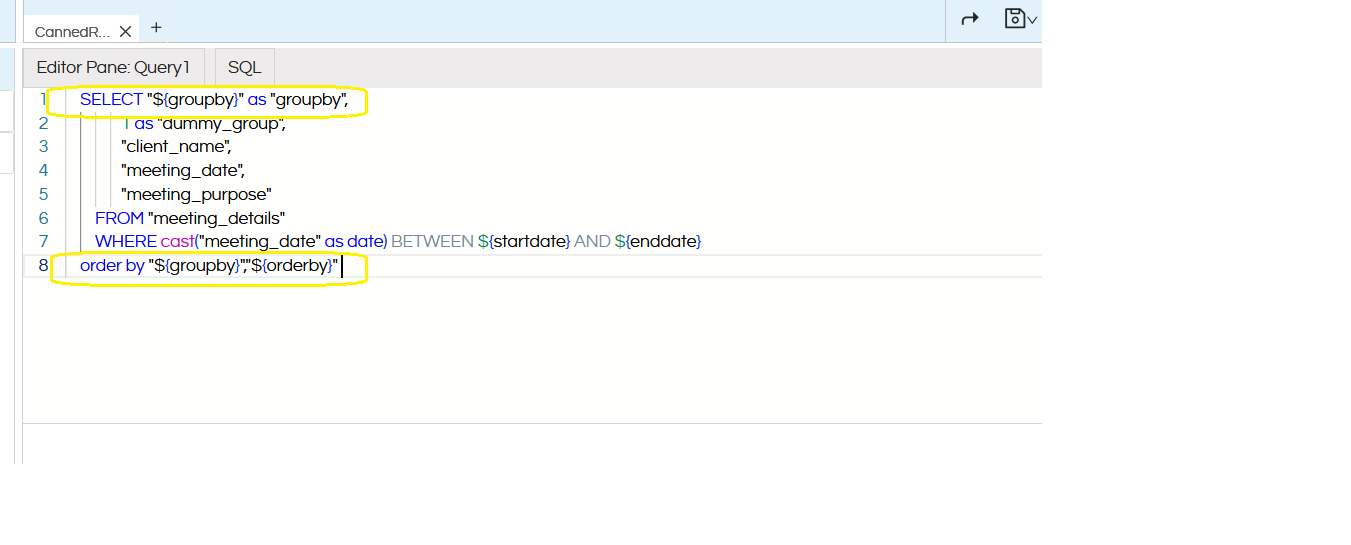
The SQLQuery for reference is also shared below
SELECT "${groupby}" as "groupby",
           1 as "dummy_group",
           "client_name",
           "meeting_date",
           "meeting_purpose"
    FROM "meeting_details"
    WHERE cast("meeting_date" as date) BETWEEN ${startdate} AND ${enddate}
order by "${groupby}","${orderby}"
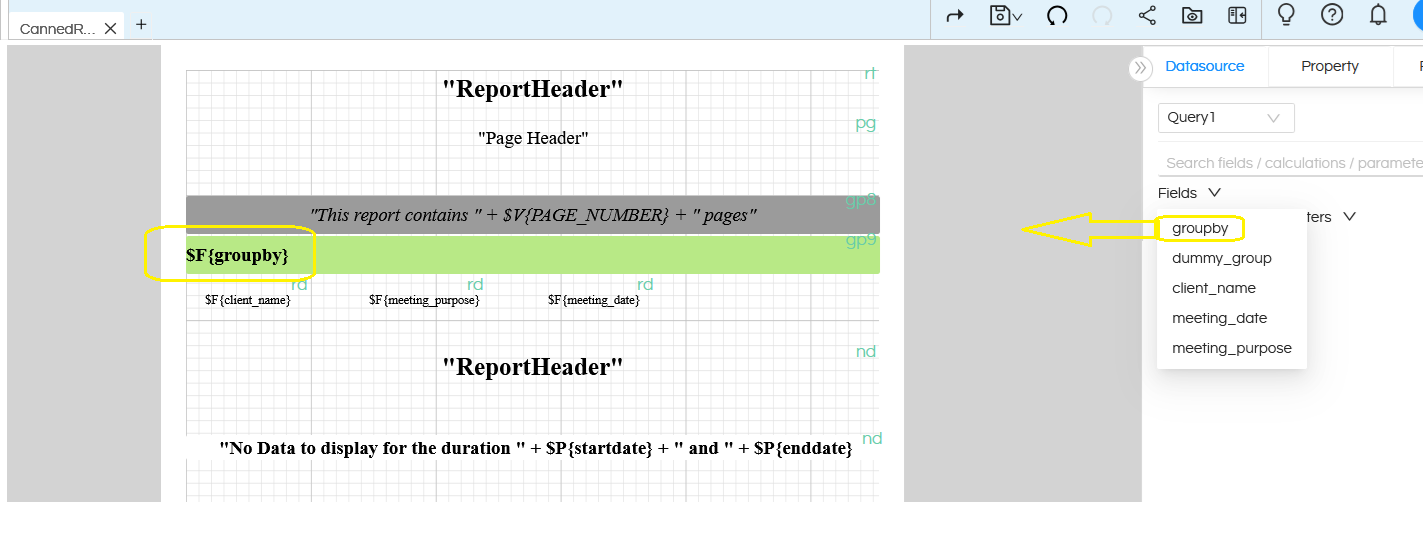
Now, when we are creating the report, we should use the dummy created GroupBy field, drag it, right click on it and make group according to it and further create the report.
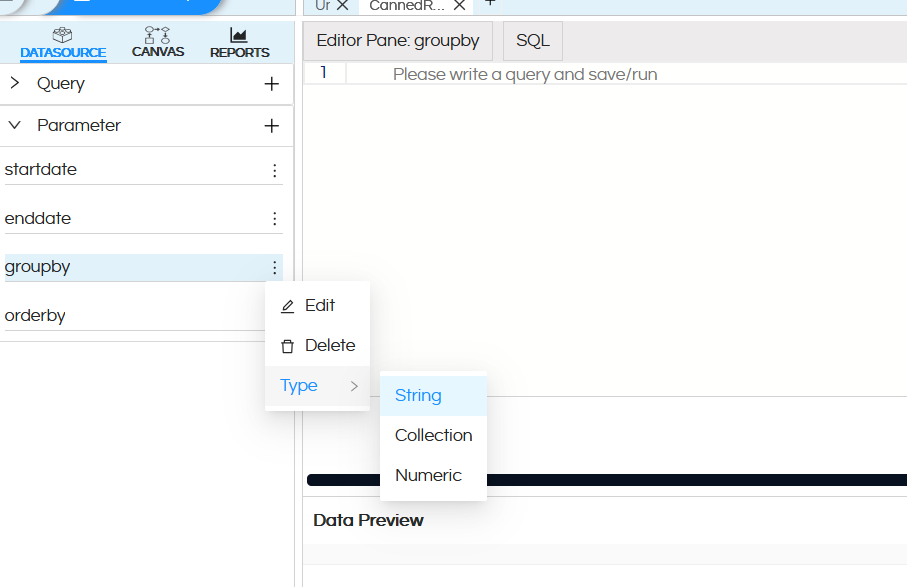
Now, create two parameters
- groupby
- orderby
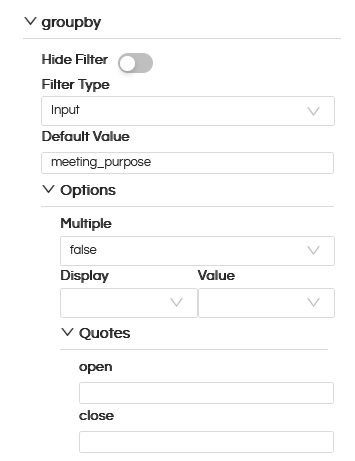
The parameter name should exactly match with the SQL. There is no need to write any SQL for these and the parameter type will be string as shown below.
After creating these 2 input parameters, then we should configure these parameters in the canvas parameter related property.
The filtertype should be Input (that means user can type the name of the field). Default value also you can specify so that based on that the report will automatically by default generate. IMPORTANT: Make sure to keep Quotes blank (by default it might have values ” ). Do this for the other filter also i.e ordery filter.
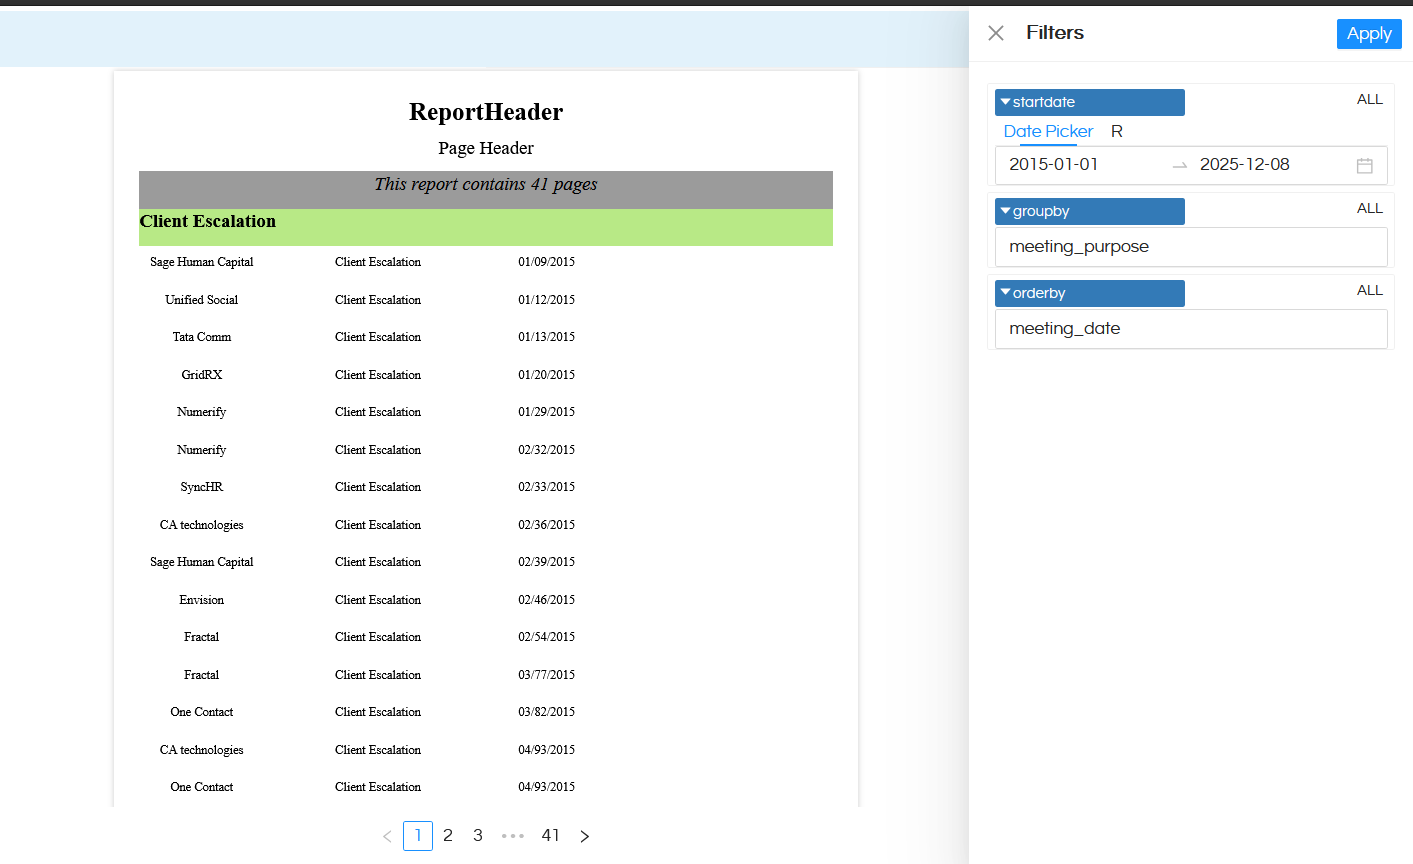
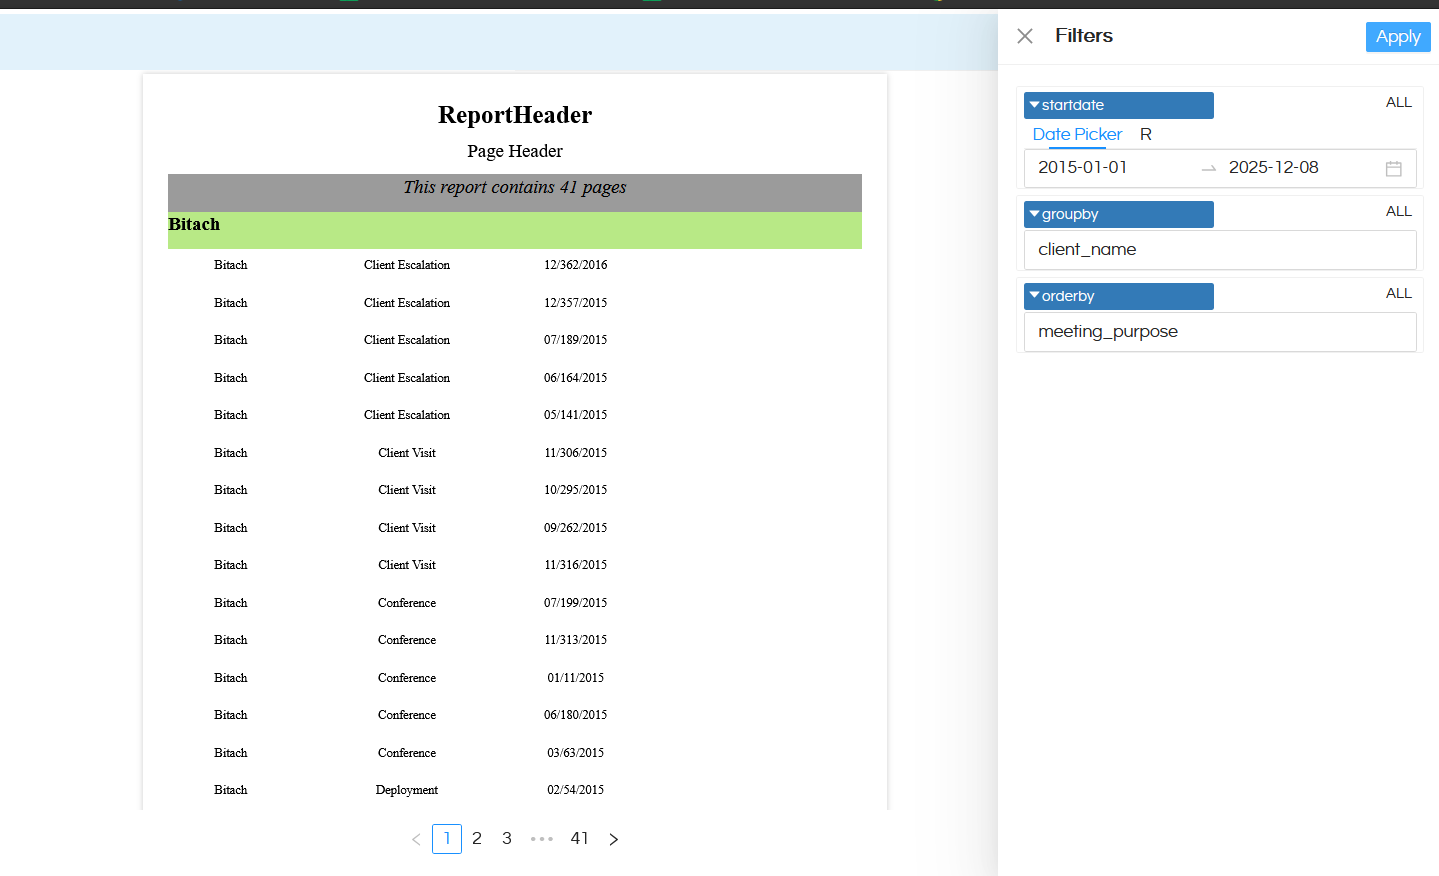
Once this is done, you can open the report. You can manually or via URL or other method pass the values and accordingly the report data can get changed. Whatever values are passed to groupby and orderby, accordingly the data can get changed.
Reference: In the below image groupby is happening on meeting_purpose and ordery is happening on meeting_date.
In a similar way we can have lot more dynamicity as well like multiple groupby, which aggregation to be applied, on which field to be aggregation to be applied, which sorting to be applied etc and all of them can be user driven along with having a default value as well assigned to it.
Method 2: Using Dynamic Groovy Method:
(A) Datasource Connection:
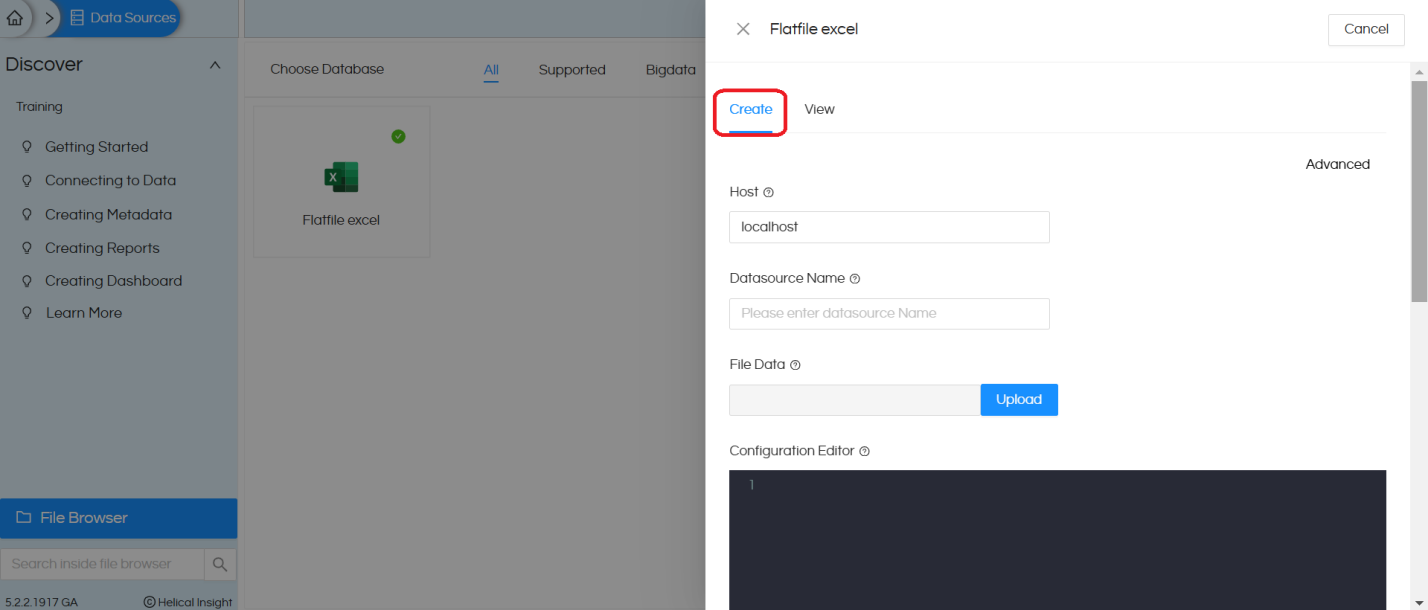
Log in to your Helical Insight application and go to the “Data Sources” module
Once you are on “Data Sources” module, you will see many options to connect to different databases and you can connect to the choice of your database.
In this case, we are going to use Excel as a datasource. Click here to learn more about using excel as a datasource.
After saving the datasource you will see the created datasource with the connectionId
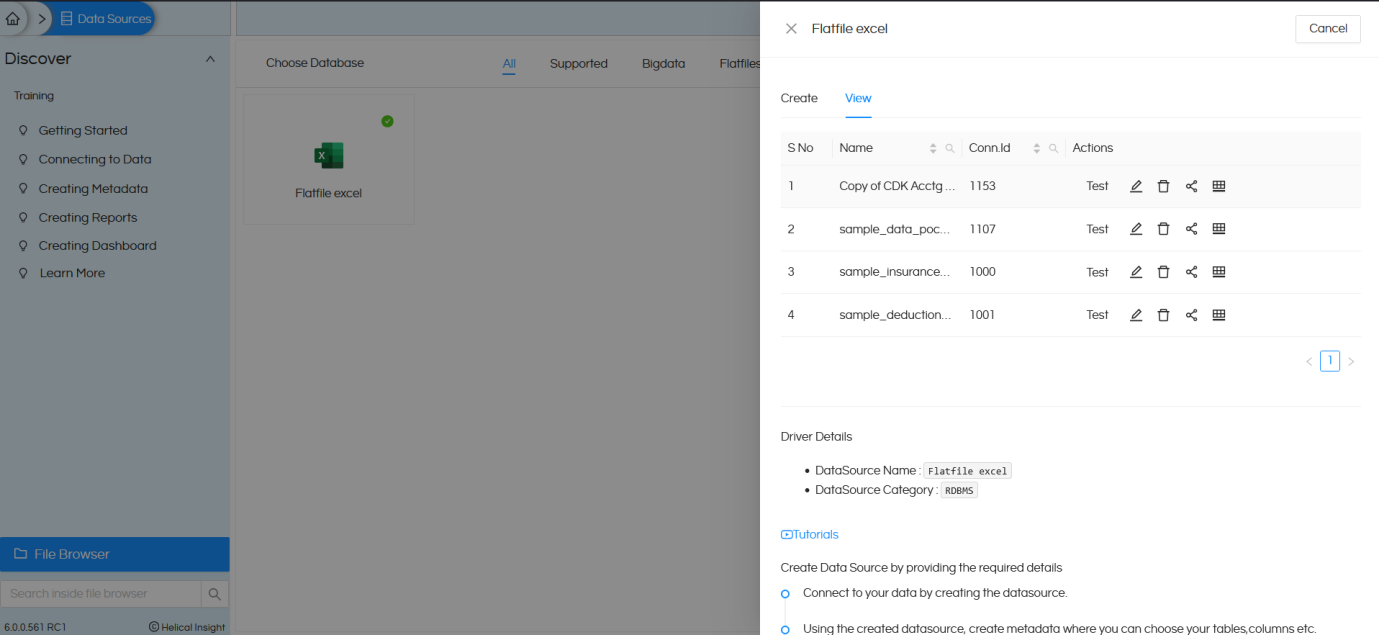
Please keep a note of this connection ID which we will use in the next step (Groovy Connection).
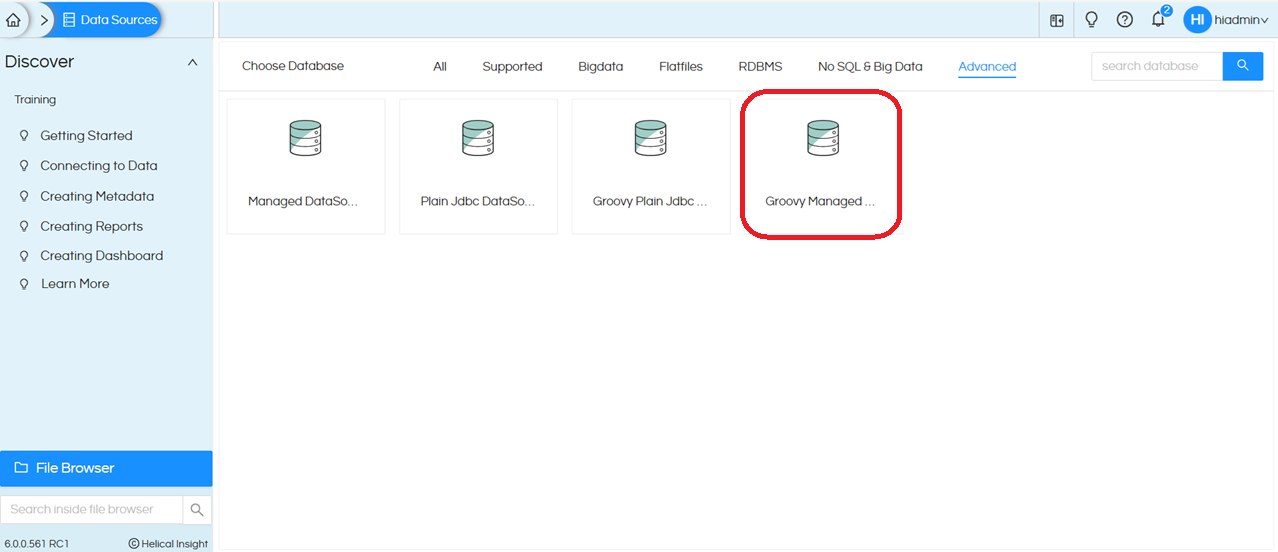
We will also have to create a Groovy Managed Connection using the Connection ID of the data source that we have already created (i.e., a Flat File Excel connection). Groovy managed connection is required because using Groovy script we are going to dynamically change the SQL.
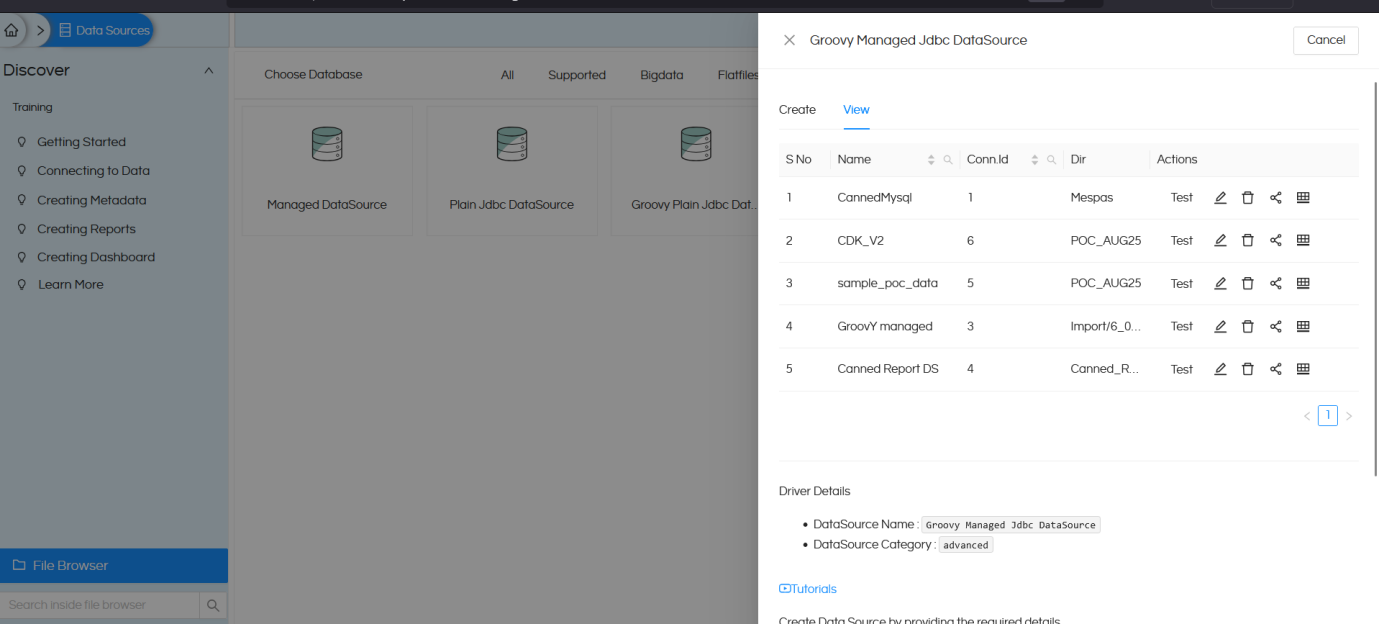
To create a Groovy Managed Connection, navigate to the Data Source page, open the Advanced section, and select Groovy Managed JDBC DataSource.
This allows the report to execute Groovy scripts that dynamically build and run SQL queries at runtime using the specified data source connection.
Click on Create. This opens the UI displaying the following fields: Datasource Name, Location, and a Groovy placeholder. The Groovy placeholder comes with some default code provided as a reference
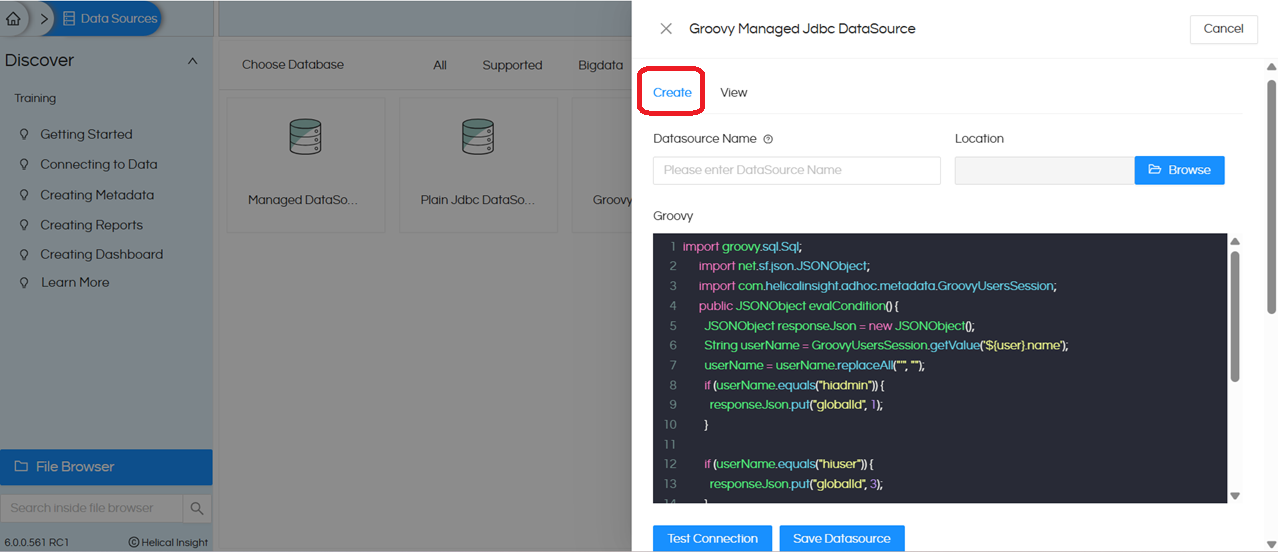
Groovy code for the connection:
The default code is an example of switching the report connection dynamically based on logged in user. We do not require this logic, so we will replace it with below simple code:
import net.sf.json.JSONObject;
public JSONObject evalCondition() {
JSONObject responseJson = new JSONObject();
          	responseJson.put("globalId", <PUT GLOBAL CONNECTION ID HERE>);
        	responseJson.put("type", "global.jdbc");
return responseJson;
      }
Below is the explanation of this code –
import net.sf.json.JSONObject;
used to create a JSON object that will be returned to Helical Insight.

public JSONObject evalCondition() {
      JSONObject responseJson = new JSONObject();
Defines a public method evalCondition() that returns a JSON object.
This responseJson will be the output that Helical Insight uses to determine which connection to use.

responseJson.put("globalId", < PUT GLOBAL CONNECTION ID HERE >);
Replace the highlighted value above with the actual global connection id of the excel datasource which we setup earlier.

responseJson.put("type", "global.jdbc");
This defines the type of datasource connection — In this case, a JDBC connection type (i.e., database connection).
 return responseJson;
 }
Finally, the JSON response is returned to the reporting engine.
Helical Insight then uses it to establish a connection dynamically.
We created a Groovy connection with the datasource name CDK_V2 and then saved the connection.
You will also have to specify the “Location” where this Groovy Managed connection should get saved. If this is left blank it will give an error.
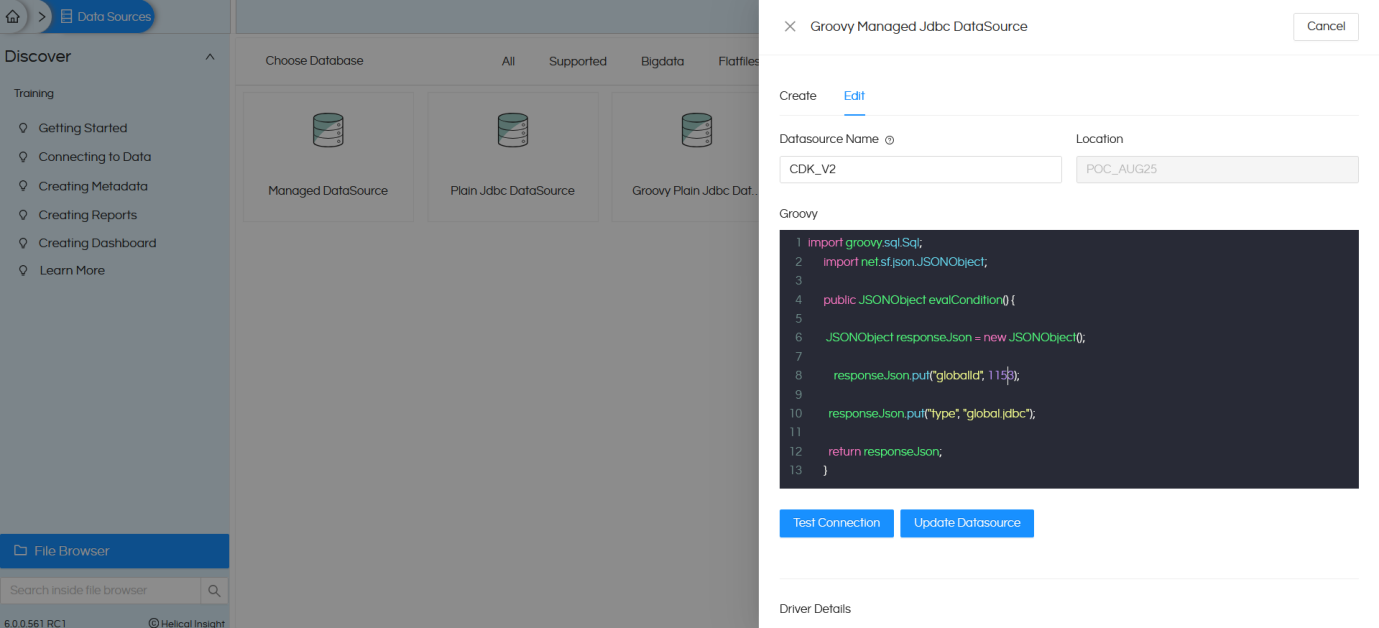
Check the below image, datasource is created with the connection id 6.
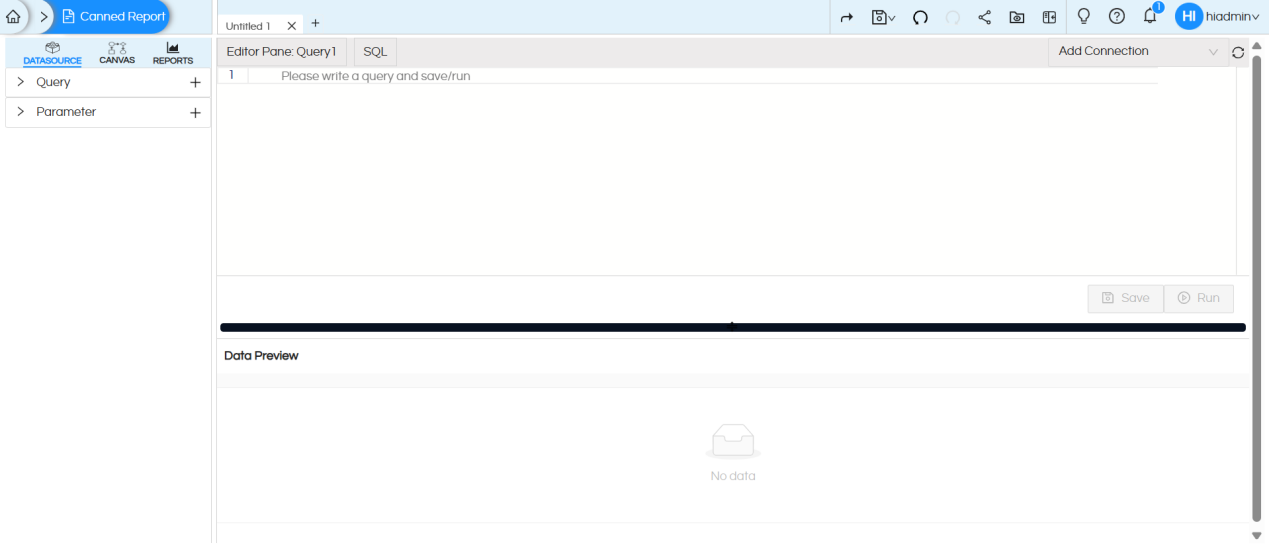
Open the Canned Report module. By default, it opens as shown below.
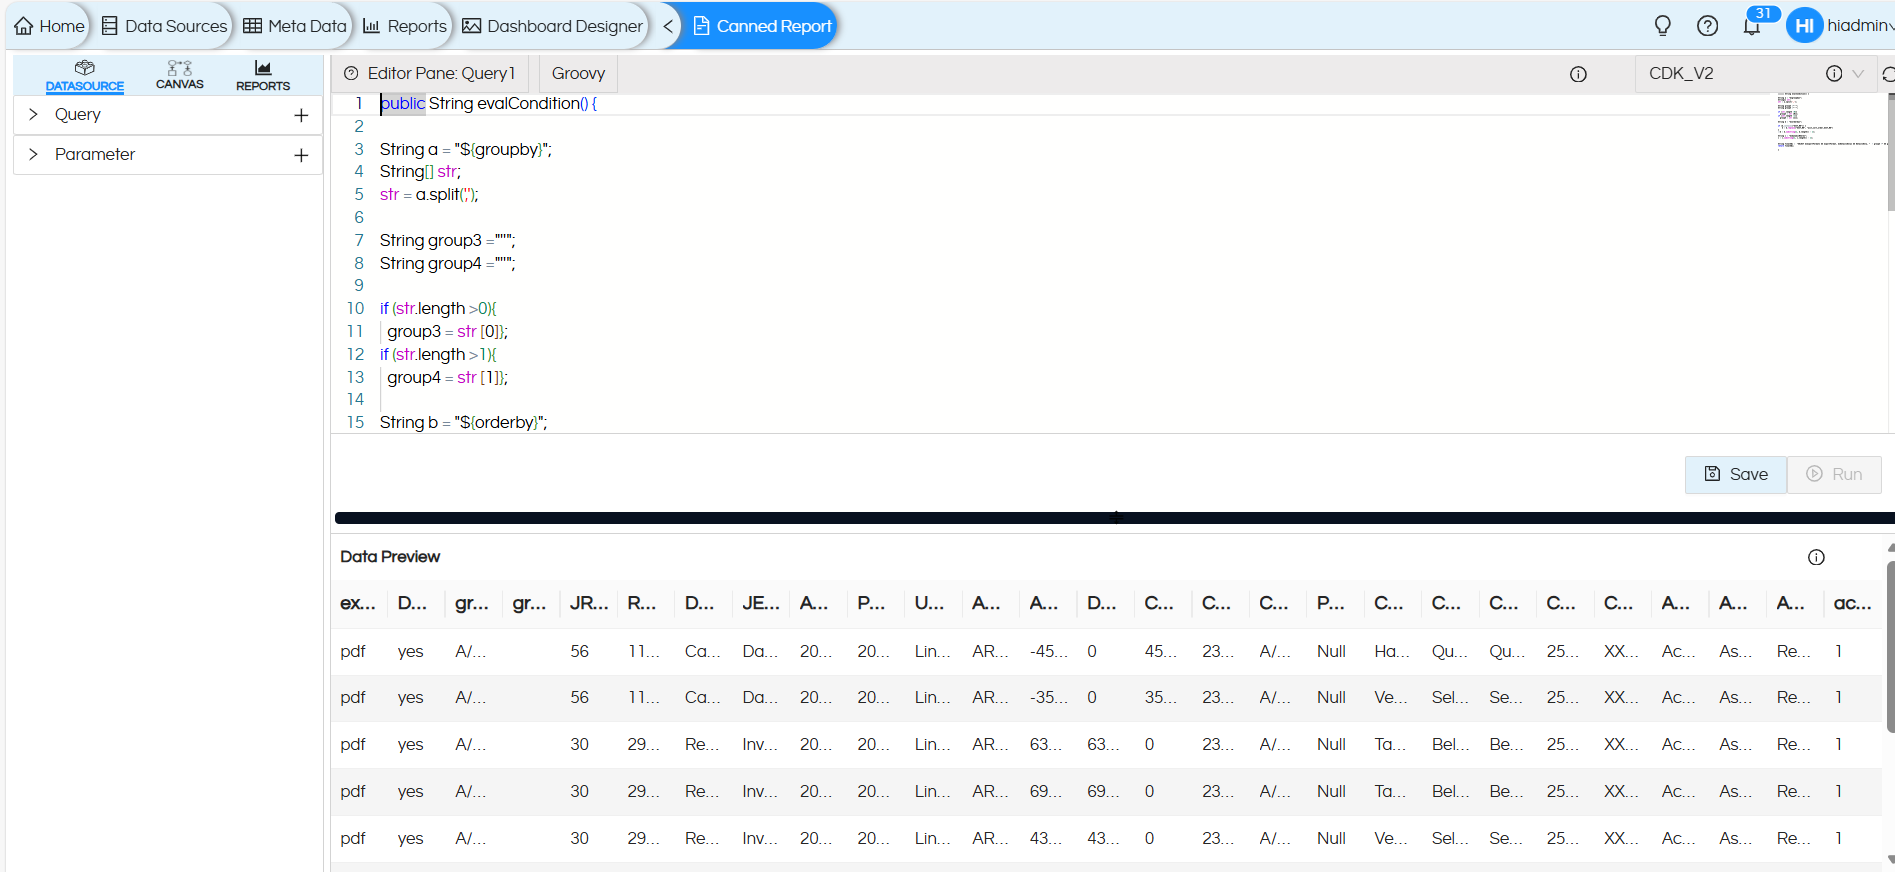
Click on Add Connection at the top right, select Groovy Managed connection. Here, we selected CDK_V2 which is the name of the /Groovy connection which we had created earlier.
Once we select the Groovy connection, the SQL type changes to Groovy. Now write the code below in the Groovy SQL placeholder. Groovy code/syntax is bit similar to Java.
Here, a Groovy script is developed to dynamically build and execute a SQL query based on user inputs and runtime parameters such as groupby, orderby, and dynamicWhere etc. This approach provides high flexibility and adaptability, enabling the same report to serve multiple data presentation requirements without modifying the underlying base query or report structure.
Why Groovy Instead of Static SQL
A static SQL query cannot easily adjust to runtime parameters such as groupby, orderby, or user-specific filters.
To address this limitation, Groovy scripting was used to build the SQL dynamically, allowing:
- Dynamic grouping based on user-selected fields (This code handles upto 2 group by fields)
- Runtime sorting through the orderby parameter
- Dynamic filters via Date range parameters
This ensures that one single Groovy-based report can serve multiple reporting needs dynamically.
Groovy Code:
public String evalCondition() {

String a = "${groupby}";
String[] str;
str = a.split(',');

String group3 ="''";
String group4 ="''";

if (str.length >0){
  group3 = str [0]};
if (str.length >1){
  group4 = str [1]};

String b = "${orderby}";

if (b.contains("ACCT_NO")) {
    b = b.replace("ACCT_NO", "acct_sort_order,ACCT_NO")
}

String c = "${dynamicWhere}";

String finalSQL =  "SELECT ${exportFormat} AS exportFormat, ${DetailsOnly} AS DetailsOnly, "  + group3 +" AS group3, " + group4 +" AS group4,* FROM (WITH acct_info as (select * , case when (\"Account Type\" = 'Asset' and \"Account Category\" = 'Receivables' ) then 1 when (\"Account Type\" = 'Asset' and \"Account Category\" = 'Inventories' ) then 2 when (\"Account Type\" = 'Liability' and \"Account Category\" = 'Payables' ) then 3 when (\"Account Type\" = 'Liability' and \"Account Category\" = 'Accruals' ) then 4 else 5 end as acct_sort_order from cdk_data_copy_ACCT_INFO where \"Acct No.\" is not null) SELECT H.\"Jrn No.\" AS JRN_NO, H.\"Refer No.\" AS REFER_NO, H.\"Document Type\" AS DOCUMENT_TYPE, H.\"JE Description\" AS JE_DESCRIPTION, H.\"Acctg Date\" AS ACCTG_DATE, H.\"Post Date\" AS POST_DATE, H.\"User\" AS USER, D.\"Acct No.\" AS ACCT_NO, D.\"Amount\" AS AMOUNT, CASE WHEN D.\"Amount\" > 0 THEN D.\"Amount\" ELSE 0 END AS DEBIT, CASE WHEN D.\"Amount\" < 0 THEN ABS(D.\"Amount\") ELSE 0 END AS CREDIT, D.\"Ctrl No.\" AS CTRL_NO, D.\"Control Type\" AS CONTROL_TYPE, D.\"Post Description\" AS POST_DESCRIPTION, C.\"Control Name\" as CUSTOMER_NAME, C.\"Customer Email\" as CUSTOMER_EMAIL, SUBSTR(C.\"Customer Email\" , 1, 2) || '*****' || SUBSTR(C.\"Customer Email\" , INSTR(C.\"Customer Email\" , '@') - 1) AS CUSTOMER_EMAIL_MASKED, C.\"Customer Phone\" AS CUSTOMER_PHONE, 'XXXXXX' || SUBSTR(C.\"Customer Phone\", LENGTH(C.\"Customer Phone\") - 3, 4) AS CUSTOMER_PHONE_MASKED, A.\"Account Name\" as ACCOUNT_NAME,A.\"Account Type\" AS ACCOUNT_TYPE,A.\"Account Category\" AS ACCOUNT_CATEGORY,A.acct_sort_order FROM cdk_data_copy_JE_HEADER H JOIN cdk_data_copy_JE_DETAIL D ON CAST(H.\"LINK TO JE DETAIL\" AS VARCHAR) = CAST(D.\"LINK TO JE HEADER\" AS VARCHAR) LEFT JOIN cdk_data_copy_CUSTOMER_CTRL_INFO C ON CAST(D.\"Ctrl No.\" AS VARCHAR) = CAST(C.\"Ctrl No.\" AS VARCHAR) LEFT JOIN acct_info A ON CAST(D.\"Acct No.\" AS VARCHAR) = CAST(A.\"Acct No.\" AS VARCHAR) WHERE  H.\"Acctg Date\" BETWEEN CAST(${startdate} AS DATE) AND CAST(${enddate} AS DATE) AND "+c+")main ORDER BY "+a+","+b;
return finalSQL;

}
Step by step Explanation of Groovy Code:
1. GroupBy Parameter Handling
String a = "${groupby}";
String[] str;
str = a.split(',');
The ${groupby} parameter comes from the report input. The code splits the string value by comma (,) and stores in an array.
2. Defining Group Variables
String group3 ="''";
String group4 ="''";
These variables act as placeholders for up to 2 possible Group-By columns. Depending on the report design, we can use as many group-by fields as needed. The structure is flexible, so additional groups can be easily added later without changing the overall logic.
Initially, each is assigned an empty string (”) so that if a group isn’t used, it won’t cause an error later when building the SQL.
3.Assigning Group Fields Dynamically:
if (str.length > 0){ group3 = str[0]; }
if (str.length > 1){ group4 = str[1]; }
This logic checks how many group-by fields the user has passed.
Based on the count, the script assigns those fields (from respective array index) to corresponding variables.
4. OrderBy Parameter Handling:
String b = "${orderby}";
if (b.contains("ACCT_NO")) {
b = b.replace("ACCT_NO", "acct_sort_order,ACCT_NO");
}
Retrieves the ${orderby} parameter for sorting.
If the user sorts by Account Number, the code also includes acct_sort_order before it — ensuring that sorting is done based on a custom logic (Asset, Liability, etc.).
5. Dynamic Where Clause:
String c = "${dynamicWhere}";
Reads the dynamicWhere parameter — which can hold runtime filter conditions.
For example, if the user applies a filter like Account Type = ‘Asset’, it will be included in the SQL WHERE clause dynamically.
6. Dynamic SQL Query Generation:
Builds the final SQL query string dynamically.
Includes:
- ExportFormat and DetailsOnly parameters (used for conditional display in the report).
- Group fields (group3,group4) to support dynamic grouping.
- A CTE (WITH clause) that defines an alias acct_info for account categorization logic.
7. Main Query Logic:
Joins multiple tables to fetch header, detail, customer, and account information.
Applies date filters and any additional filters from the dynamicWhere clause.
Includes logic to mask customer email and phone numbers for privacy.
8. Order and Return:
ORDER BY " + a + "," + b;
return finalSQL;
This ensures that the final report output is organized according to user-selected grouping and sorting preferences.
Finally, the completed query string is returned by the function
Overall, this Groovy-based approach significantly enhances the flexibility, maintainability, and reusability of the report. It ensures that a single report design can adapt to multiple use cases and user preferences—all driven by parameters, not hard-coded SQL changes.
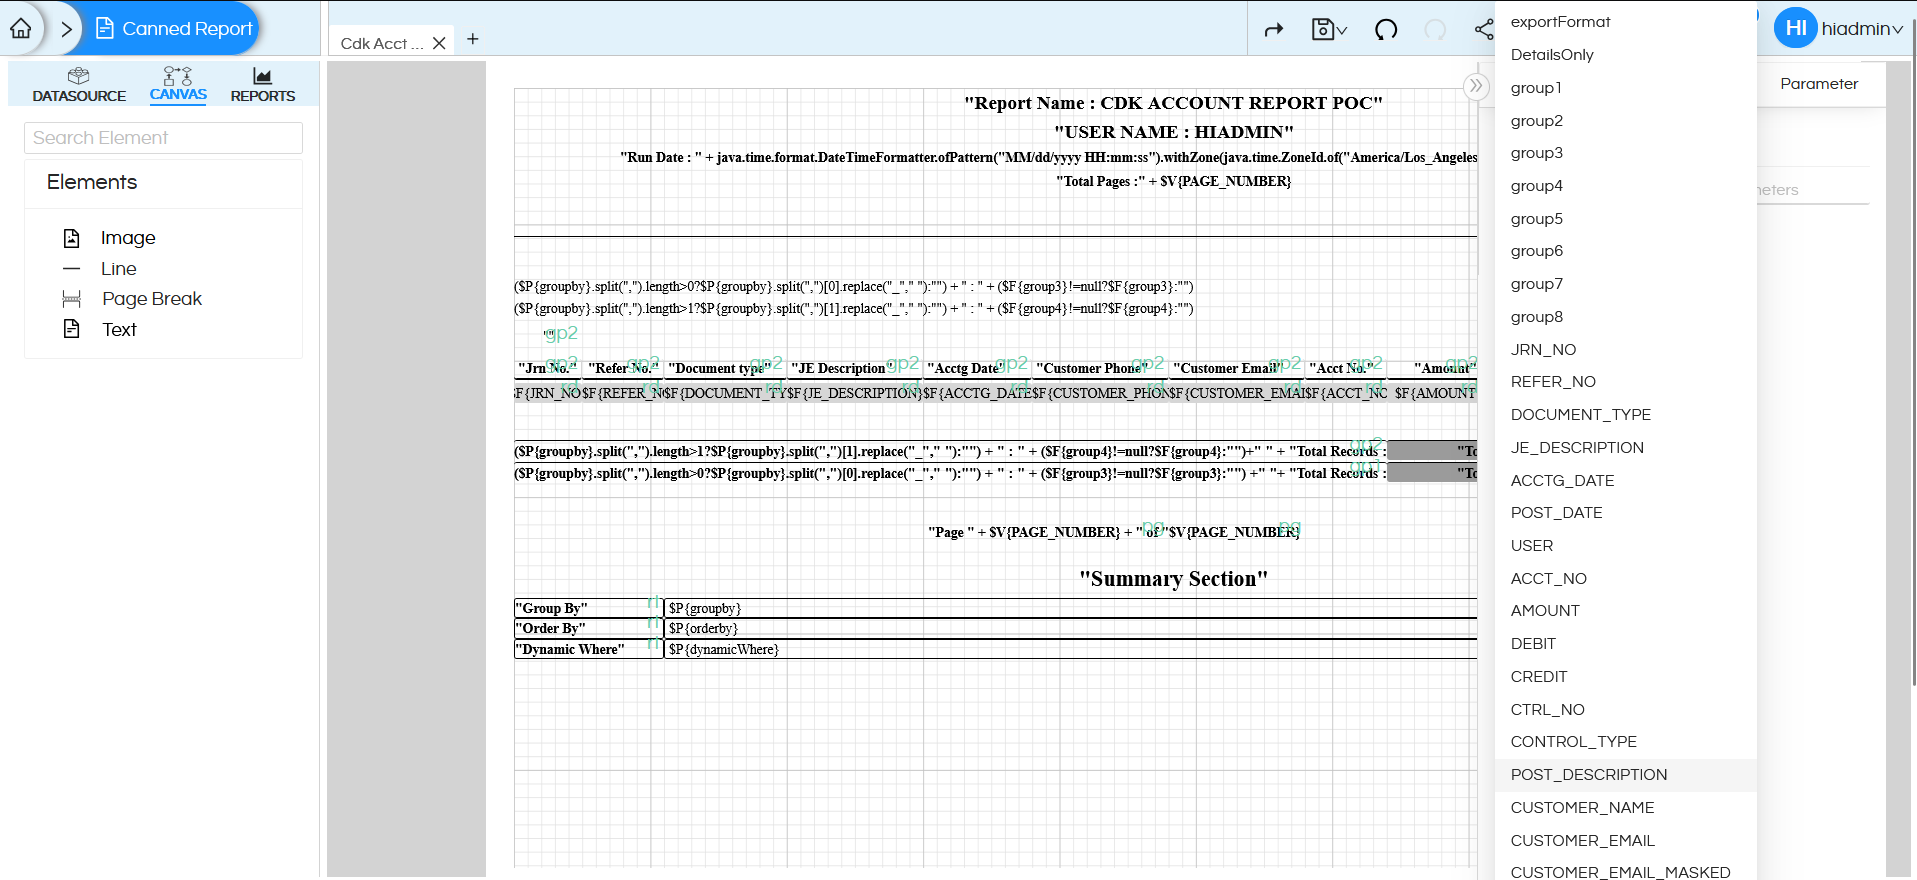
After executing the query, go to the Canvas and select the query that was created in the Data Source pane.
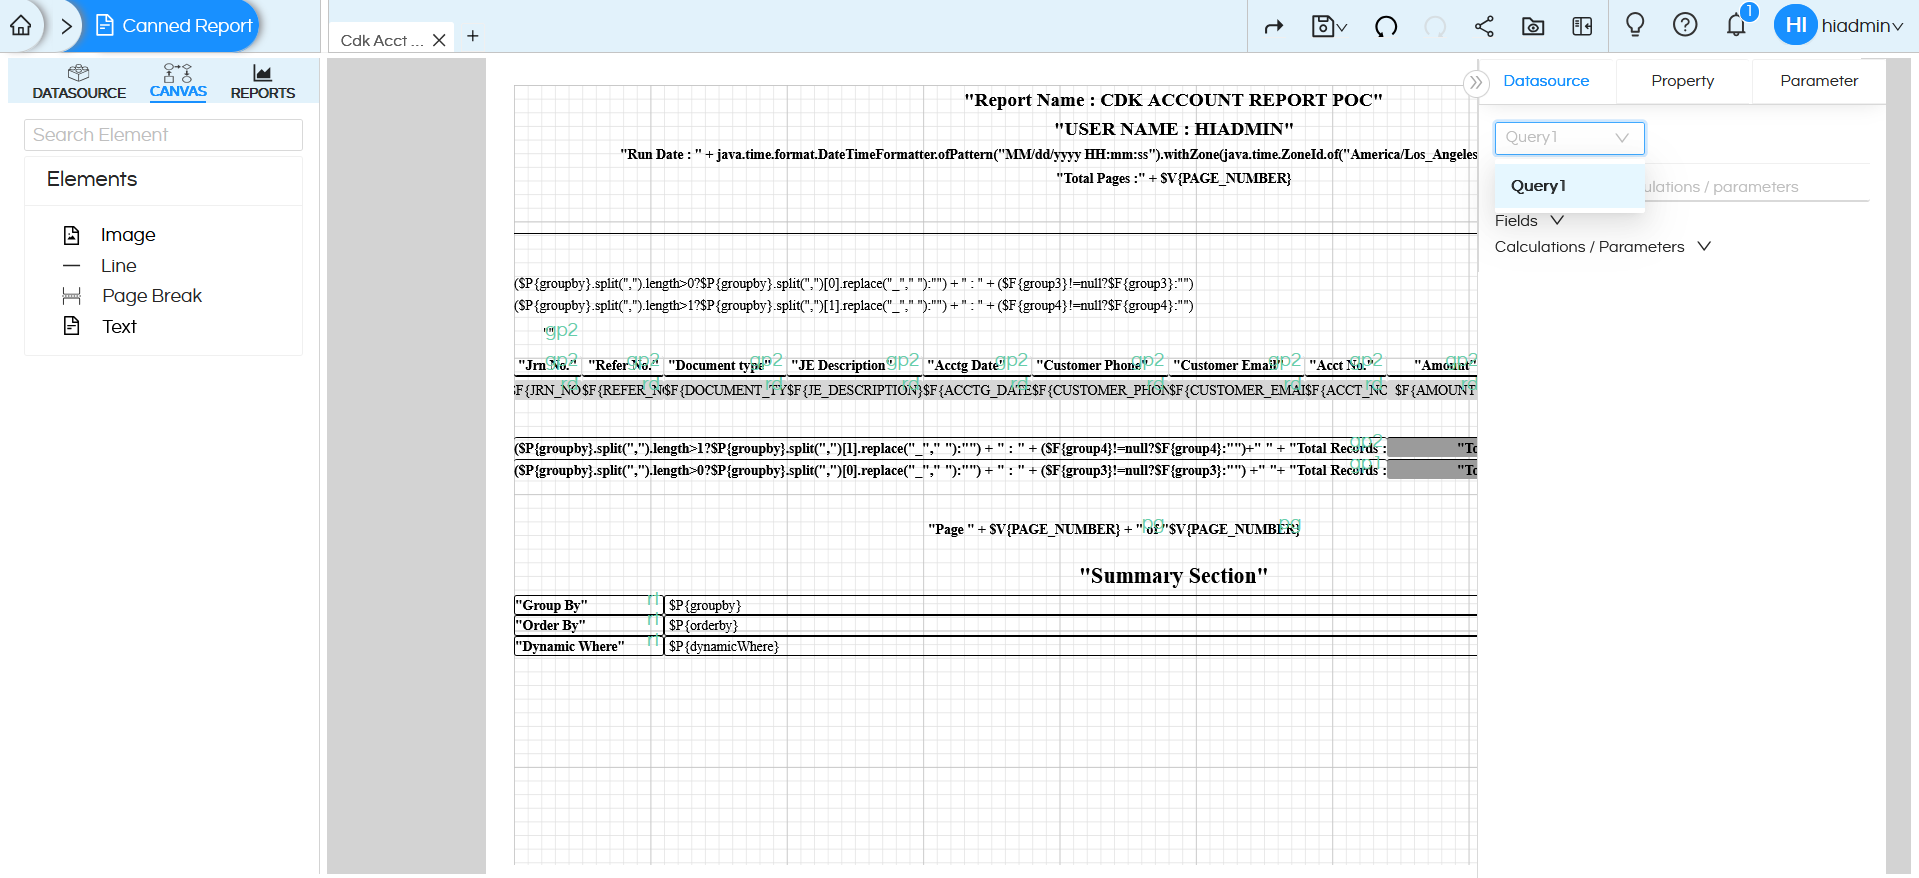
Only after adding the query to the canvas will you be able to view all the fields and parameters associated with it.
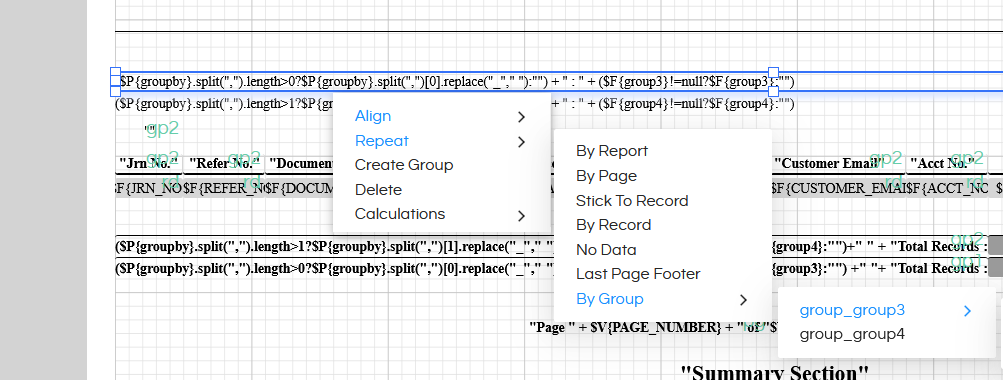
You can create different groups and then repeat components for each group.
You can create a group for a field by right clicking on the field and clicking on Create Group.
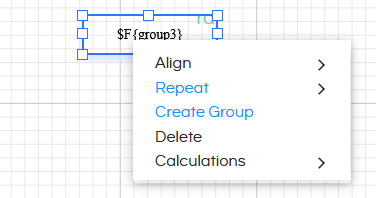
If at least one group is created, the “Repeat Options” on right click also contain “Repeat by Group” option. When a particular component is set to “Repeat by Group”, then the value is calculated and repeated for each value in the result set of the group.
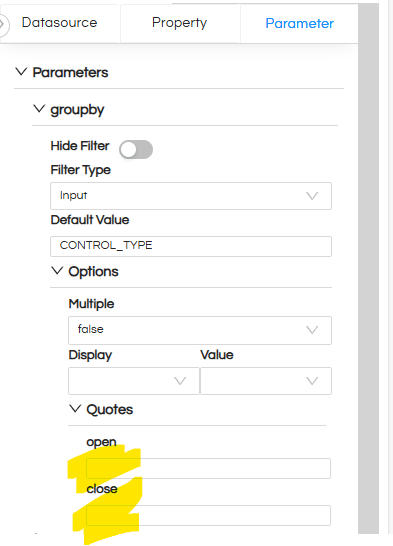
Parameters Setup
We need to setup the parameters so that users will select the values and that will accordingly dynamically go to those fields like groupby, ordery etc.
The parameters groupby, orderby , dynamicWhere are special parameters which require us to do additional setting to avoid enclosing characters being add to them. For all these parameters, remove the Quotes so that the value set for the parameter gets passed as-is, without getting enclosed in any quotes.
1. Dynamic Grouping and Ordering:
To achieve this functionality, I have created parameters such as groupby and orderby.
These parameters enhance flexibility by allowing users to dynamically modify how data is grouped and sorted without making any changes to the underlying report configuration or SQL logic.
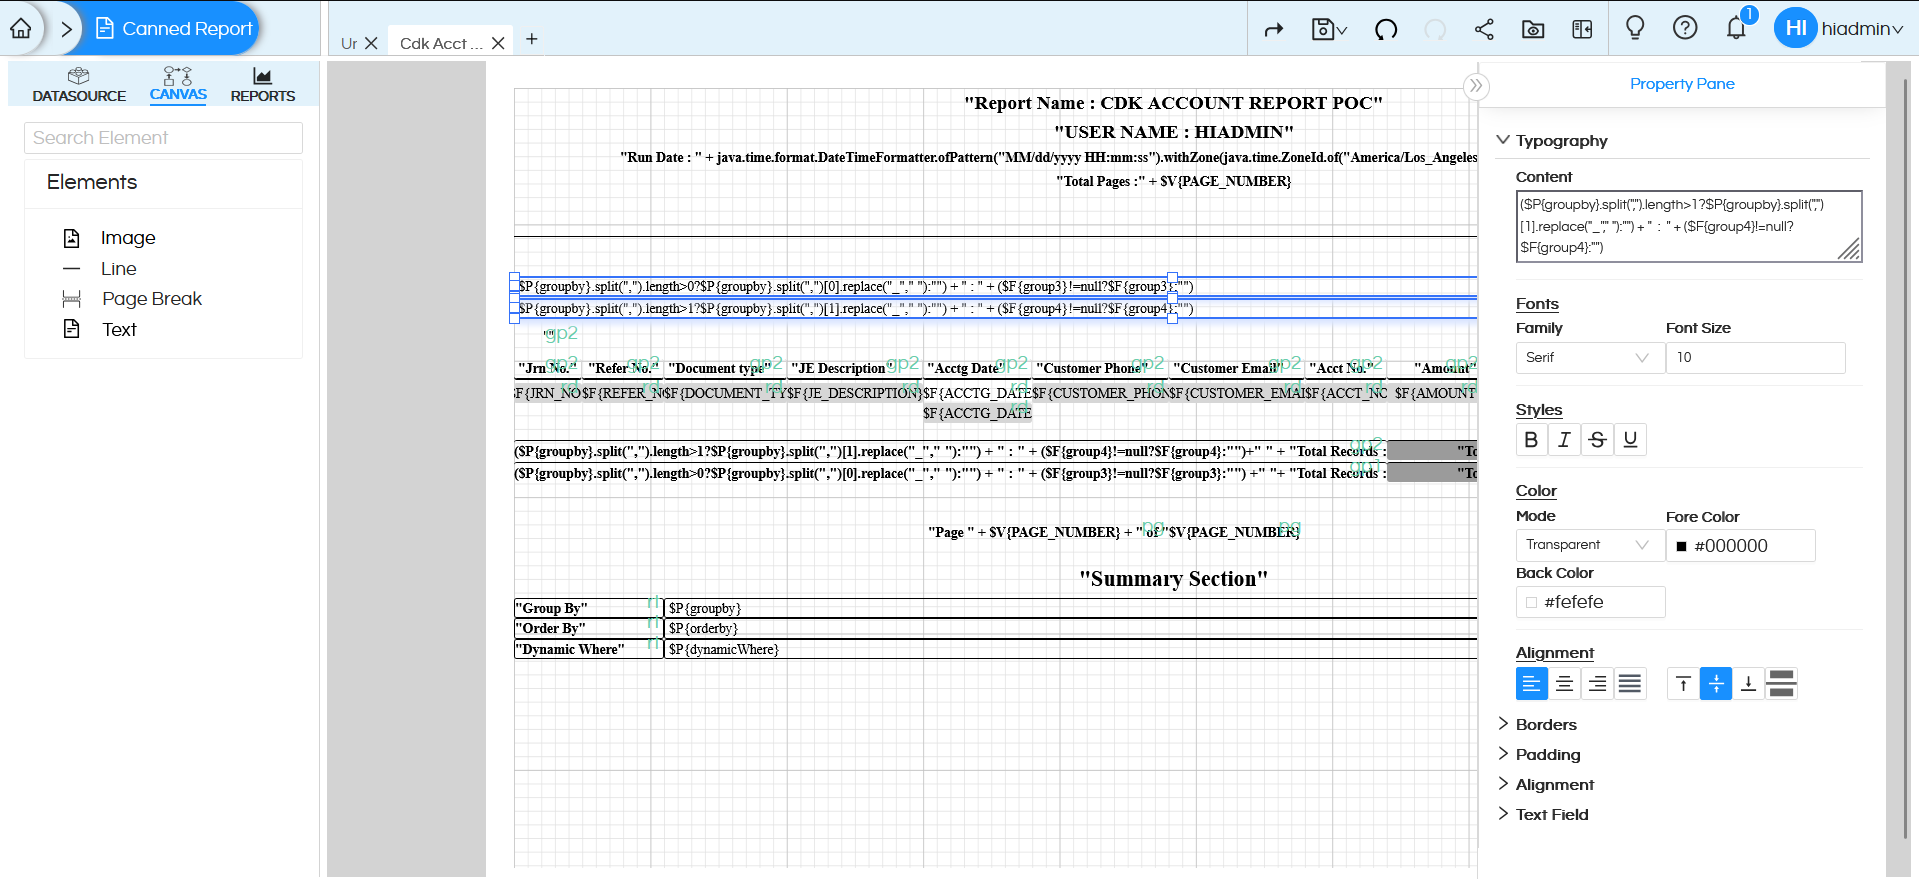
In this example, we have created two group fields within the report canvas to organize the data effectively. These groups are directly linked to the Groovy parameters (group3 and group4) defined in the script.
When the report runs, the values passed to the groupBy parameter are captured by the Groovy script and mapped to group3 and group4. These values are then incorporated into the finalSQL, ensuring the data is grouped dynamically in the report output.
The script processes these parameters and dynamically builds the SQL statement before execution, enabling fully customizable and interactive reporting
