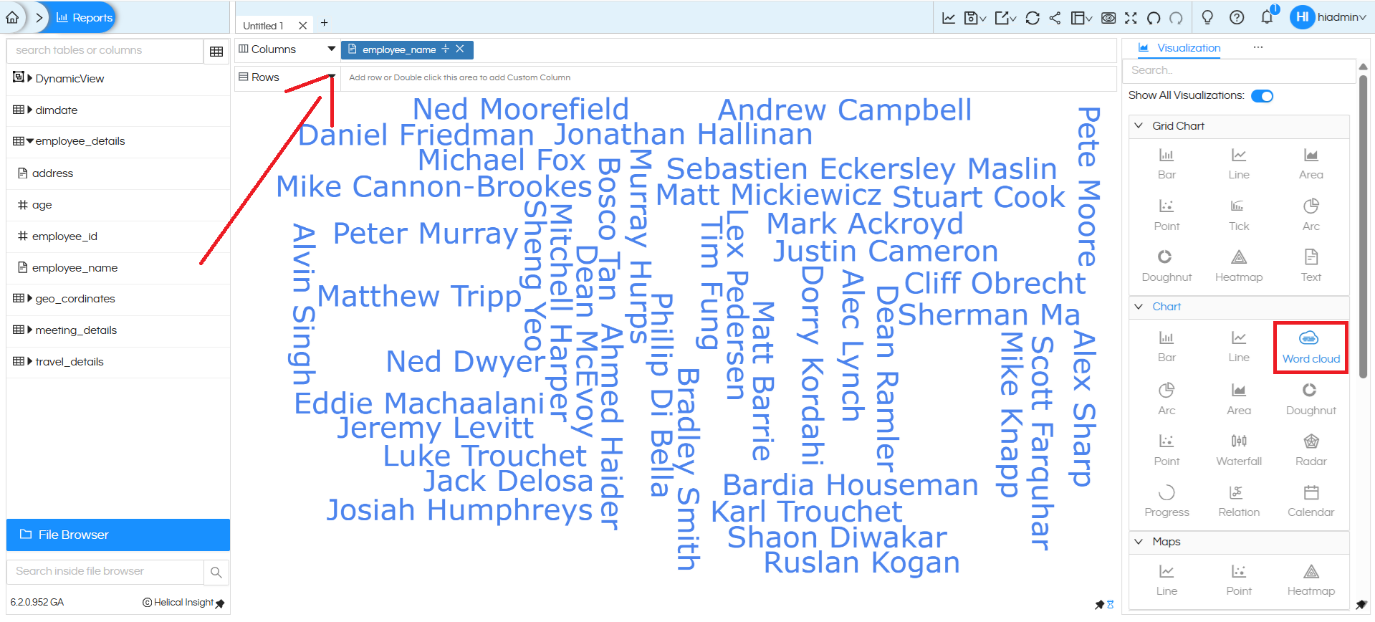
A Word Cloud in Helical Insight can be created by simply dragging a dimension (which appears in blue when added) into the Columns shelf. As shown in the image above, the employee_name dimension is placed in the Columns section. From the Visualization panel on the right, the Text option under the Chart category is selected.

Once the Text chart is applied, all values of the selected dimension—such as employee names
(e.g., Karl Trouchet, Herbert Yeung, Luke Trouchet, etc.)—are displayed as a word cloud in the report area.

Word Cloud

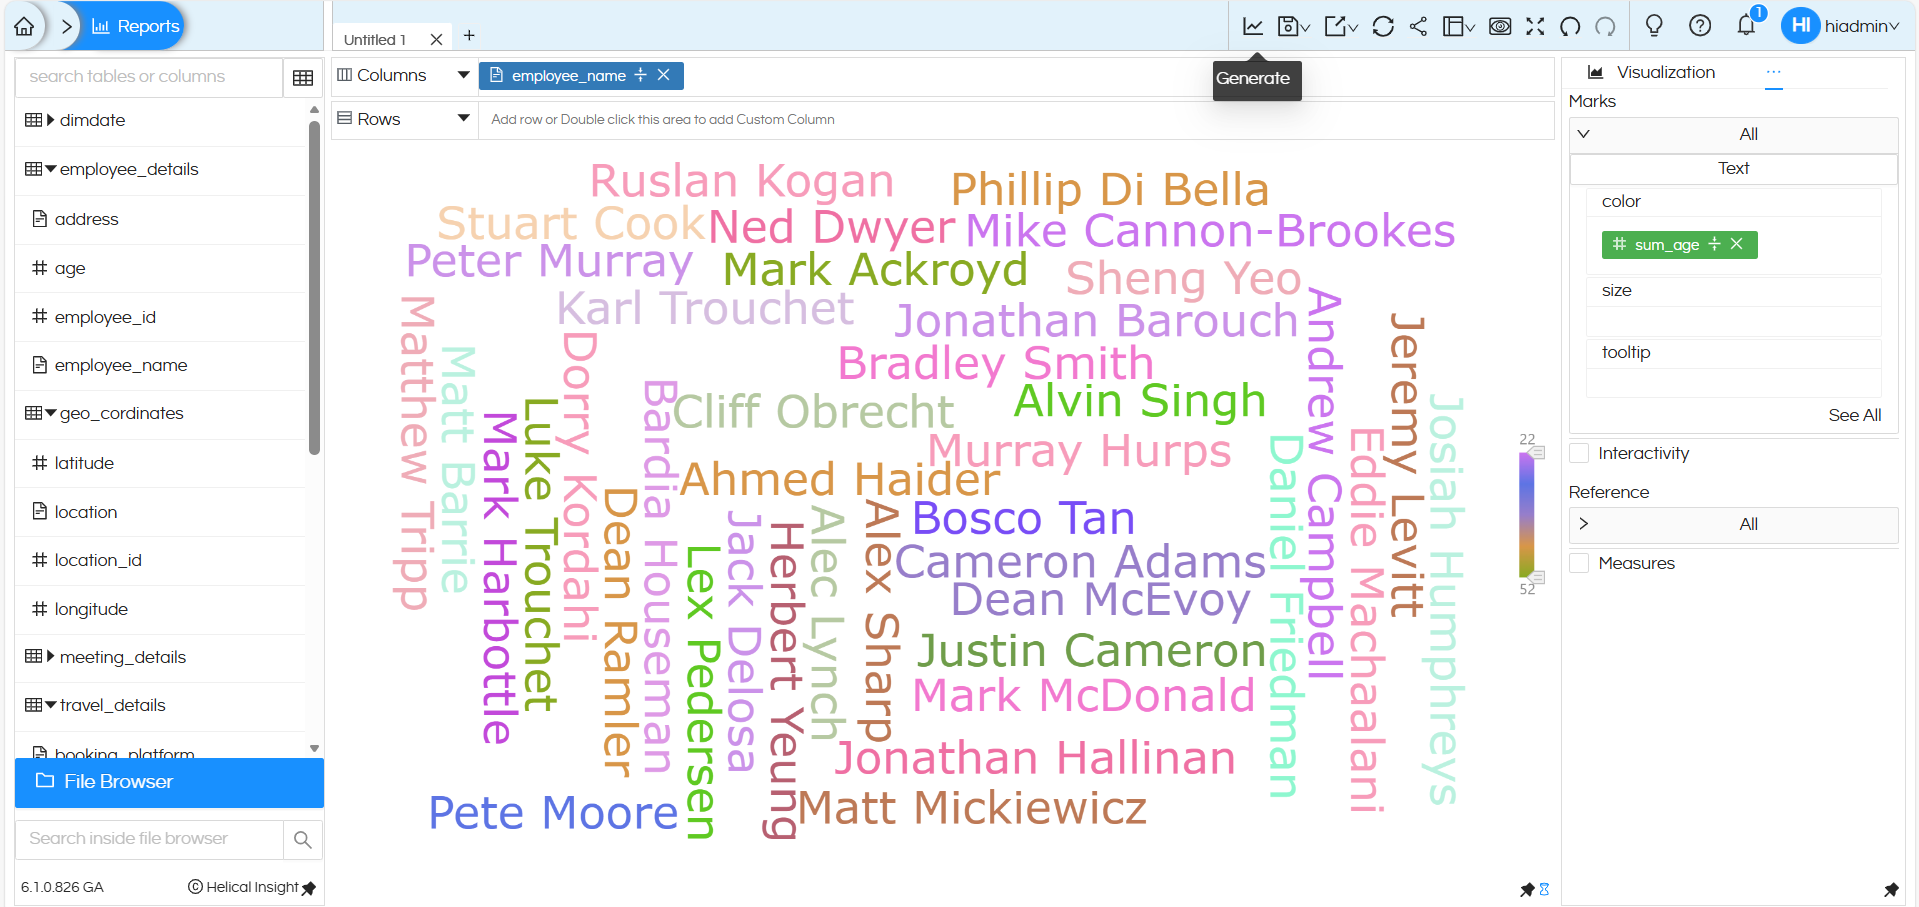
We can apply Marks properties to further change the size, color and other properties of the created word cloud. As shown in the below image navigate to Marks → Color section on the right side, the Age field is placed in the Color shelf.

Word Cloud

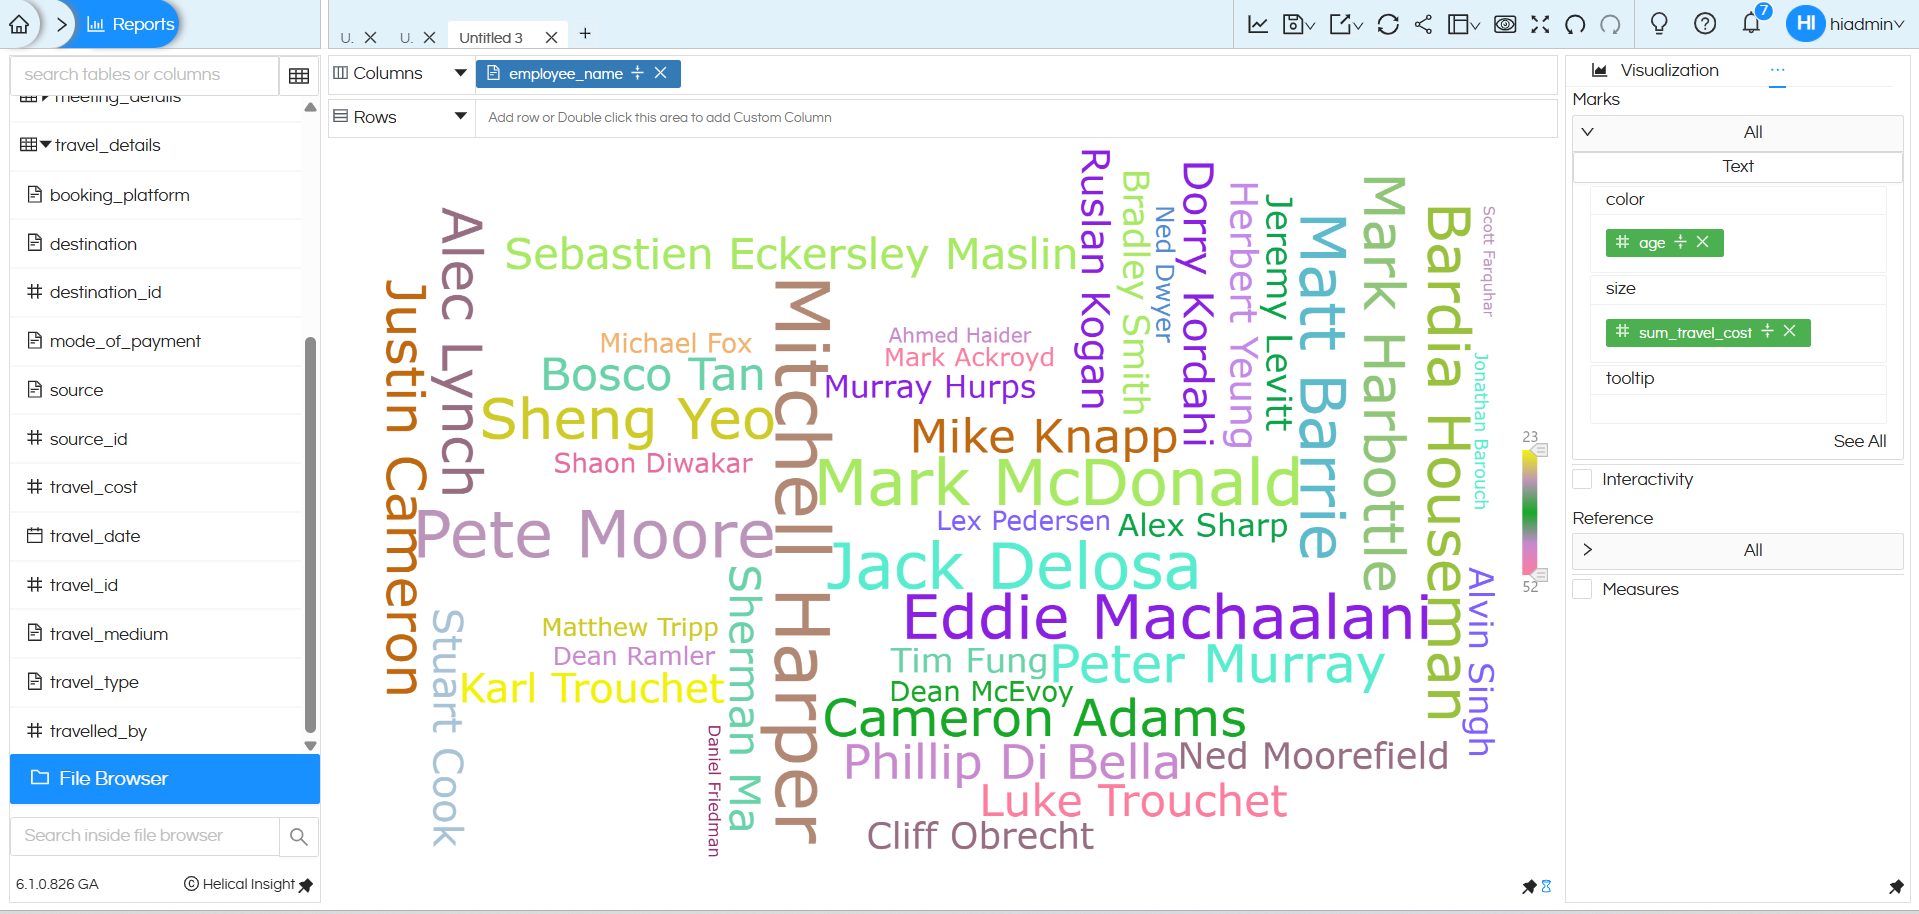
In this Below Word Cloud visualization, the size of each word is driven by a measure, while the color continues to represent Age of Employee.
As shown in the Marks → Size section, the measure sum_travel_cost is placed in the Size shelf.

Because of this configuration, the size of each word varies based on the total travel cost value associated with it. Categories with higher travelled-by values appear larger, making them more prominent in the word cloud, while categories with lower values appear smaller.

Word Cloud

Reach out on support@helicalinsight.com in case of any more questions.

Leave a Reply

Helical Insight’s self-service capabilities is one to reckon with. It allows you to simply drag and drop columns, add filters, apply aggregate functions if required, and create reports and dashboards on the fly. For advanced users, the self-service component has ability to add javascript, HTML, HTML5, CSS, CSS3 and AJAX. These customizations allow you to create dynamic reports and dashboards. You can also add new charts inside the self-service component, add new kind of aggregate functions and customize it using our APIs.
Helical Insight, via simple browser based interface of Canned Reporting module, also allows to create pixel perfect printer friendly document kind of reports also like Invoice, P&L Statement, Balance sheet etc.
If you have a product, built on any platform like Dot Net or Java or PHP or Ruby, you can easily embed Helical Insight within it using iFrames or webservices, for quick value add through instant visualization of data.
Being a 100% browser-based BI tool, you can connect with your database and analyse across any location and device. There is no need to download or install heavy memory-consuming developer tools – All you need is a Browser application! We are battle-tested on most of the commonly used browsers.
We have organization level security where the Superadmin can create, delete and modify roles. Dashboards and reports can be added to that organization. This ensures multitenancy.
A first-of-its-kind Open-Source BI framework, Helical Insight is completely API-driven. This allows you to add functionalities, including but not limited to adding a new exporting type, new datasource type, core functionality expansion, new charting in adhoc etc., at any place whenever you wish, using your own in-house developers.
It handles huge volumes of data effectively. Caching, Pagination, Load-Balancing and In-Memory not only provides you with amazing experience, but also and does not burden the database server more than required. Further effective use of computing power gives best performance and complex calculations even on the big data even with smaller machines for your personal use. Filtering, Sorting, Cube Analysis, Inter Panel Communication on the dashboards all at lightning speed. Thereby, making best open-source Business Intelligence solution in the market.
With advance NLP algorithm, business users simply ask questions like, “show me sales of last quarter”, “average monthly sales of my products”. Let the application give the power to users without knowledge of query language or underlying data architecture
Our application is compatible with almost all databases, be it RDBMS, or columnar database, or even flat files like spreadsheets or csv files. You can even connect to your own custom database via JDBC connection. Further, our database connection can be switched dynamically based on logged in users or its organization or other parameters. So, all your clients can use the same reports and dashboards without worrying about any data security breech.
Our application can be installed on an in-house server where you have full control of your data and its security. Or on cloud where it is accessible to larger audience without overheads and maintenance of the servers. One solution that works for all.
Different companies have different business processes that the existing BI tools do not encompass. Helical Insight permits you to design your own workflows and specify what functional module of BI gets triggered