In this blog, we will learn how to create a Line Chart/span> in the open source BI product Helical Insight.
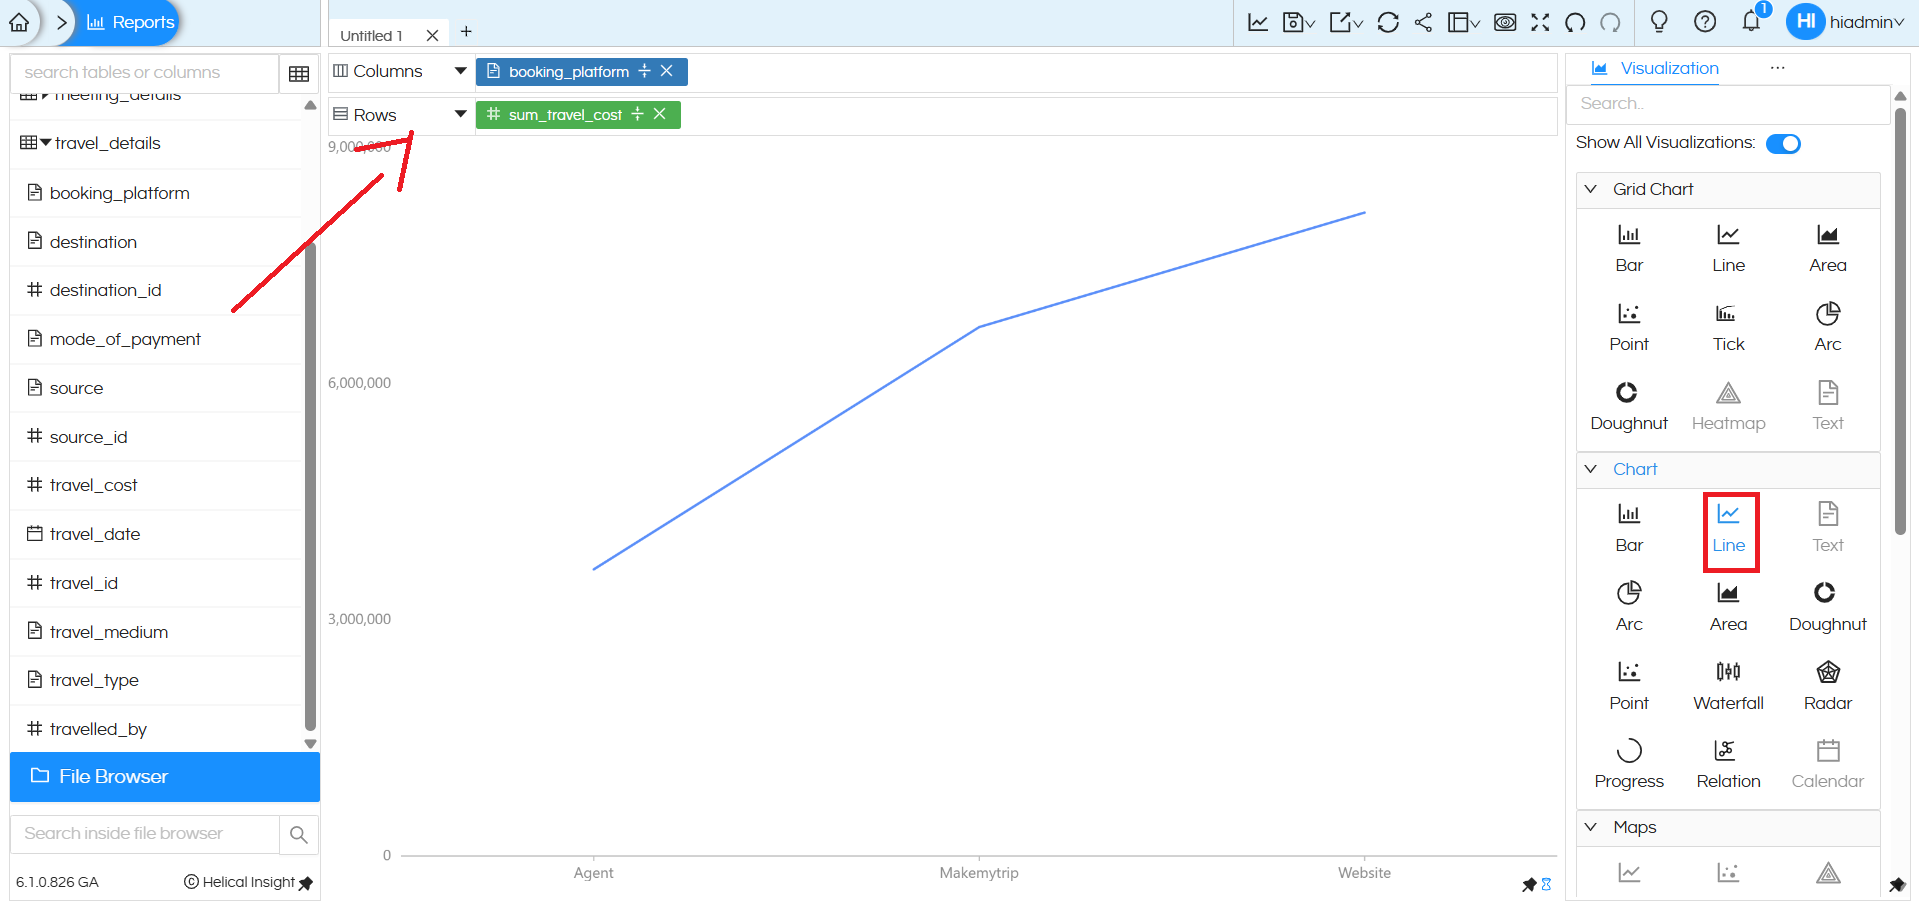
To create a Line chart in Helical Insight, you need at least one dimension and one measure. In this example, the dimension booking_platform is placed in the Columns section and the measure sum_travel_cost is placed in the Rows section. After selecting the Line option under the Chart section in the Visualization panel, the system generates a line chart.
Each point on the line represents a booking platform (Agent, Makemytrip, Website), and the position of the point on the Y-axis indicates the total travel cost for that platform. The line connects these points, making it easy to compare values and observe variations across booking platforms.
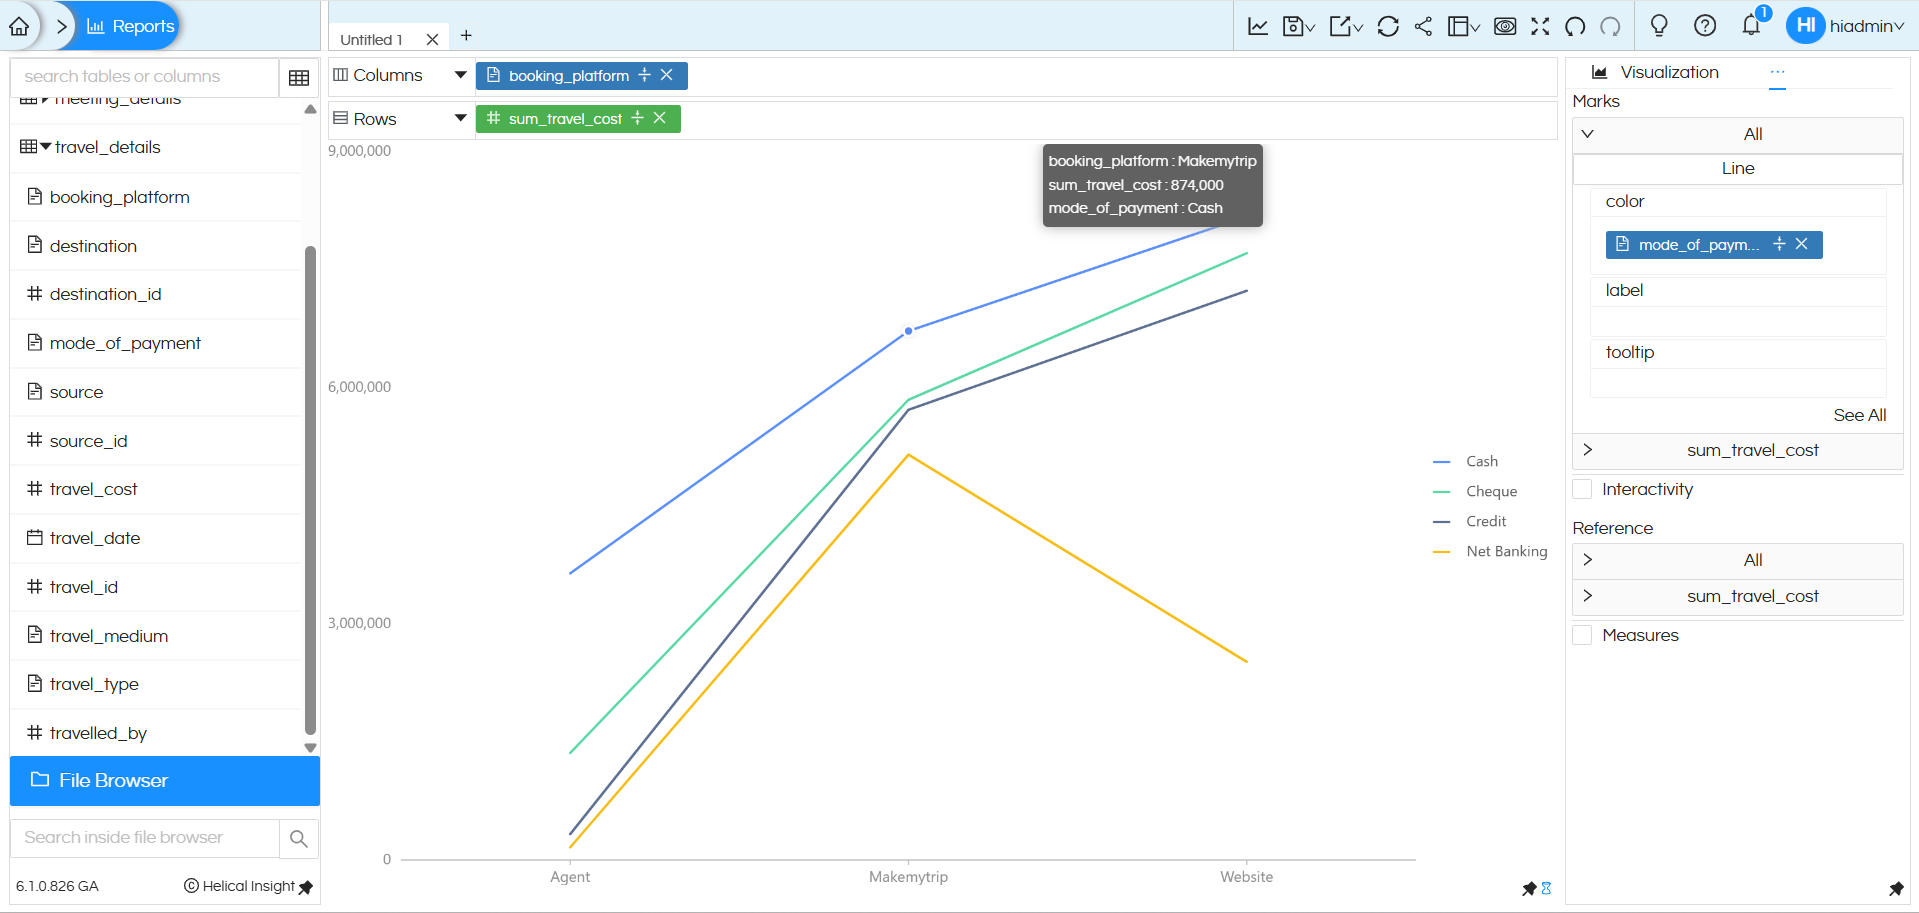
Using Color (Marks Section) – Creating Multiple Lines
By default, a single line is displayed.
To split it into multiple lines:
- Drag the dimension mode_of_payment into the Color option under the Marks section.
This automatically creates multiple lines within the same chart — one line for each payment mode (Cash, Cheque, Credit, Net Banking). Each colored line shows how travel cost varies across booking platforms for a specific payment mode.
This helps compare trends between different payment methods in a single visualization.
Line Chart Created using “Chart” Category:
A Line chart created using chart category can have one dimension in the columns, one measure and a dimension/measure in the colors section.
It will not be able to support multiple dimensions in rows and columns.
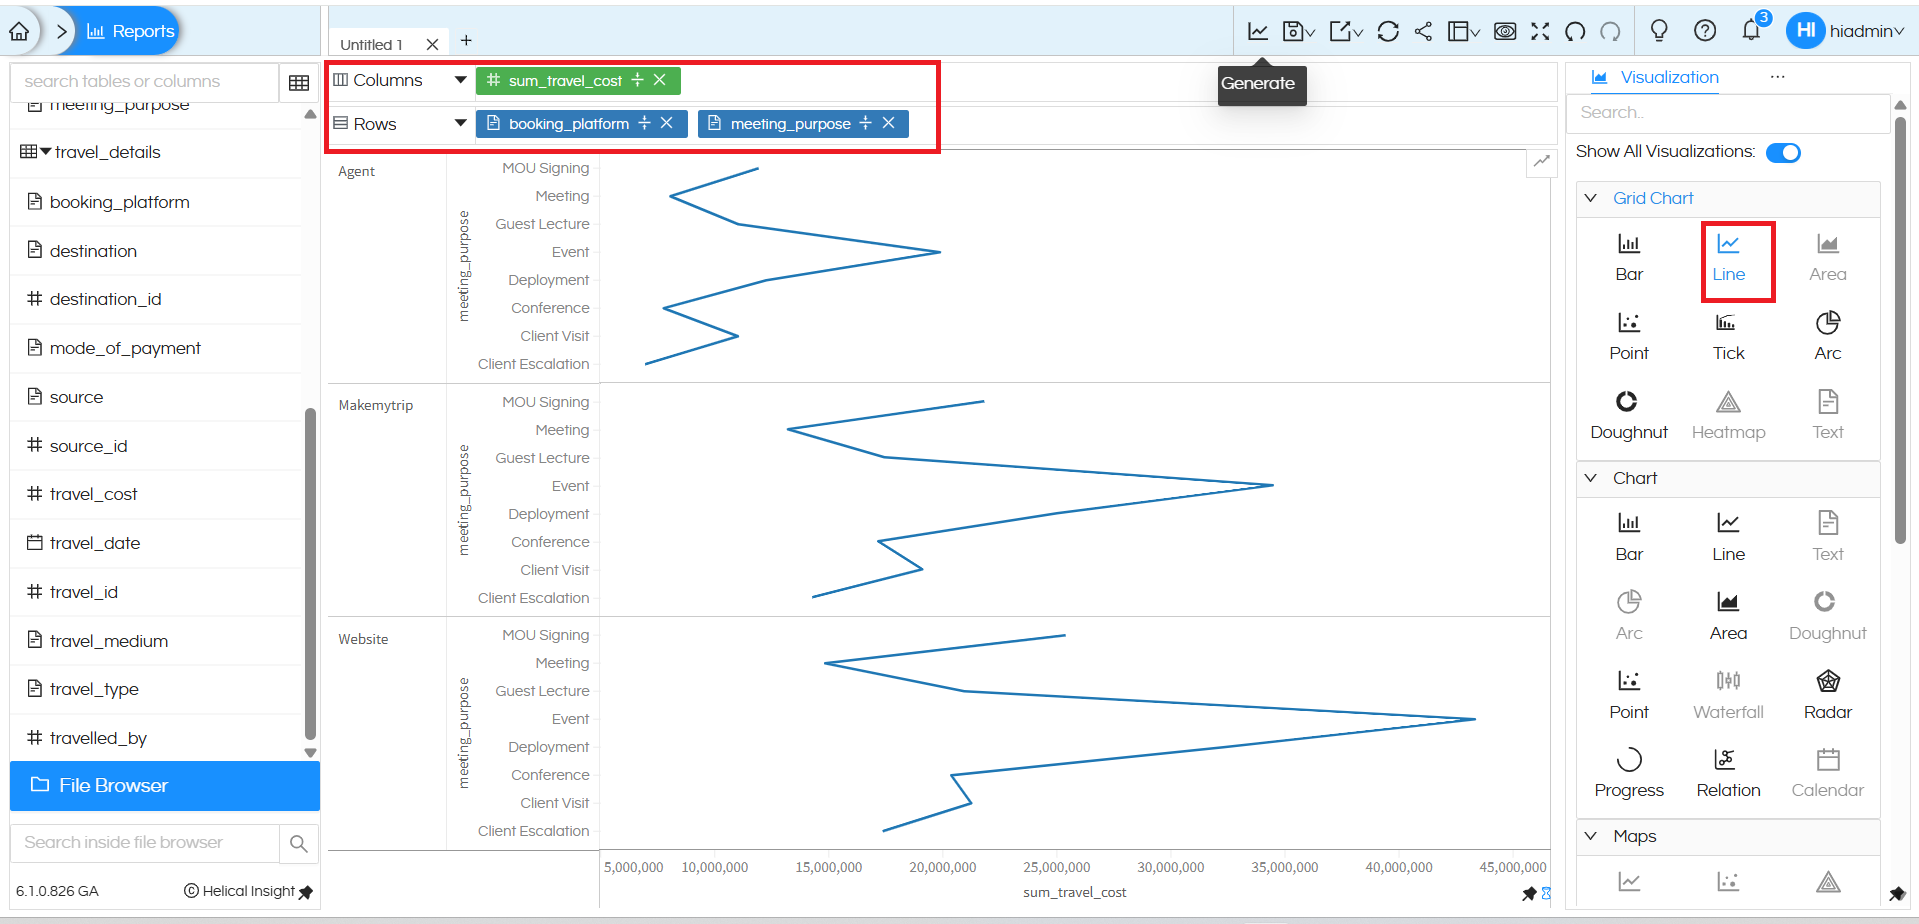
Grid Style Line Chart – Grid Chart Section
A line chart created using Grid chart category is highly flexible. It can allow users to drag any number of dimensions in both rows and columns, and accordingly it creates a sort of matrix within which the line chart gets populated. Thus it is much more flexible.
The created Line chart also supports additional customizations such as smooth edges, color palette selection, data formatting, axis configuration, caching, drill down, and drill through options.
For more Line chart customization options, refer to this guide: https://www.helicalinsight.com/line-chart-with-smooth-edges/
There are many other customization features available in Helical Insight. You can refer to our other blogs to explore them in detail.
Reach out on support@helicalinsight.com in case of any more questions.
