In the previous blog (Properties of Canned Reports) we have learn about the newly added properties options from version 6.2 of open source BI product Helical Insight. These properties are of 2 types i.e. Default/System defined and User Defined.
In this blog we will learn about some of the popular user defined properties. These properties are custom properties which can be created by the user based on specific requirements. These properties can be used to configure various behaviour, export, bands and other functionalities of canned reports.
By clicking on it, we can see various properties.
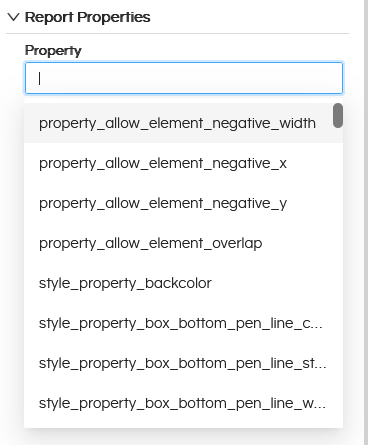
Let us look into each property in detail:
1.1. Property: allow.element.negative.width
This property controls whether a report element is allowed to have a negative width.
Value:
true or false
1.2. Property: allow.element.negative.x
This property controls whether a report element is allowed to have a negative X position.
The X position decides how far an element is placed from the left side of the report. Normally, this value should be zero or positive, meaning the element starts within the visible report area.
If the X position is negative, part (or all) of the element will start outside the left boundary of the report.
Value:
true or false
1.3. Property: allow.element.negative.y
This property controls whether a report element is allowed to have a negative Y position.
The Y position defines how far an element is placed from the top of the report. Normally, this value should be zero or positive, meaning the element appears within the visible report area. If the Y position is negative, the element starts above the top boundary of the report.
Value:
true or false
1.4. Property: allow.element.overlap
This property controls whether report elements are allowed to overlap each other. When this property is enabled, the system allows elements to be positioned on top of each other.
Value:
true or false
1.5. Property: style.backcolor
This property controls the background color of a report element or style.
It defines the color that appears behind the content (such as text or charts) of an element.
Value:
A valid color value (for example: #FFFFFF, #000000, or a supported color name)
1.6. Property: style.box.bottom.pen.lineColor
This property decides what color the bottom border of an element will be.
Value:
A valid color value (for example: #000000, #FF0000, or any supported color name)
1.7 Property: style.box.bottom.pen.lineStyle
This property decides how the bottom border line looks (solid, dashed, or dotted).
Value:
A valid line style value, such as: Solid, Dashed, Dotted
1.8. Property: style.box.bottom.pen.lineWidth
This property decides how thick the bottom border line will be.
Value:
A numeric value (for example: 0.5, 1, 2, etc.)
1.9. Property: style.box.bottomPadding
This property decides how much space is left at the bottom inside an element, between the content and the border.
Value:
A numeric value (for example: 0, 2, 5, etc.)
1.10. Property: style.box.left.pen.lineColor
This property controls the color of the left border line of a report element.
Value:
A valid color value (for example: #000000, #00FF00, or any supported color name)
1.11. Property: style.box.left.pen.lineStyle
This property decides how the left border line looks (solid, dashed, or dotted).
Value:
Solid, Dashed, or Dotted
1.12. Property: style.box.left.pen.lineWidth
This property decides how thick or thin the left border line is.
Value:
A numeric value (for example: 0.5, 1, 2)
1.13. Property: style.box.leftPadding
This property decides how much space is kept between the left border and the content inside an element.
Value:
A numeric value (for example: 0, 2, 5)
1.14. Property: style.box.padding
This property decides the overall space between the content and all sides of the border inside an element.
It applies the same padding to the top, bottom, left, and right sides, unless side-specific padding is defined separately.
Value:
A numeric value (for example: 0, 2, 5)
1.15. Property: style.box.pen.lineColor
This property decides the color of the border line of a report element.
It applies the same color to all sides of the box (top, bottom, left, and right), unless a side-specific border color is defined.
Value:
A valid color value (for example: #000000, #FF0000)
1.16. Property: style.box.pen.lineStyle
This property decides how the border line looks around a report element (solid, dashed, or dotted). It applies the same line style to all sides of the box, unless a side-specific line style is defined.
Value:
Solid, Dashed, or Dotted
1.17. Property: style.box.pen.lineWidth
This property decides how thick or thin the border line is around a report element. It applies the same line width to all sides of the box, unless a side-specific line width is defined.
Value:
A numeric value (for example: 0.5, 1, 2)
1.18. Property: style.box.right.pen.lineColor
This property decides the color of the right border line of a report element.
Value:
A valid color value (for example: #000000, #FF0000)
1.19. Property: style.box.right.pen.lineStyle
This property decides how the right border line looks (solid, dashed, or dotted).
Value:
Solid, Dashed, or Dotted
1.20. Property: style.box.right.pen.lineWidth
This property decides how thick the right border line is.
Value:
A numeric value (for example: 0.5, 1, 2)
1.21. Property: style.box.rightPadding
This property decides how much space is kept between the right border and the content inside an element.
Value:
A numeric value (for example: 0, 2, 5)
1.22. Property: style.box.top.pen.lineColor
This property decides the color of the top border line of a report element.
Value:
A valid color value (for example: #000000, #FF0000)
1.23. Property: style.box.top.pen.lineStyle
This property decides how the top border line looks (solid, dashed, or dotted).
Value:
Solid, Dashed, or Dotted
1.24. Property: style.box.top.pen.lineWidth
This property decides how thick the top border line is.
Value:
A numeric value (for example: 0.5, 1, 2)
1.25. Property: style.box.topPadding
This property decides how much space is kept between the top border and the content inside an element.
Value:
A numeric value (for example: 0, 2, 5)
1.26. Property: style.fill
This property decides whether the background color (fill) is applied to a report element.
If enabled, the element is filled with the background color defined in the style. If disabled, the background remains transparent.
Value:
true or false
1.27. Property: style.fontName
This property decides which font is used to display the text in a report element.
It controls the appearance of text by defining the font family.
Value:
A valid font name (for example: Arial, Times New Roman, Helvetica)
1.28. Property: style.fontSize
This property decides the size of the text in a report element.
Value:
A numeric value (for example: 8, 10, 12, 14)
1.29. Property: style.forecolor
This property decides the color of the text or content inside a report element.
Value:
A valid color value (for example: #000000, #FF0000)
1.30. Property: style.hImageAlign
This property decides how an image is aligned horizontally inside a report element.
Value:
Left, Center, or Right
1.31. Property: style.hTextAlign
This property decides how text is aligned horizontally inside a report element.
Value:
Left, Center, Right, or Justified
1.32. Property: style.isBlankWhenNull
This property decides whether an element is left blank when its value is null.
If enabled, the element will show nothing when there is no data. If disabled, it may display null or a default value.
Value:
true or false
1.33. Property: style.isBold
This property decides whether the text is displayed in bold.
Value:
true or false
1.34. Property: style.isItalic
This property decides whether the text is displayed in italic.
Value:
true or false
1.35. Property: style.isPdfEmbedded
This property decides whether the font used in the report is embedded inside the PDF.
If enabled, the PDF will include the font within the file, ensuring the text looks the same on all systems. If disabled, the PDF uses system fonts, which may look different if the font is not available.
Value:
true or false
1.36. Property: style.isStrikeThrough
This property decides whether the text is shown with a line through it.
Value:
true or false
1.37. Property: style.isUnderline
This property decides whether the text is underlined.
Value:
true or false
1.38. Property: style.markup
This property decides whether the text supports special formatting (markup) like bold, italic, or HTML-style tags.
When markup is enabled, the text can contain formatting tags and they will be applied while displaying the report. When disabled, the text is shown as plain text.
Value:
None, Styled, or HTML
1.39. Property: style.mode
This property decides how the style is applied to a report element.
It controls whether the element uses its own style settings or inherits styles from a parent or default style.
Value:
Opaque or Transparent
1.40. Property: style.paragraph.firstLineIndent
This property decides how much the first line of a paragraph is indented from the left side.
It adds extra space only to the first line of the text, similar to how paragraphs start in books or documents.
Value:
A numeric value (for example: 0, 5, 10)
1.41. Property: style.paragraph.leftIndent
This property decides how much space is added to the left side of the paragraph.
It moves the entire paragraph slightly to the right by adding space from the left margin.
Value:
A numeric value (for example: 0, 5, 10)
1.42. Property: style.paragraph.lineSpacing
This property decides the vertical space between lines of text in a paragraph.
It controls how close or far apart the text lines appear.
Value:
A numeric value (for example: 1, 1.5, 2)
1.43. Property: style.paragraph.lineSpacingSize
This property decides the exact amount of extra space added between lines of text.
It works together with line spacing to control how much vertical space is added between each line.
Value:
A numeric value (for example: 0, 2, 4)
1.44. Property: style.paragraph.rightIndent
This property decides how much space is added to the right side of the paragraph.
It moves the paragraph inward from the right margin, keeping text away from the edge.
Value:
A numeric value (for example: 0, 5, 10)
1.45. Property: style.paragraph.spacingAfter
This property decides how much space is added after a paragraph.
It creates extra space below the paragraph, helping to separate it from the next content.
Value:
A numeric value (for example: 0, 5, 10)
1.46. Property: style.paragraph.spacingBefore
This property decides how much space is added before a paragraph.
It creates extra space above the paragraph, helping to separate it from previous content.
Value:
A numeric value (for example: 0, 5, 10)
1.47. Property: style.paragraph.tabStopWidth
This property decides how wide a tab space is inside a paragraph.
It controls the distance the cursor or text moves when a Tab is used.
Value:
A numeric value (for example: 0, 20, 40)
1.48. Property: style.pattern
This property decides the display pattern or format of a value, especially for numbers and dates.
It controls how the data is shown, not the actual value. For example, it can format numbers with decimals or dates in a specific style.
Value:
A valid pattern string (for example: #,##0.00, dd-MM-yyyy)
1.49. Property: style.pdfEncoding
This property decides which character encoding is used for text in a PDF report.
It ensures that characters (such as special symbols or non-English letters) are displayed correctly in the PDF.
Value:
A valid PDF encoding value (for example: Identity-H, Cp1252)
1.50. Property: style.pdfFontName
This property decides which font is used specifically when the report is exported to PDF.
It allows you to define a PDF-specific font so that text appears correctly and consistently in PDF output.
Value:
A valid PDF font name (for example: Helvetica, Times-Roman, Courier)
1.51. Property: style.pen.lineColor
This property decides the color of the line (pen) used to draw an element.
Value:
A valid color value (for example: #000000, #FF0000)
1.52. Property: style.pen.lineStyle
This property decides how a line is drawn (solid, dashed, or dotted).
Value:
Solid, Dashed, or Dotted
1.53. Property: style.pen.lineWidth
This property decides how thick or thin a line is.
Value:
A numeric value (for example: 0.5, 1, 2)
1.54. Property: style.radius
This property decides how rounded the corners of an element are.
A higher value makes the corners more rounded, while a lower value keeps them sharp.
Value:
A numeric value (for example: 0, 5, 10)
1.55. Property: style.rotation
This property decides the direction in which the content is rotated.
It is used to rotate text or elements, such as displaying text vertically or at an angle.
Value:
None, Left, Right, or UpsideDown
1.56. Property: style.scaleImage
This property decides how an image is resized (scaled) to fit inside a report element.
It controls whether the image keeps its original size, stretches to fit, or scales proportionally.
Value:
None, FillFrame, RetainShape, or Clip
1.57. Property: style.vImageAlign
This property decides how an image is aligned vertically inside a report element.
Value:
Top, Middle, or Bottom
1.58. Property: style.vTextAlign
This property decides how text is aligned vertically inside a report element.
Value:
Top, Middle, Bottom, or Justified
1.59. Property: styles.inherit.from.default
This property decides whether a style should inherit settings from the default style.
If enabled, the style automatically uses values from the default style for any properties that are not explicitly defined. If disabled, only the values defined in the current style are applied.
Value:
true or false
1.60. Property: awt.check.available.printers
This property decides whether the system should check for available printers using AWT (Abstract Window Toolkit).
If enabled, the system checks the machine for installed printers before performing print-related operations. If disabled, the system skips this check, which can help avoid delays or errors in environments without printers (like servers).
Value:
true or false
1.61. Property: awt.ignore.missing.font
This property decides what happens when a required font is not available on the system.
If enabled, the system ignores the missing font and uses a default or fallback font instead. If disabled, the report generation or rendering may fail when the specified font is not found.
Value:
true or false
1.62. Property: awt.indent.first.line
This property decides whether the first line of text is indented when using AWT-based text rendering.
If enabled, the first line of a paragraph is indented slightly from the left, similar to paragraph formatting in documents. If disabled, all lines start at the same position.
Value:
true or false
1.63. Property: awt.justify.last.line
This property decides whether the last line of a paragraph is justified when text alignment is set to justified.
If enabled, the last line is stretched to align with both the left and right margins. If disabled, the last line remains left-aligned, which is the more common behavior.
Value:
true or false
1.64. Property: awt.superscript.fix.enabled
This property decides whether a fix is applied for superscript text rendering when using AWT.
If enabled, superscript text (like ¹, ², or exponents) is displayed more accurately and aligned properly. If disabled, superscript text may appear misaligned or incorrectly positioned.
Value:
true or false
1.65. Property: big.decimal.minimum.precision
This property decides the minimum number of digits to keep after the decimal point for BigDecimal values.
If the number has fewer decimal places than this value, extra zeros are added to meet the minimum precision. This helps keep numeric values consistently formatted in reports.
Value:
A numeric value (for example: 0, 2, 4)
1.66. Property: file.buffer.os.memory.threshold
This property decides how much data is kept in memory before it is written to the operating system (OS) during file operations.
When the buffer size reaches this threshold, data is flushed from memory to disk. This helps balance memory usage and file I/O performance.
Value:
A numeric value (size in bytes, for example: 1024, 8192, 65536)
1.67. Property: font.use.own.temp.file
This property decides whether fonts should use their own temporary files during processing.
If enabled, each font is handled using a separate temporary file, which can help avoid conflicts. If disabled, shared temporary files may be used.
Value:
true or false
1.68. Property: image.dpi
This property decides the resolution (quality) of images used in the report.
A higher DPI makes images clearer and sharper, while a lower DPI makes them lighter but less detailed.
Value:
A numeric value (for example: 72, 96, 300)
1.69. Property: jrxml.writer.exclude.properties.{suffix}
This property decides which properties should be excluded when writing (exporting) a JRXML file.
The {suffix} is used to group or identify specific properties that should not be written into the generated JRXML. This helps keep the JRXML clean by removing unwanted or internal configuration properties.
Value:
A comma-separated list of property names (for example: property1,property2)
1.70. Property: jrxml.writer.exclude.uuids
This property decides whether element UUIDs should be excluded when writing (exporting) a JRXML file.
If enabled, unique identifiers (UUIDs) are not written into the JRXML, resulting in a cleaner and more readable file. If disabled, UUIDs are included.
Value:
true or false
Reach out on support@helicalinsight.com in case of any more questions.
