In our other blog, we have learnt the various data formatting options for formatting data (like numbers, date, time) using the various prebuilt options.

From Helical Insight version 6.2.0.952 GA, a new property has been introduced that enables more advanced and complex custom formatting for applicable columns, this is especially useful if the formatting required is not present directly from the UI option. This document explains where and how this functionality can be used.

Some use cases are like

  • Show negative numbers in braces like instead of -17, show as (17)
  • Show positive numbers in green color, negative in red etc
  • Show date data with a prefix and a custom date type, like : “Date is : Monday 17 April 2026”

We are making use of this Javascript library in this Custom Formatting options, to learn more, refer to the official repository: https://github.com/borgar/numfmt

How to Apply:

Hover over the three-dot menu available on the right side of the visualization title, then select Properties from the dropdown menu.

Custom Formatting in Properties

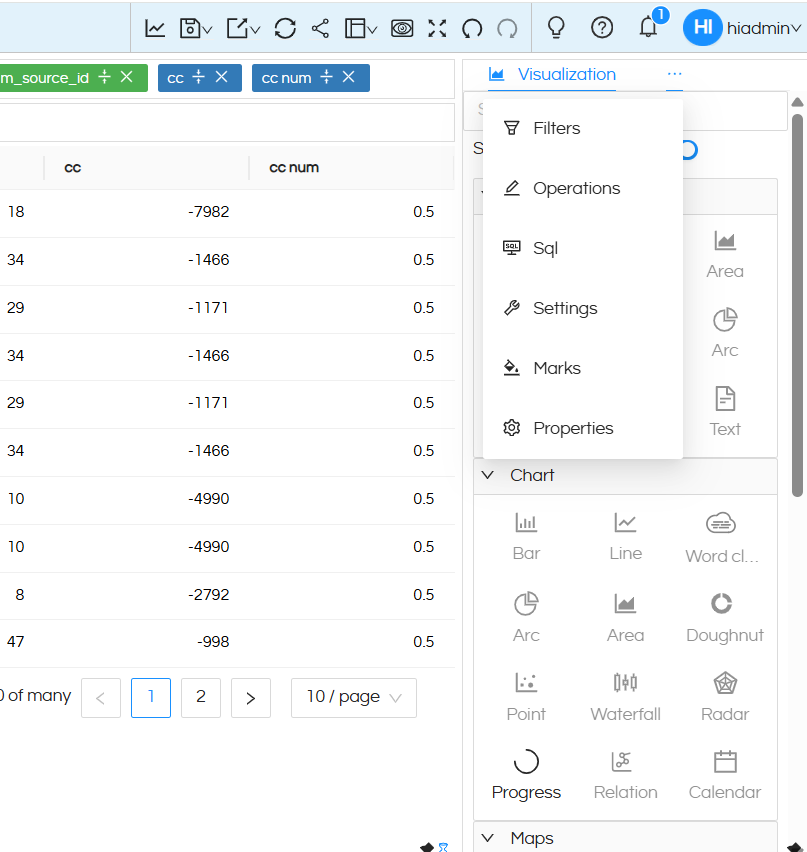
Once you are in the Properties section, hover over the three-dot menu again and select Format from the dropdown options.

Custom Formatting in Properties

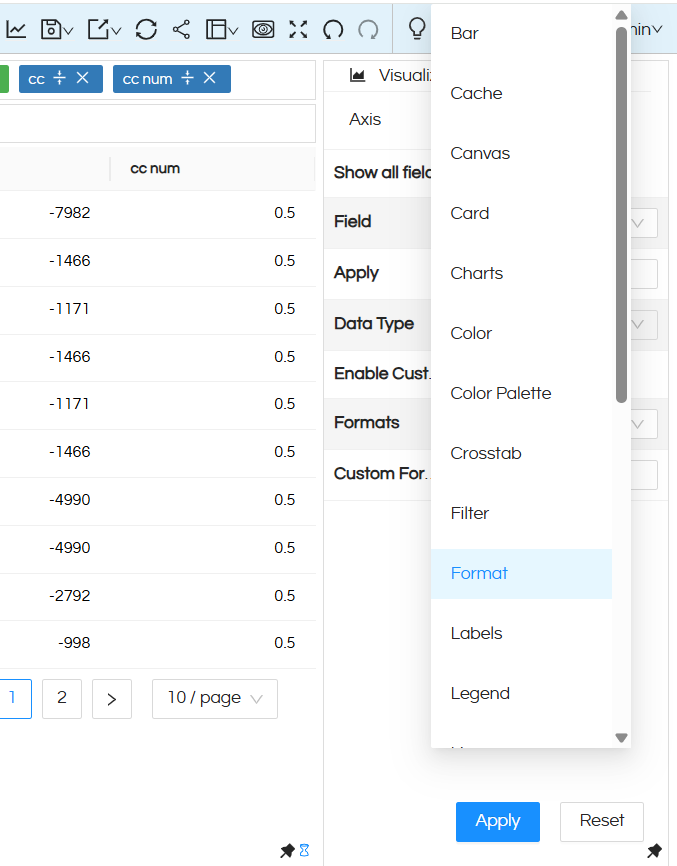
Next, select the column on which you want to apply formatting from the Field dropdown.

Custom Formatting in Properties

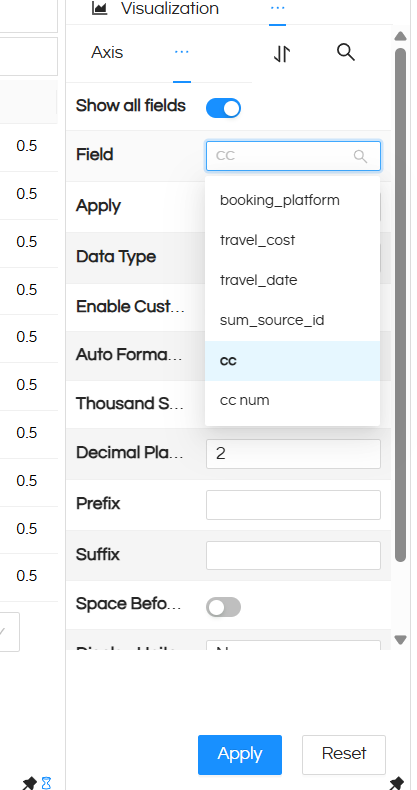
Here, you can view all the available formatting options. You will also notice a new option called Enable Custom Formatting.

Once this option is enabled, the interface updates to display additional settings, allowing you to apply more advanced custom formatting.

Custom Formatting in Properties

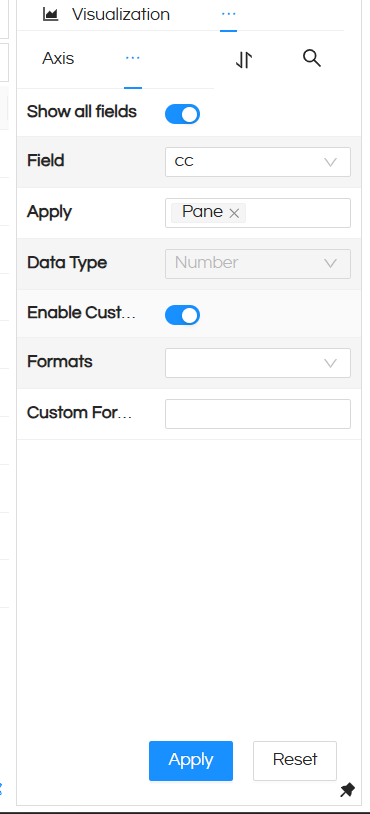
You will now see two options: Formats and Custom Formatting.

  • Formats: A dropdown menu that provides several built-in formatting options to choose from (a working example is provided in the next section).
  • Custom Formatting: An input field where you can enter your own formatting syntax.

Note: A specific syntax must be followed when applying custom formatting.

How to Use:

In this section, each option is explained in detail with working examples.
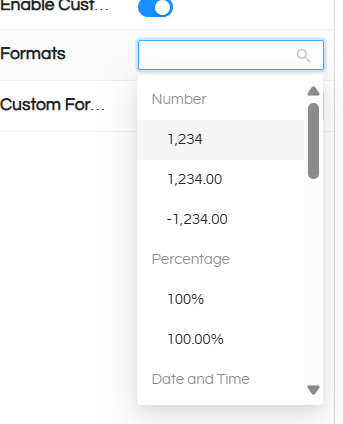
1. Formats:

This option allows you to choose from a set of predefined, commonly used formatting options. These options are categorized based on different number types.

Custom Formatting in Properties

Example :

In this sample, observe the travel_cost column. It currently does not include a thousand separator or decimal precision.

Custom Formatting in Properties

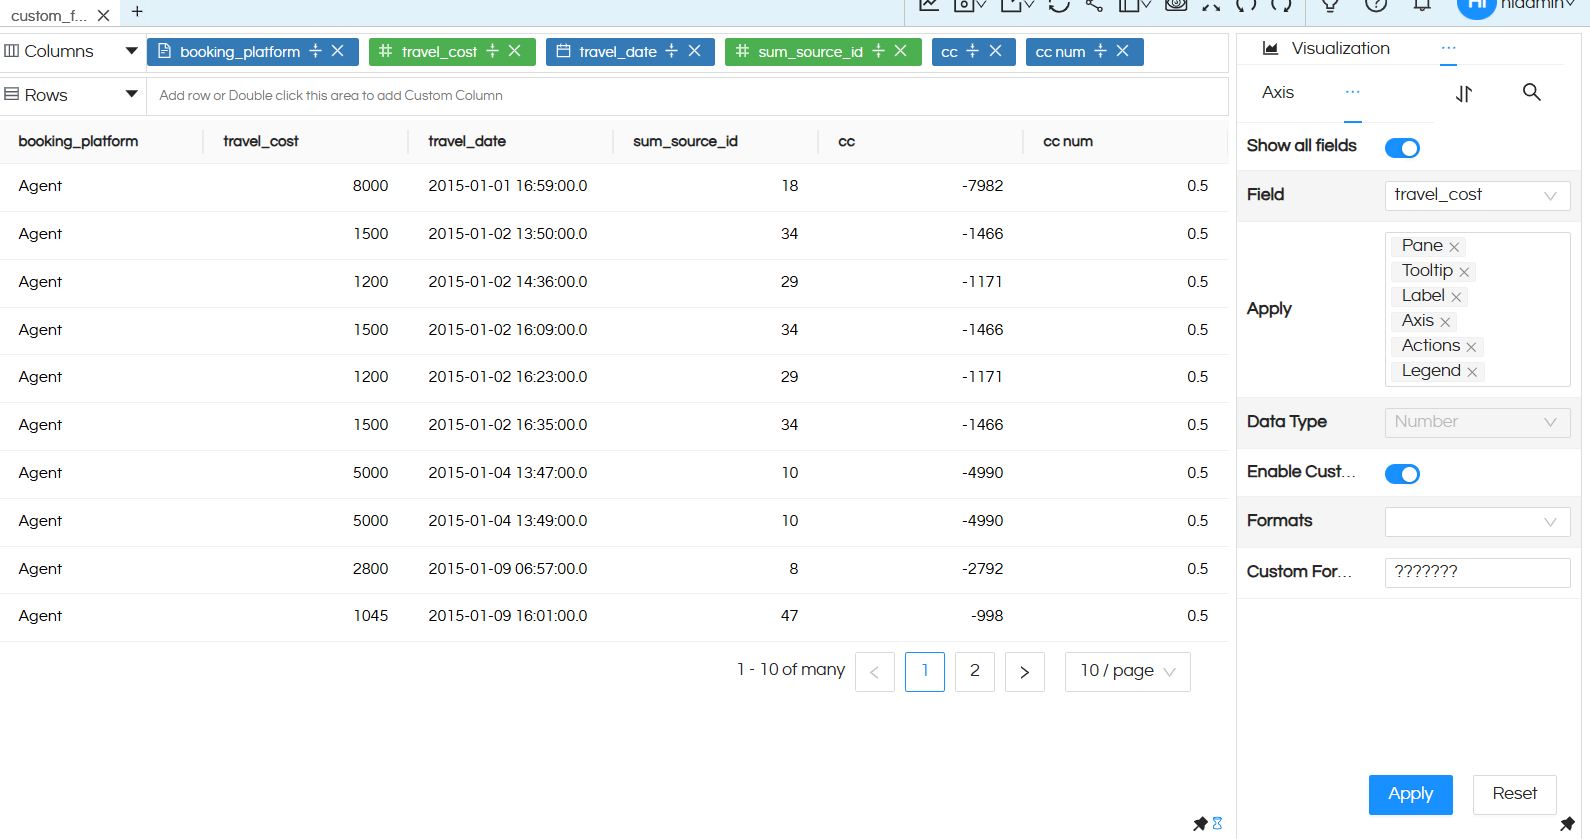
After selecting the 1,234.00 option, the plain numeric values are automatically formatted to include a thousand separator along with two decimal places (as shown in the image below).

Custom Formatting in Properties

In this way, basic formatting can be easily applied by selecting the appropriate option from the dropdown menu. You can completely ignore this dropdown values and directly use Custom Format section for any other kind of requirements (example: show negative numbers in braces in red color)

Custom Formatting:

This option is particularly useful when you need to apply advanced or custom formatting that is not available in the default dropdown options.

  • The formatting syntax follows the numfmt library, a lightweight JavaScript library designed to replicate the “Number Format” functionality found in spreadsheet tools such as Microsoft Excel.

To learn more, refer to the official repository: https://github.com/borgar/numfmt

  • A format pattern is divided into four sections:
<POSITIVE>;<NEGATIVE>;<ZERO>;<TEXT>
  • Only the first section (POSITIVE) is mandatory. The remaining sections are optional and can be defined as needed. The syntax is case-insensitive.
  • Formatting is applied sequentially:
  • First section → Positive numbers
  • Second section → Negative numbers
  • Third section → Zero values
  • Fourth section → Text values
  • Example use case:

If you want positive values displayed in blue and negative values displayed in red, enclosed within parentheses ( ), you can define this behaviour using the format pattern.

  • You can also combine multiple patterns into a single format. This is especially useful for date-related formatting when you want to display only specific components, such as hours and minutes or hours and seconds.
  • The syntax is flexible and allows you to append hardcoded text to formatted values, such as units like deg, kg, etc.

Example 1 :

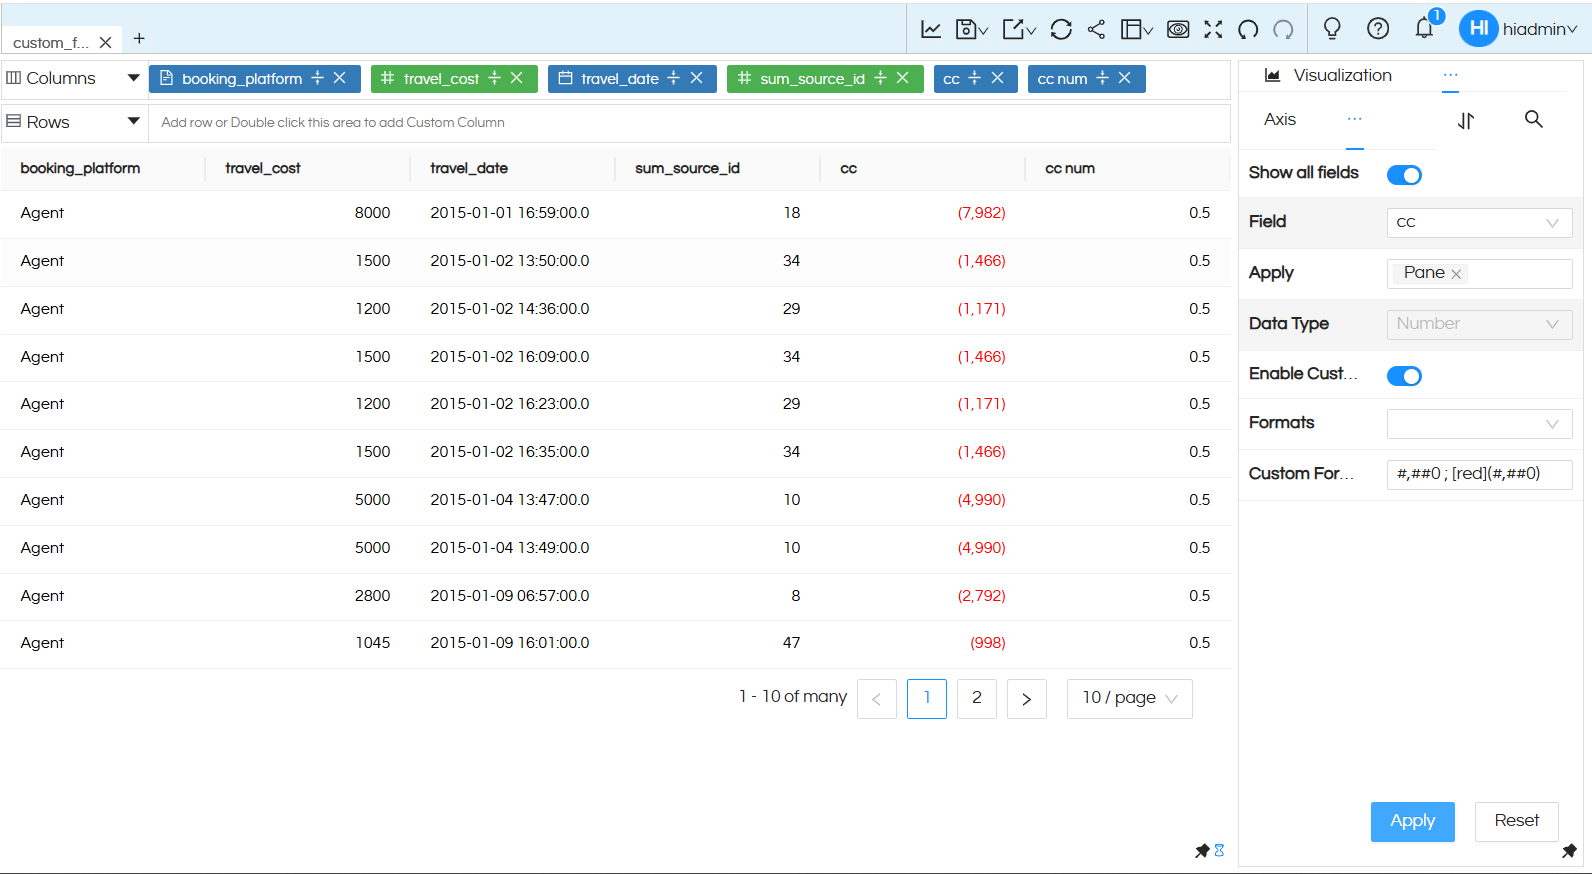
Color based on value

  • Use Case: Display positive numbers as-is, and negative numbers in red color enclosed within parentheses ( ).
  • Format Pattern: #,##0 ; [red](#,##0)

This pattern ensures that:

  • Positive values follow the default format with thousand separators.
  • Negative values are displayed in red and wrapped in parentheses.

For more details on how such patterns are constructed, refer to the numfmt documentation available on its GitHub page.

Default State :

Custom Formatting in Properties

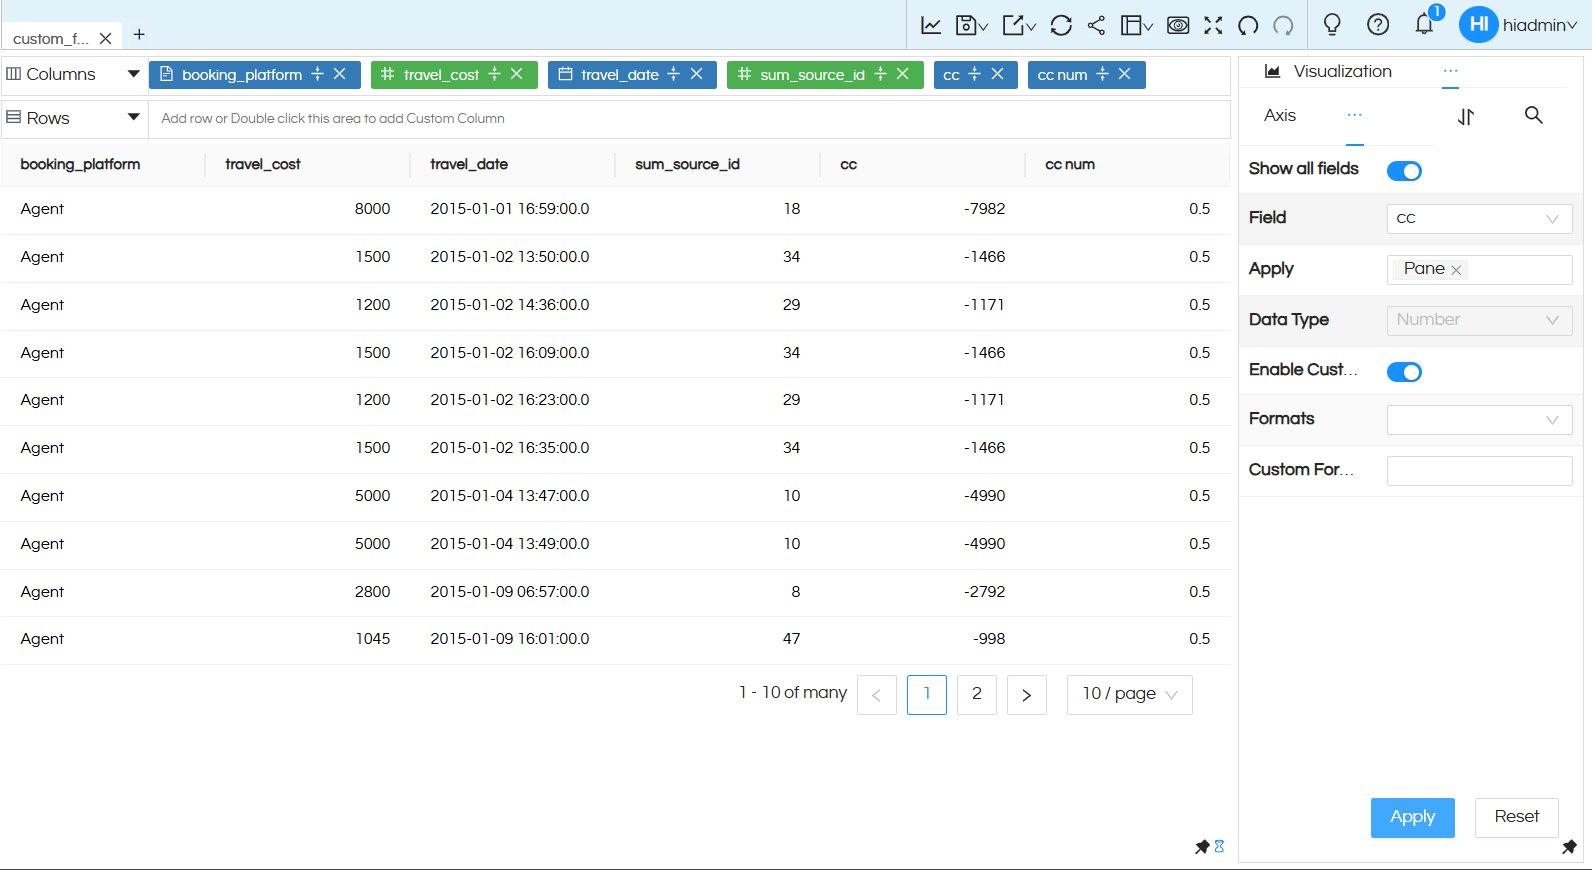
In this example, the cc column contains several negative values. This is the column to which the above format pattern will be applied.

Copy the provided format pattern and paste it into the Custom Formatting input field. Then click Apply. The changes will be reflected immediately, with all negative values displayed in red and enclosed within parentheses ( )

Custom Formatting in Properties

Example 2 :

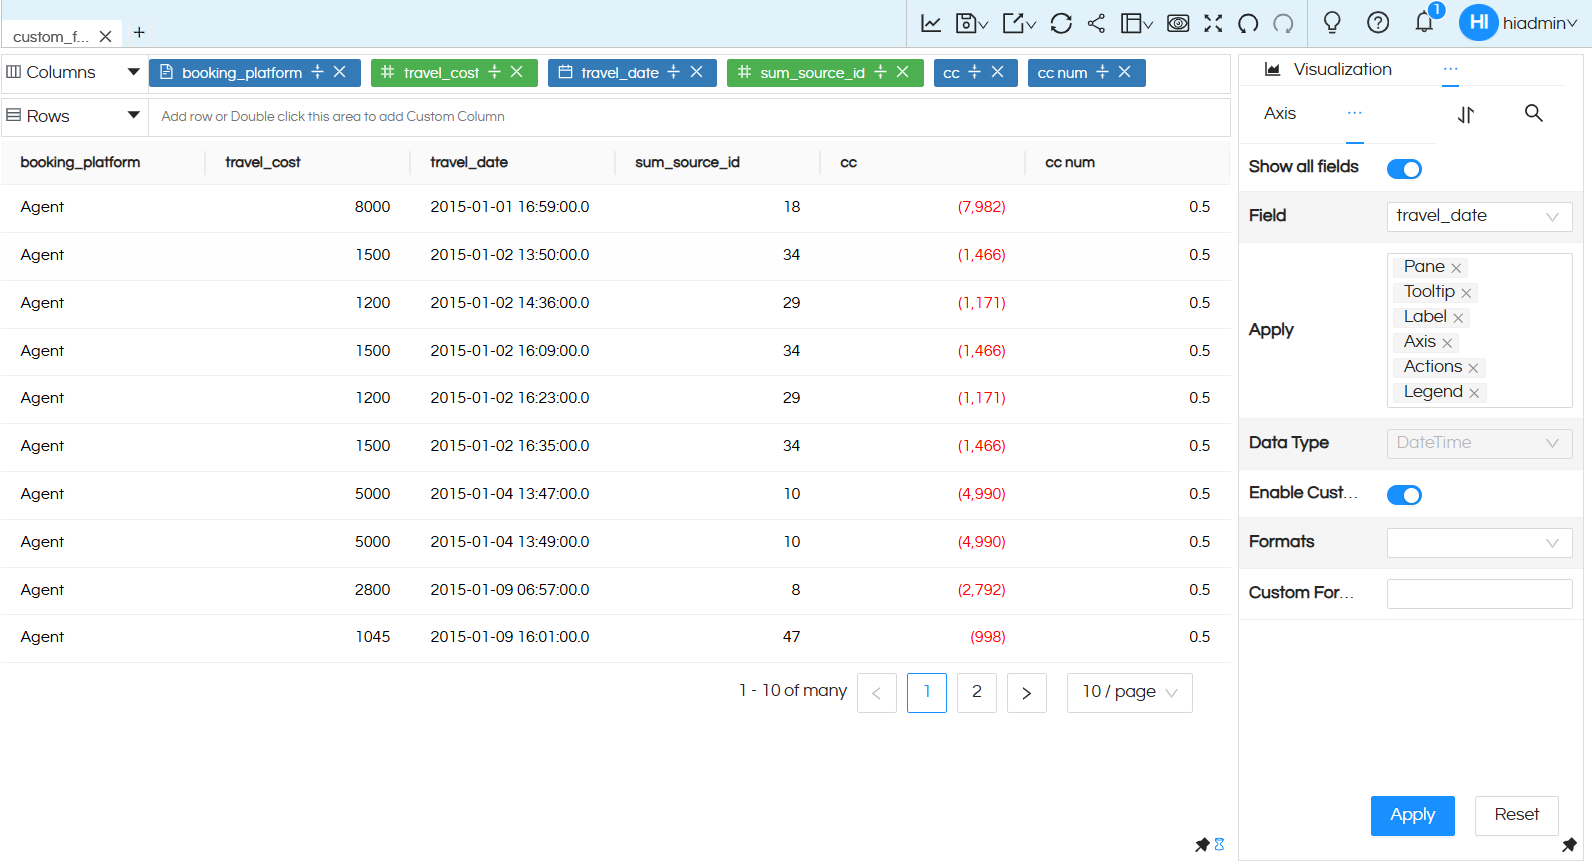
In this example, a date field will be formatted to display values in a more readable format such as “Date : dd-mm-yyyy”.

Currently, the data in the travel_date column is displayed with the full date and time included.

Custom Formatting in Properties

As discussed earlier, multiple format elements and text can be combined to achieve the desired output.

  • To display the day, use dd
  • To display the month, use mm
  • To display the year, use yyyy

These can be used individually or combined in any sequence with a preferred separator, for example:

dd-mm-yyyy ,   mm/dd/yyyy

To add a prefix such as “Date : ”, include it as hardcoded text enclosed in double quotes.

  • Format Pattern: “Date : ” dd-mm-yyyy

Custom Formatting in Properties

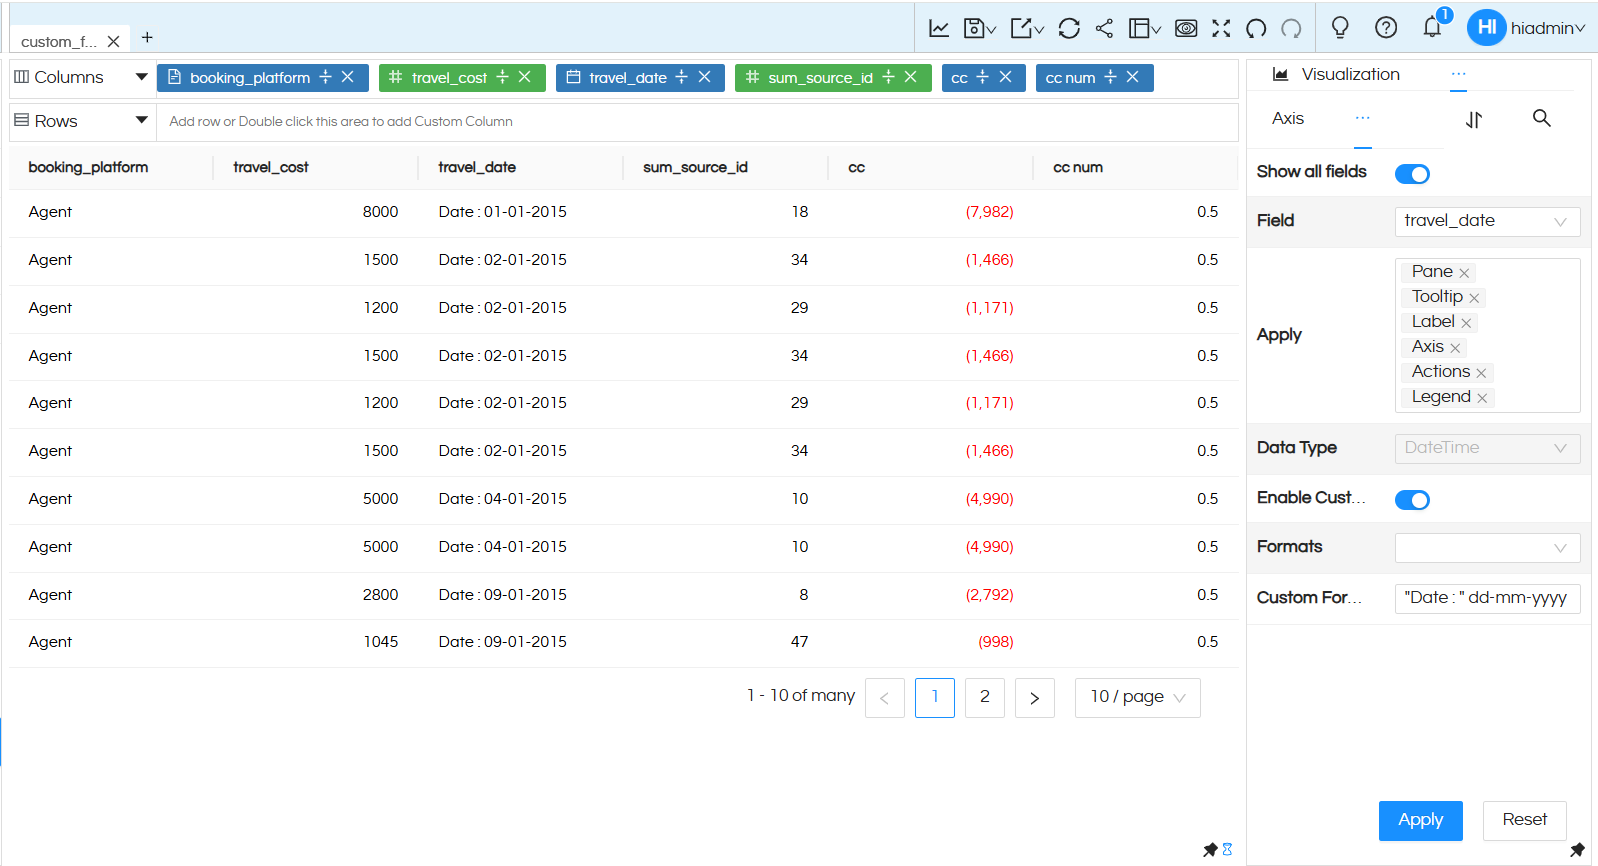
Paste this format pattern into the Custom Formatting input field and click Apply. The changes will be reflected in the UI, displaying the date in the specified format (refer to the image above)

  • In this way, you can also append text to every value. This is especially useful when a column contains temperature values and you want to display deg after each value.

With this approach, you gain greater flexibility to format columns according to your specific requirements.

Reach out on support@helicalinsight.com in case of any more questions.

Leave a Reply

Helical Insight’s self-service capabilities is one to reckon with. It allows you to simply drag and drop columns, add filters, apply aggregate functions if required, and create reports and dashboards on the fly. For advanced users, the self-service component has ability to add javascript, HTML, HTML5, CSS, CSS3 and AJAX. These customizations allow you to create dynamic reports and dashboards. You can also add new charts inside the self-service component, add new kind of aggregate functions and customize it using our APIs.
Helical Insight, via simple browser based interface of Canned Reporting module, also allows to create pixel perfect printer friendly document kind of reports also like Invoice, P&L Statement, Balance sheet etc.
If you have a product, built on any platform like Dot Net or Java or PHP or Ruby, you can easily embed Helical Insight within it using iFrames or webservices, for quick value add through instant visualization of data.
Being a 100% browser-based BI tool, you can connect with your database and analyse across any location and device. There is no need to download or install heavy memory-consuming developer tools – All you need is a Browser application! We are battle-tested on most of the commonly used browsers.
We have organization level security where the Superadmin can create, delete and modify roles. Dashboards and reports can be added to that organization. This ensures multitenancy.
A first-of-its-kind Open-Source BI framework, Helical Insight is completely API-driven. This allows you to add functionalities, including but not limited to adding a new exporting type, new datasource type, core functionality expansion, new charting in adhoc etc., at any place whenever you wish, using your own in-house developers.
It handles huge volumes of data effectively. Caching, Pagination, Load-Balancing and In-Memory not only provides you with amazing experience, but also and does not burden the database server more than required. Further effective use of computing power gives best performance and complex calculations even on the big data even with smaller machines for your personal use. Filtering, Sorting, Cube Analysis, Inter Panel Communication on the dashboards all at lightning speed. Thereby, making best open-source Business Intelligence solution in the market.
With advance NLP algorithm, business users simply ask questions like, “show me sales of last quarter”, “average monthly sales of my products”. Let the application give the power to users without knowledge of query language or underlying data architecture
Our application is compatible with almost all databases, be it RDBMS, or columnar database, or even flat files like spreadsheets or csv files. You can even connect to your own custom database via JDBC connection. Further, our database connection can be switched dynamically based on logged in users or its organization or other parameters. So, all your clients can use the same reports and dashboards without worrying about any data security breech.
Our application can be installed on an in-house server where you have full control of your data and its security. Or on cloud where it is accessible to larger audience without overheads and maintenance of the servers. One solution that works for all.
Different companies have different business processes that the existing BI tools do not encompass. Helical Insight permits you to design your own workflows and specify what functional module of BI gets triggered