In this blog, we will see how to add custom calculations in Helical Canned Report module. These calculations will be added to the Calculations/Parameters section in the datasources pane and can be used in the report.
By default, in the canned report module, there are various calculations available by default. However, if you want to add custom calculations, like subgroup total or subgroup sum, ratio of two fields, percentages etc, custom calculation feature can be used.
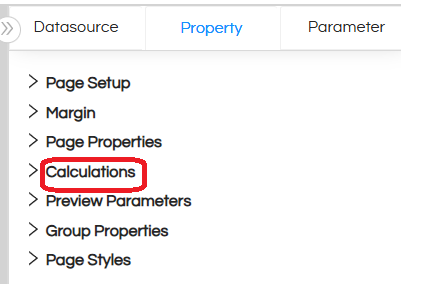
- Click on the report canvas/background. In the properties pane, you will see Calculations section.
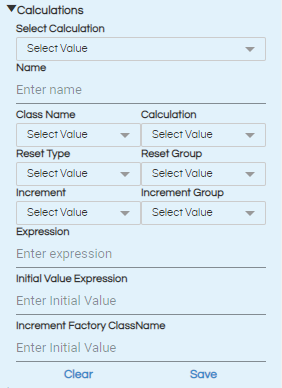
- After expanding the Calculations section, you will see the following options:
- Select Calculation: If any calculation has already been created, then it will be visible in this dropdown. This is useful for editing already existing calculations which you might have created earlier. For creating a new calculation this is not required.
- Name: This is the user defined name for the calculation. Please ensure that the name does not have any space or special characters except underscore (_).
- Class Name: This is the datatype of the field on which calculation is to be done. There are various kind of classnames present like Big Decimal, Boolean, Double, Float, Integer, Long, Short, Sql Date, String, Time, Timestamp, Util Date.
- Calculation: Based on the classname type selected earlier the list of functions appear in this list. Here, default calculations like Sum, Count, Average, Max, Min, Variance etc. are already present. You can select whichever you require.
- Reset Type: This property defines when the value of the calculated variable should be reset. It can be set to Column, Group, Page, Report, Master or None.
- Reset Group: If you have selected the reset type as Group, then the dropdown will show all the groups created in the report. You can select after which group the value of the calculation should reset.
- Increment: When you want to auto-increment the calculated value, here you can mention after what the increment should happen. Example, if you want to do a group sum then select the specific group which you have created, then it will incremented after every group value. If you do not want to auto-increment, you have to select None.
- Increment Group: Similar to Reset Group. If you have selected group in increment, then the groups will be populated. You need to select the correct group. If you have selected None, you can ignore this setting.
- Expression: This is the actual calculation that you want to do. You need to provide the expression of the calculation along with the field names.
- Initial Value Expression: This is the expression that will define the initial value of the variable and then on top of that further calculation can keep on happening. This can be left blank if not required. So for example if you are doing a sum and that sums initial value should be 100 then those kind of things can be defined here.
- Increment Factory ClassName: Canned Report allows you to create your own calculation and add the library which can be called in this section in order to use the calculation in the report.
version 6.0 onwards the new UI is like shown below
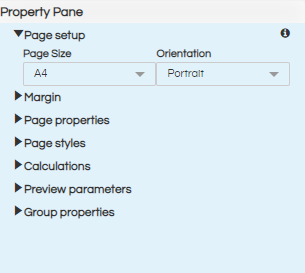
for version 4.1 or below the UI is like shown below
For example, if you want to do the calculation on a field named total, you will write $F{total}. If the calculation needs to be done on a calculated field, then you can give $V{field_name}. You can also use multiple query fields and already calculated fields here and write more complex calculations.
Once you have made the necessary changes, you can save the calculation by clicking on “Save”. You can clear the changes by clicking on clear.
Please Note: If there is any syntactical error or essential field missing in even one custom calculation which you have added, the report will not execute.
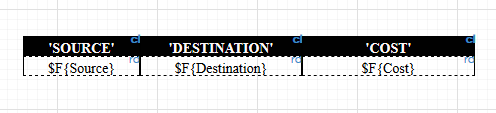
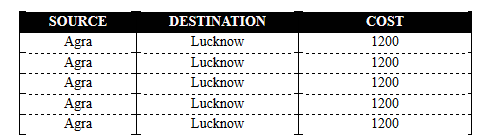
Use Case: Here we will show how to add a custom calculation. We have a source wise destination cost of travel. Let us say we would like to show total cost of travel and average cost of travel according to every source. The report currently looks like below on preview.
So first of all click on $F{Source} and right click on it, then make this as a group by using the option “Create Group”. Now simply click on the canvas (not on any component) and then navigate to the calculations at the right side in the property pane. Give it a name like we are giving now “SourceSum”, classname to be selected is Integer, Calculation to be selected is Sum, Reset type select as Group, Reset Group will be the groupname “group_source”, Increment will be none, do not select anything in the increment group. Then in the expression since we are doing sum on the cost field write down $F{Cost} here and then click on Save. Below is a snapshot of the functions applied
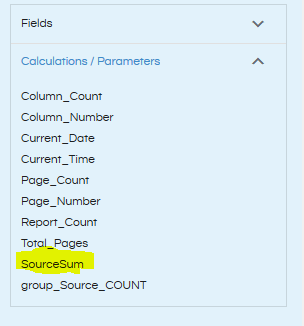
Once done the calculation appears like below in the calculations list.
Now this newly added function can be dragged and added into the canvas. Once added right click on it and make it “Repeat – By Group – group_source”
In a similar way other kind of functions can be used from “Select Calculation”, more custom calculations can also be defined in Expression field.
