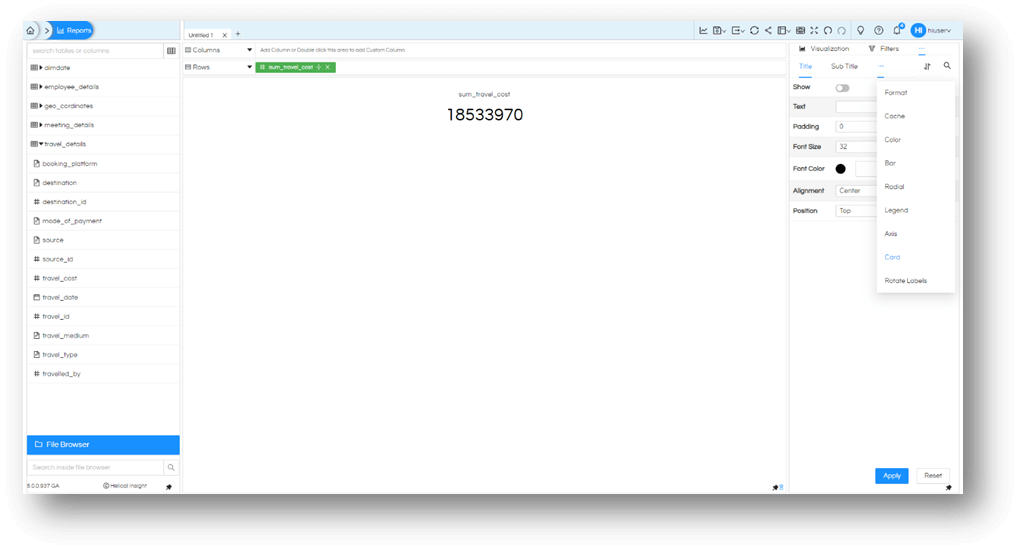
In this blog we are covering various kind of cards customization options of Card. These, as the name suggests, will be applicable for your card visualization under More Charts. You can navigate these options under Properties section.  A lot of things can be done which includes title, prefix and suffix image or text or icons as well as customizing it. There properties we would be covering in these videos.

Card visualization Customization Options

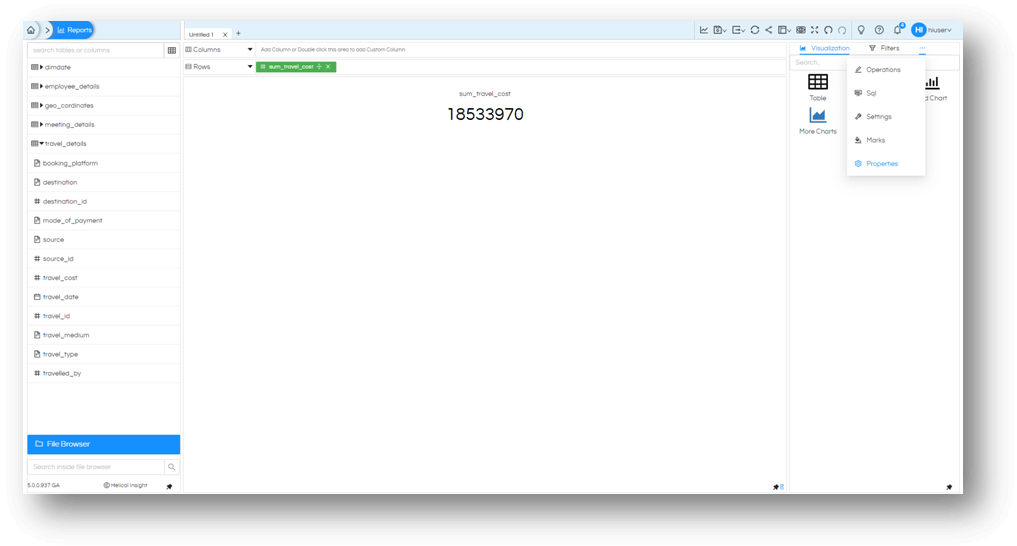
Then choose the meatball icon again and select Card.
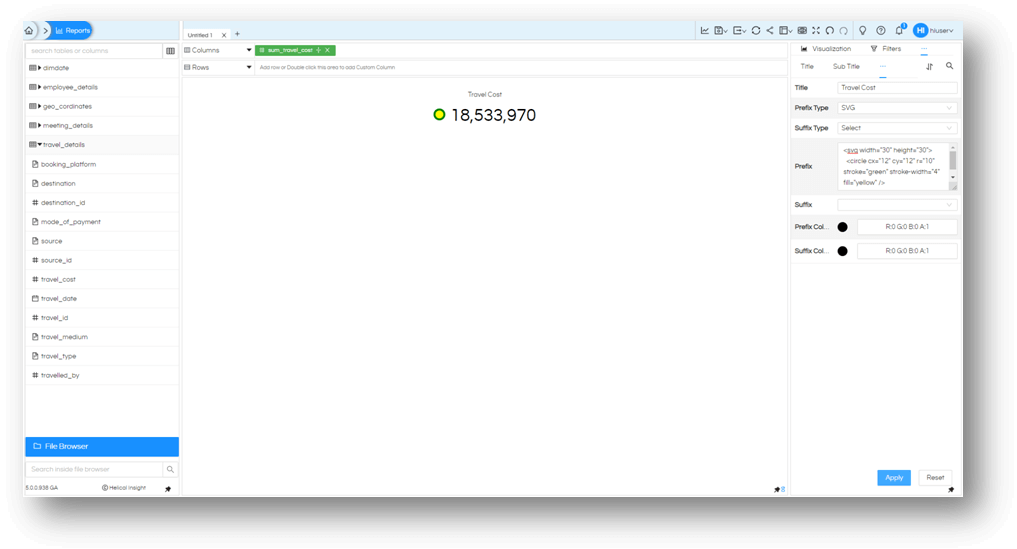
Card visualization Customization Options

Now you can

  • give your own title to the card. By default whatever is the field name that appears as the name, here you can over ride it by specifying here.
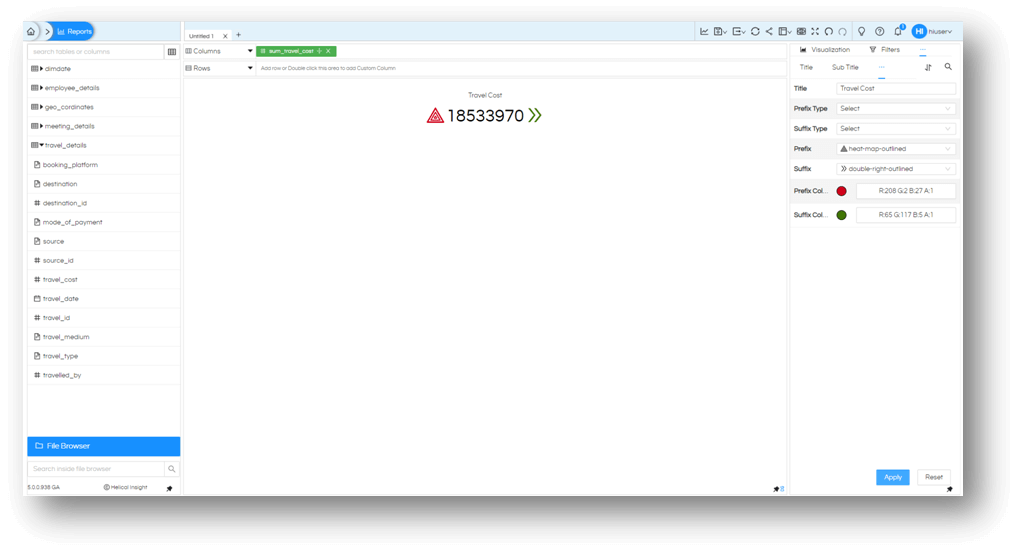
  • choose a prefix or suffix type which is not just a simple character but it could be
    • Select: When ‘select’ option is selected, then in prefix and suffix there is a list of various icons available which can be quite useful while creating charts. Selected icon will get added as prefix or suffix. There is an exhaustive list of icons present. Not only you can select an icon but also specify its color as well using the option of Prefix Color or Suffix Color.
    • Card visualization Customization Options

    • Static value: You can type in your own characters and symbols. Most common use case is like $,₹ etc.
    • Card visualization Customization Options

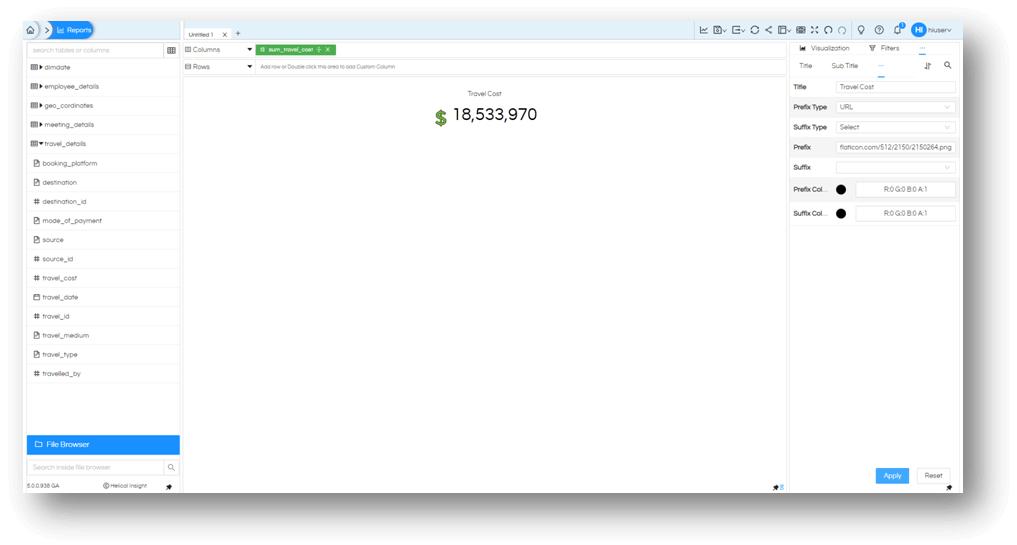
    • URL: if you want to add a link to web (direct path) or local content ((then we can use syntax like getExternalResource? Followed by image path). Prefix color and suffix color will not work in this case, whatever is the color of the image that will get displayed as is.
    • Card visualization Customization Options

    • SVG: for writing a vector image content. SVG code can be put inside prefix and suffix. Note that the color which is specified in this SVG code will only be pickedup. The prefix color and suffix color does not have any significance here.
    • Card visualization Customization Options

Now customize and create a better-looking card visualization only with Helical Insight 5.0

Helical Insight’s self-service capabilities is one to reckon with. It allows you to simply drag and drop columns, add filters, apply aggregate functions if required, and create reports and dashboards on the fly. For advanced users, the self-service component has ability to add javascript, HTML, HTML5, CSS, CSS3 and AJAX. These customizations allow you to create dynamic reports and dashboards. You can also add new charts inside the self-service component, add new kind of aggregate functions and customize it using our APIs.
Helical Insight, via simple browser based interface of Canned Reporting module, also allows to create pixel perfect printer friendly document kind of reports also like Invoice, P&L Statement, Balance sheet etc.
If you have a product, built on any platform like Dot Net or Java or PHP or Ruby, you can easily embed Helical Insight within it using iFrames or webservices, for quick value add through instant visualization of data.
Being a 100% browser-based BI tool, you can connect with your database and analyse across any location and device. There is no need to download or install heavy memory-consuming developer tools – All you need is a Browser application! We are battle-tested on most of the commonly used browsers.
We have organization level security where the Superadmin can create, delete and modify roles. Dashboards and reports can be added to that organization. This ensures multitenancy.
A first-of-its-kind Open-Source BI framework, Helical Insight is completely API-driven. This allows you to add functionalities, including but not limited to adding a new exporting type, new datasource type, core functionality expansion, new charting in adhoc etc., at any place whenever you wish, using your own in-house developers.
It handles huge volumes of data effectively. Caching, Pagination, Load-Balancing and In-Memory not only provides you with amazing experience, but also and does not burden the database server more than required. Further effective use of computing power gives best performance and complex calculations even on the big data even with smaller machines for your personal use. Filtering, Sorting, Cube Analysis, Inter Panel Communication on the dashboards all at lightning speed. Thereby, making best open-source Business Intelligence solution in the market.
With advance NLP algorithm, business users simply ask questions like, “show me sales of last quarter”, “average monthly sales of my products”. Let the application give the power to users without knowledge of query language or underlying data architecture
Our application is compatible with almost all databases, be it RDBMS, or columnar database, or even flat files like spreadsheets or csv files. You can even connect to your own custom database via JDBC connection. Further, our database connection can be switched dynamically based on logged in users or its organization or other parameters. So, all your clients can use the same reports and dashboards without worrying about any data security breech.
Our application can be installed on an in-house server where you have full control of your data and its security. Or on cloud where it is accessible to larger audience without overheads and maintenance of the servers. One solution that works for all.
Different companies have different business processes that the existing BI tools do not encompass. Helical Insight permits you to design your own workflows and specify what functional module of BI gets triggered