We shall see how to create canned ALL as one of the options in the input parameters.
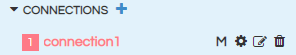
STEP 1: Create a connection
To know more about the types of datasource connections that can be established, refer to the blog.
STEP 2: Write a query without using parameter/where clause
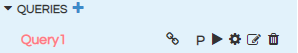
- After providing the connection details in the previous step, click on + button next to Queries.
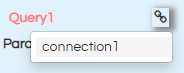
- Select the connection to be used for the query.
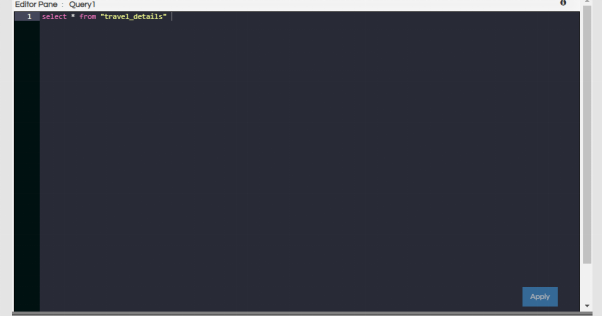
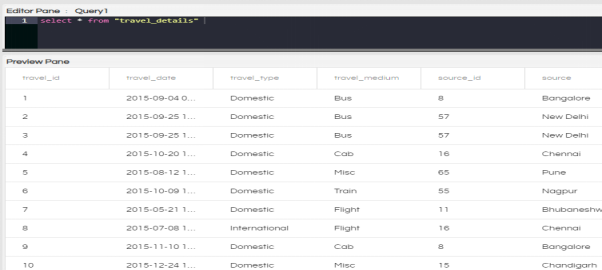
- Click on Configuration icon and write the query without where clause or any input parameters in the editor pane.
- Save the query by clicking on Apply or using keyboard shortcut Ctrl+S.
- Click on Run to execute the query. This will return the top 10 rows of the resultset.
STEP 3: Add an input parameter
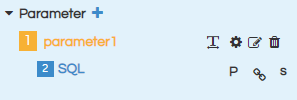
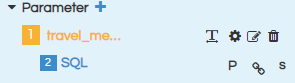
- Click on + icon next to parameter. You can add as many parameters as required.
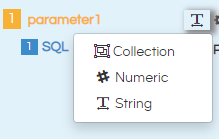
- Select the type of input parameter. For multi-select parameters, the type should be set to Collection.
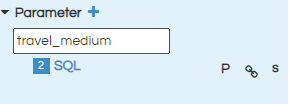
- Edit the name of the parameter by clicking on the pencil icon.
STEP 4: Edit the Configuration of the input parameter
- Select the connection for the query of the input parameter.
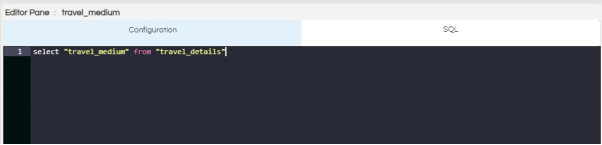
- Write the query that will return the input parameter column in the SQL section.
- Click on Apply or Ctrl+S to save the query
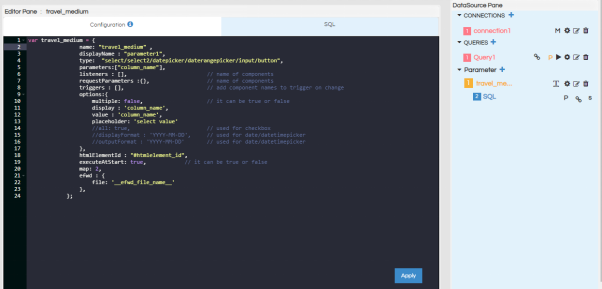
- Go to configuration section and give the configuration that you desire. Please note that the variable name, name specified within the configuration and the name of the parameter should match exactly.
- Set all:true
- map: this is the number of the SQL that is to be used for the filter. Ensure that this value is correct.
- For multiselect parameters, use array to define the default value with which the report will open.
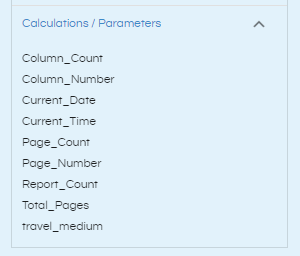
- In the Datasources pane under Calculations/Parameters, you will see that the parameter has been added. This parameter can now be used in the report, if required by simply dragging it like any other variable.
- Go to Preview Parameters section in the property pane
- Creating Canned Reports with Input Parameters with Single Select
- Creating Canned Reports With Multi-Select Input Parameters
- Types of Input Parameter In Canned Reports Interface Of Helical Insight
- Creating Canned Reports with Date Picker as Input Parameters
- Creating Canned Reports with a Date Range selector Input Parameters
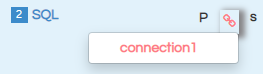
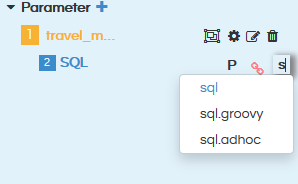
If the query is of groovy or adhoc type, select the correct type by clicking on S and selecting the type. The three options available are SQL, SQL.GROOVY, SQL.ADHOC
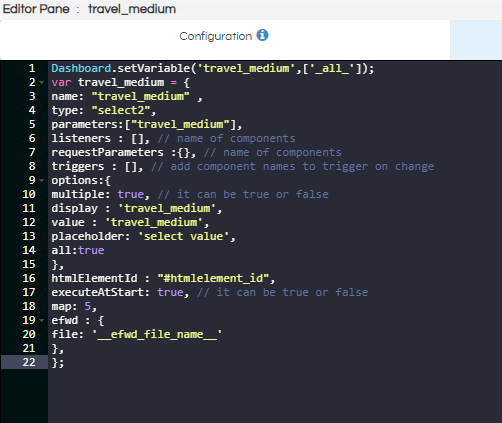
Dashboard.setVariable(‘parameter_name’,[’default_value’]);
To set all as default parameter use:
Dashboard.setVariable(‘parameter_name’,[‘_all_’]);

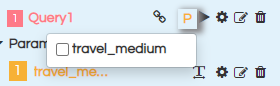
STEP 5: Add listener of parameter to query section
Click on P icon. You will see the added parameter list. Select the parameter(s) that you want to use in the query
STEP 6: Add where clause to the query
Add where clause in the query section using the selected parameters. For using the values returned by the parameter, use the parameter name with $ sign and within {}. Syntax – ${parameter_name}.
For multi-select parameters, use IN keyword for comparison in the where clause as array is returned. Save the query and execute to get the resultset.
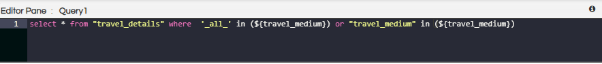
Multiselect Query example:
select * from "travel_details" where '_all_' in (${travel_details}) or "travel_medium" in (${travel_medium})
Single Select Query example:
select * from "travel_details" where '_all_' = {travel_details} or "travel_medium" =${travel_medium}
Note: For using _all_, you will have to add ‘_all_’ in (${parameter_name}) for multiselect parameter or add ‘_all_’ = ${parameter_name} for single select parameter as demonstrated in the above 2 examples.
STEP 7: Go to the Canvas to Use Parameters on the report
After making all the changes in the datasources page, go to Canvas.
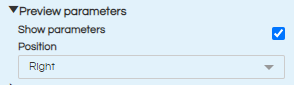
By default, “Show Parameters” will be checked. If you do not want to show the parameters to end user, you can deselect this.
“Position” section defines where the parameter section should be visible with respect to the report. There are 4 options: right, top, left and bottom.
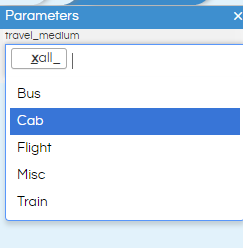
STEP 8: Preview the report
Click on Preview icon to preview the report. Click on the hamburger icon, you can see the parameter in the position that you have mentioned.
STEP 9: After the report is satisfactory, save the report in desired location.
Learn More about Different Input Parameter Usages
For further assistance, kindly contact us on support@helicalinsight.com or post your queries at Helical Forum
