In this blog, we are going to see how to connect to the Datasources page in the canned reports module and other features present on the page.
In order to go to the datasources page, click on the Datasources button on the left hand side of the canvas or on New Datasource in the datasource pane.
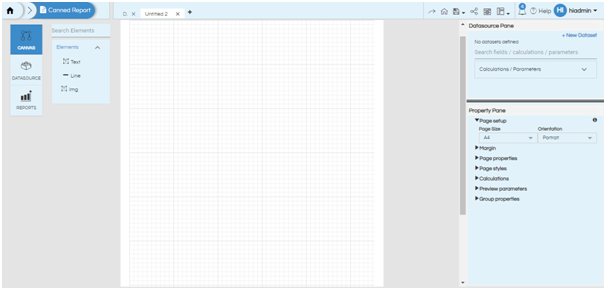
The following page will appear:
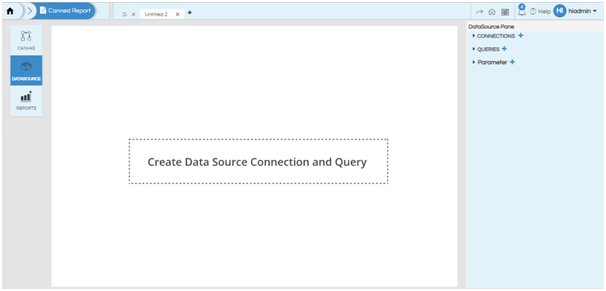
The left hand side buttons can be used to navigate to the canvas or to the file browser. The middle section is the editor pane and the right hand section is the DataSource pane.
The addition of connections, queries and parameters and the navigation between them is done in the datasource pane while the configuration is done in the editor pane.
CONNECTIONS
Click on plus symbol beside the Connection (see the below screenshot). We can create multiple connections also.
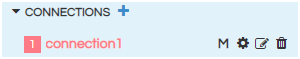
By default the connection is created with the name connection1, then connection2 so on and so forth. We can rename connection name using edit option (pencil icon).
The various functions present here is Configure, Edit and Delete functionalities. We can delete the connection by clicking on delete icon.
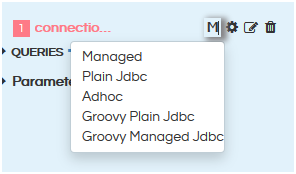
There is an option of defining the type of DataSource. There are 4 kinds of DataSource types which are Managed, Plain JDBC, Adhoc, Groovy Plain JDBC and Groovy Managed JDBC.
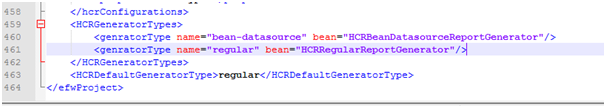
NOTE: In case if you are planning to use Plain JDBC, Adhoc or Groovy JDBC connection then you will also have to open setting.xml file. The path of this file is “..\hi\hi-repository\System\Admin”
When this file is opened navigate to the tag HCRDefaultGeneratorType and change the tag from regular to bean-datasource.
By default it appears like below
Change it to like below
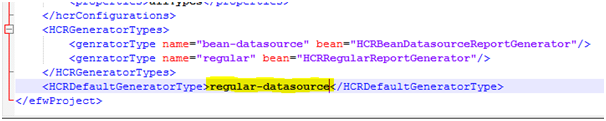
These steps are not required when using Managed Connection method. Once done please restart the server once.
Clicking on Configure can you allow you to configure the connection details.
- Managed :
- Plain JDBC:
- Adhoc:
- Groovy Plain jdbc
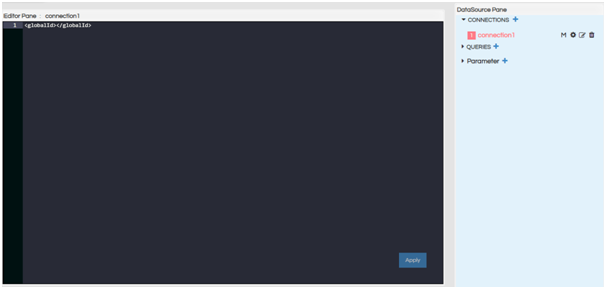
<globalId>1</globalId>
When managed is selected an interface like above appears. Herein you can put the globalID which comes from the connection created in the data sources page. (see the below screenshot). Whenever a datasource is created it is assigned a unique connection id, that unique connectionId can be used here.
Click on Configuration (Gear icon) and the editor will open. Give the global connection ID. And click on Apply or Ctrl+S to save.
Via this specific connection method we can provide driver name, db url, db username and password. Note that for the below method to work the relevant JDBC driver should also be present in the drivers folder of our application. By default we provide most commonly used drivers, however you also have the option of adding new drivers also. Default location of drivers is “..\hi\hi-repository\System\Drivers”
<driver>com.mysql.jdbc.Driver</driver>
<url>jdbc:mysql://localhost:3306/Travel_Data </url>
<user>hiuser</user>
<pass>hiuser</pass>
This Adhoc connection can only be used by the users using Helical Insight Enterprise Edition. Via this method we can directly use the metadata file to make the DBconnection. We can give metadata file path and file name from hi_repository. The meta data file contains connection details. Those connection details are then used to establish data source connection.
<location>1561019713637/1561065479314</location>
<metadataFileName>8176311d-3053-4975-bba7-5890863abcf6.metadata</metadataFileName>
Note: In order to find out the location and metadata file name you can click on “Home”, open file browser, navigate to the required metadata file and right click on it. There in the “Properties” we can get the path and file name which is used here.
Groovy Plain JDBC data source can be used wherein we can define the data connection in the Groovy script. This is more specifically used when people are using things like DBSwitching (Dynamic database switching), data security (hiding or showing data to a certain set of people roles users organizations) etc. The most common use case is the data security wherein the same report you want to share with different users / roles / organizations and they should see their own data only.
<Driver>org.postgresql.Driver</Driver>
<Url>jdbc:postgresql://localhost:5432/Travel_Data </Url>
<User>postgres</User>
<Pass>postgres</Pass>
			<Condition>
				import net.sf.json.JSONObject;
				public JSONObject evalCondition() {
					JSONObject responseJson = new JSONObject();
					 responseJson.put("driver","org.postgresql.Driver");
					 responseJson.put("url","jdbc:postgresql://localhost:5432/Travel_Data");
					 responseJson.put("user","postgres");
					 responseJson.put("password","postgres");
					return responseJson;
				}

			</Condition>
Create the data source connection / connections based on the requirement.
Note: In a similar way you can create multiple DB connections over here.
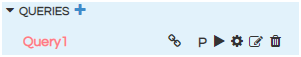
QUERIES
After providing the connection details, click on + button next to Queries. You will see the following options from left to right:
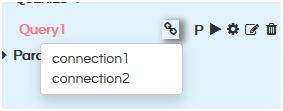
- Connection: Click on this and select the connection that you want to use. If there are multiple connections that you have made you can see those multiple connections list here.
- Parameters: Parameters or filters can be single select, multi select, date picker, date range picker filters. Click on this and select the parameter(s) (if present) that will act as input to the query. Towards the end of this blog we have covered some more information on the introduction of input parameters as well as you can read in detailed usage here.
- Run: Use this button to execute the query. When executed, a resultset of the first 10 rows is displayed under the editor pane for verification. If there is syntactical error, clicking on Run button will give SQL error.
- Configure: When this button is clicked, the query editor pane opens. Input the query and click on Apply or Ctrl+S
- Edit: The pencil icon is used to edit the name of the query.
- Delete: This icon is used to delete the query.
After clicking on + icon, select the connection for the query.
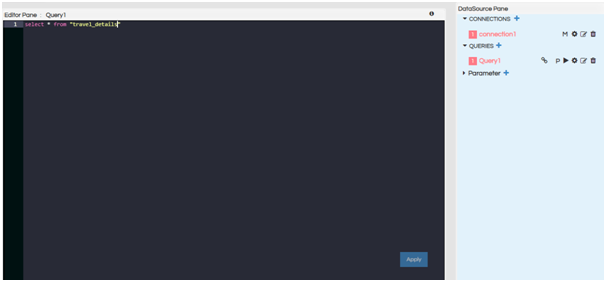
Then click on Configure and write the query in the editor pane. Click on Apply.
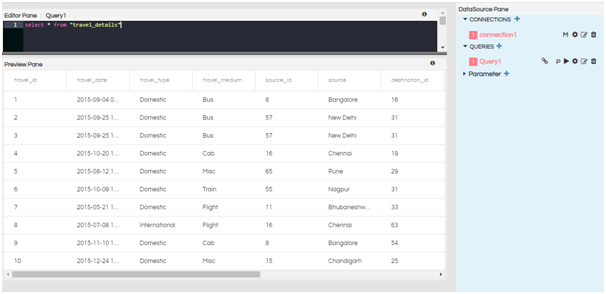
Run the query. You will get the result set of 10 rows under the editor pane.
Now the datasource can be used to create the report.
PARAMETER
If you want to use input parameters or filters on the report, you have to add parameters from the parameter section. Click on + icon next to parameter.
You can add as many parameters as required. You will see the following options:
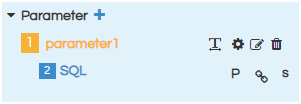
The numbers mentioned next to the parameter and the SQL are the IDs of the parameter and SQL.
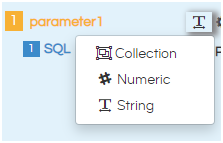 icon is the type of the parameter. There are 3 options – String, Numeric and Collection.
If you click on the rounded symbol, it will prompt three options to select from
- Collection: Used for multi select parameters of any data types.
- Numeric: Used for single select for numeric, float, Lat long, Binary etc
- String: Used for single select (for String data types only). Date, date time etc also goes in string (single select only).
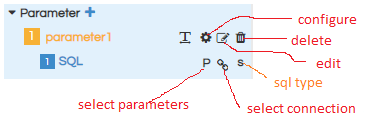
Other functionalities are:
- Configure: By clicking on this we can have configuration screen and also SQL screen.
- Edit: We can edit name of the parameter
- Delete: We can delete the parameter
- Select Parameters : We can use this in order to specify that it should listen to some other input parameter and respond ( use case : cascading input parameters)
- Select Connection : We can choose which data connection we are using for the input parameter from the datasource connection we have created earlier.
- SQL type : there are 3 types of sql. (see the screenshot)
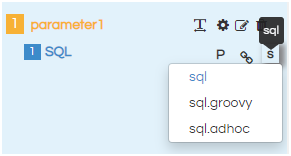
The type of sql are: Sql, sql.groovy and sql.adhoc.
We should select the type of sql based on the connection type we have chosen in the data source connection.
For managed, plain jdbc -> sql
Adhoc             -> sql.adhoc
Groovy plain jdbc    -> sql.groovy
See the below screenshot, you will find numbering for parameters and sql.
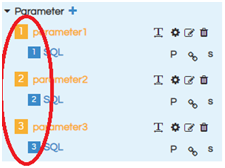
Those numbers represent the count of parameters and sql connections present.
Please refer the following blog to know how to use input parameters in detail.
For further assistance, kindly contact us on support@helicalinsight.com or post your queries at Helical Forum
