There are times where we need to change how the dates and numbers appears on the report. Should it be having a thousand separator, round of to 2 decimal places if this number means an accounting unit, if the number is an ID then it should not have any decimal place or separator. If the amount is too big, we need to deduce it to Million or Billion etc.
Similarly, do we need to put month in words, or in numbers, year should be in 2 digits or 4 digits, or time should be in 12 hour format or 24 hour format. To these and many more options we can format the report’s values.
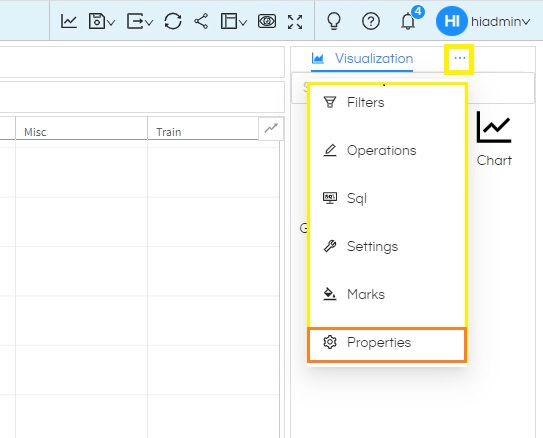
Let us discuss these options in more details with example. Prepare a report with date or datetime field on which we need to apply a formatting. Select the meatball icon from the Tools pane on top right (highlighted in yellow) as shown in image. List of additional menu options will appear. Select ‘Properties‘ from this list. All formatting options are part of chart/visualization properties. Currently formatting options are supported in all visualizations except Charts viz: i.e. supported in Table, CrossTab, Grid Chart, More Charts.
1.1 Formatting Date, Time or Datetime values
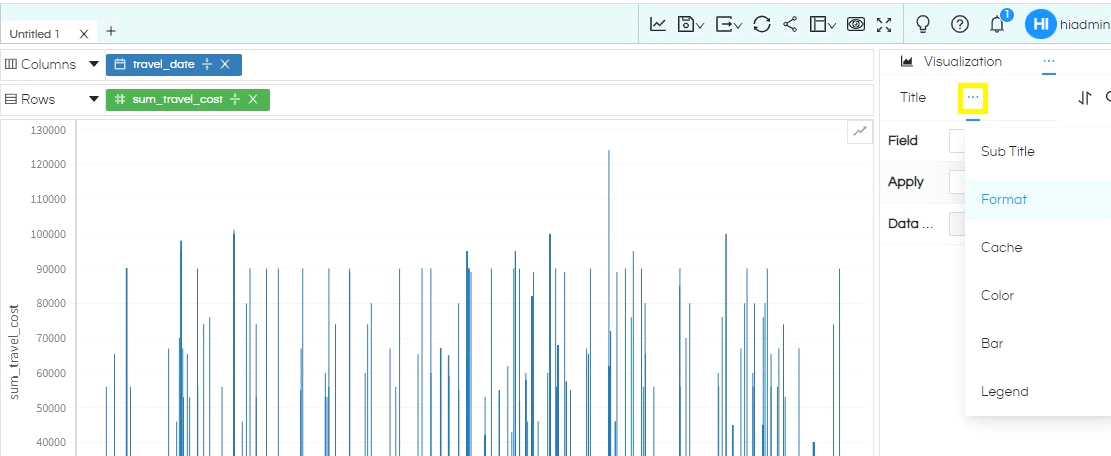
Again, select the meatball icon within properties in front of Title. A list of additional options for Properties will appear. Select Formatfrom here.
Show All Fields: Fromm version 1083 of Helical Insight version 5.0, this new option is also present. This is useful in case if you use a measure as a dimension (ref : https://www.helicalinsight.com/how-to-use-a-measure-as-a-dimension/), then in order to show that as a field here in the drop down list we need to use this option. When this is enabled, then that field will also be visible here.
When you click on box in front of Field, you will see list of all the numeric and date or date-time data fields used in the report. Select the one that you need to format. In Given example we have ‘travel_date’ as date-time datatype.
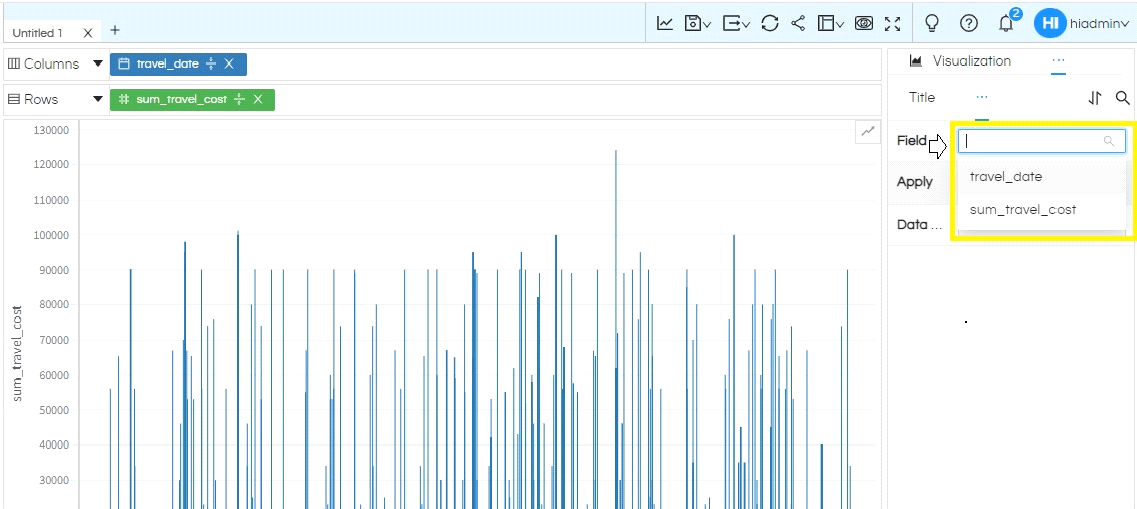
Let us select ‘travel_date‘ for date-time datatype. So, all the customizations that can be done to the date-time datatype will be shown this panel.
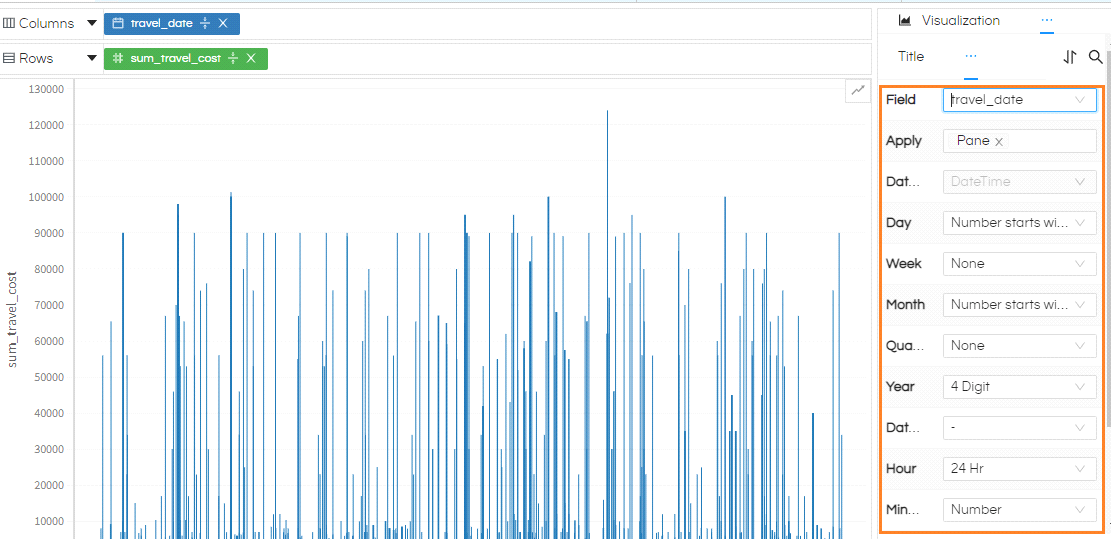
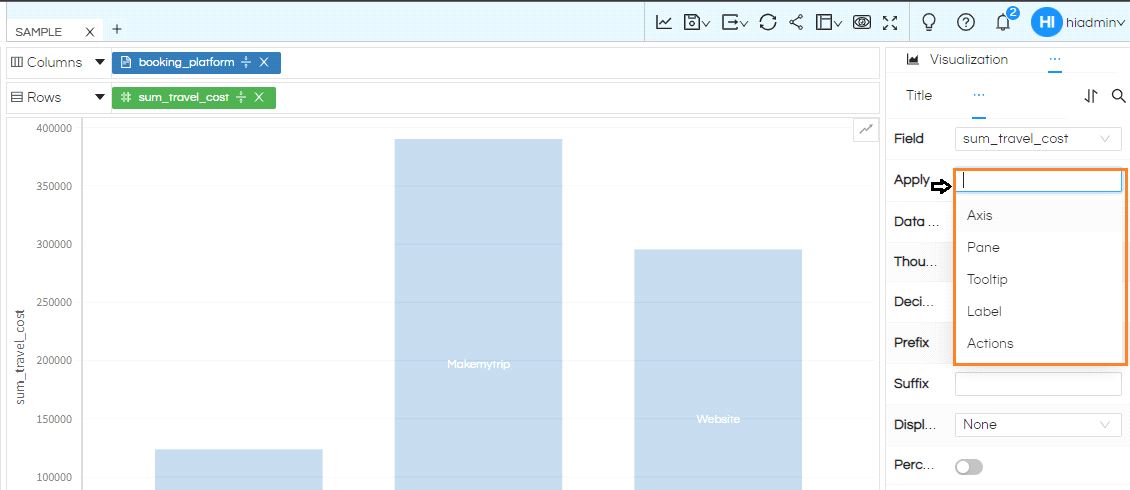
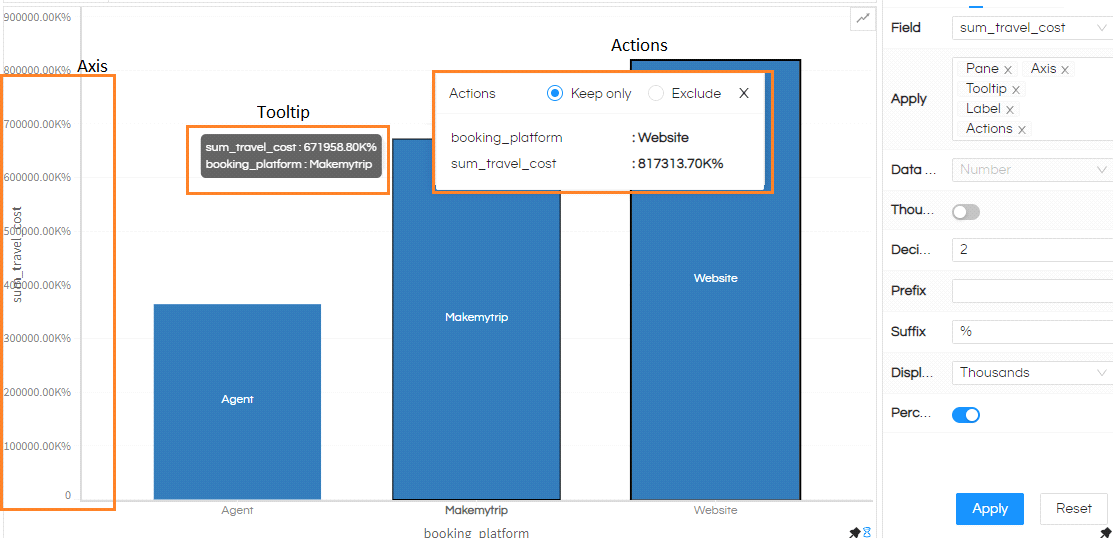
In Apply, we select where these changes needed to be shown. There are five places in which we can see the formatted values of ‘travel_date’ viz: Axis, Pane, Tooltip, Label and Actions.
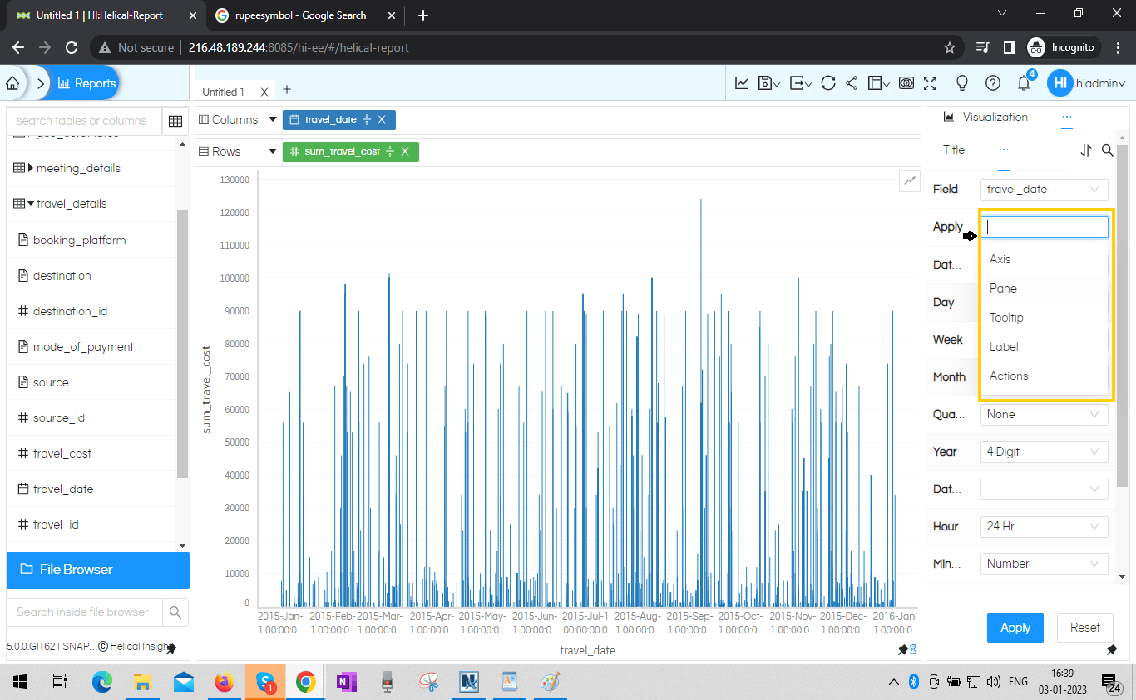
- Axis is along x-axis and y-axis as on any chart with axis, like bar charts, area charts or line charts etc
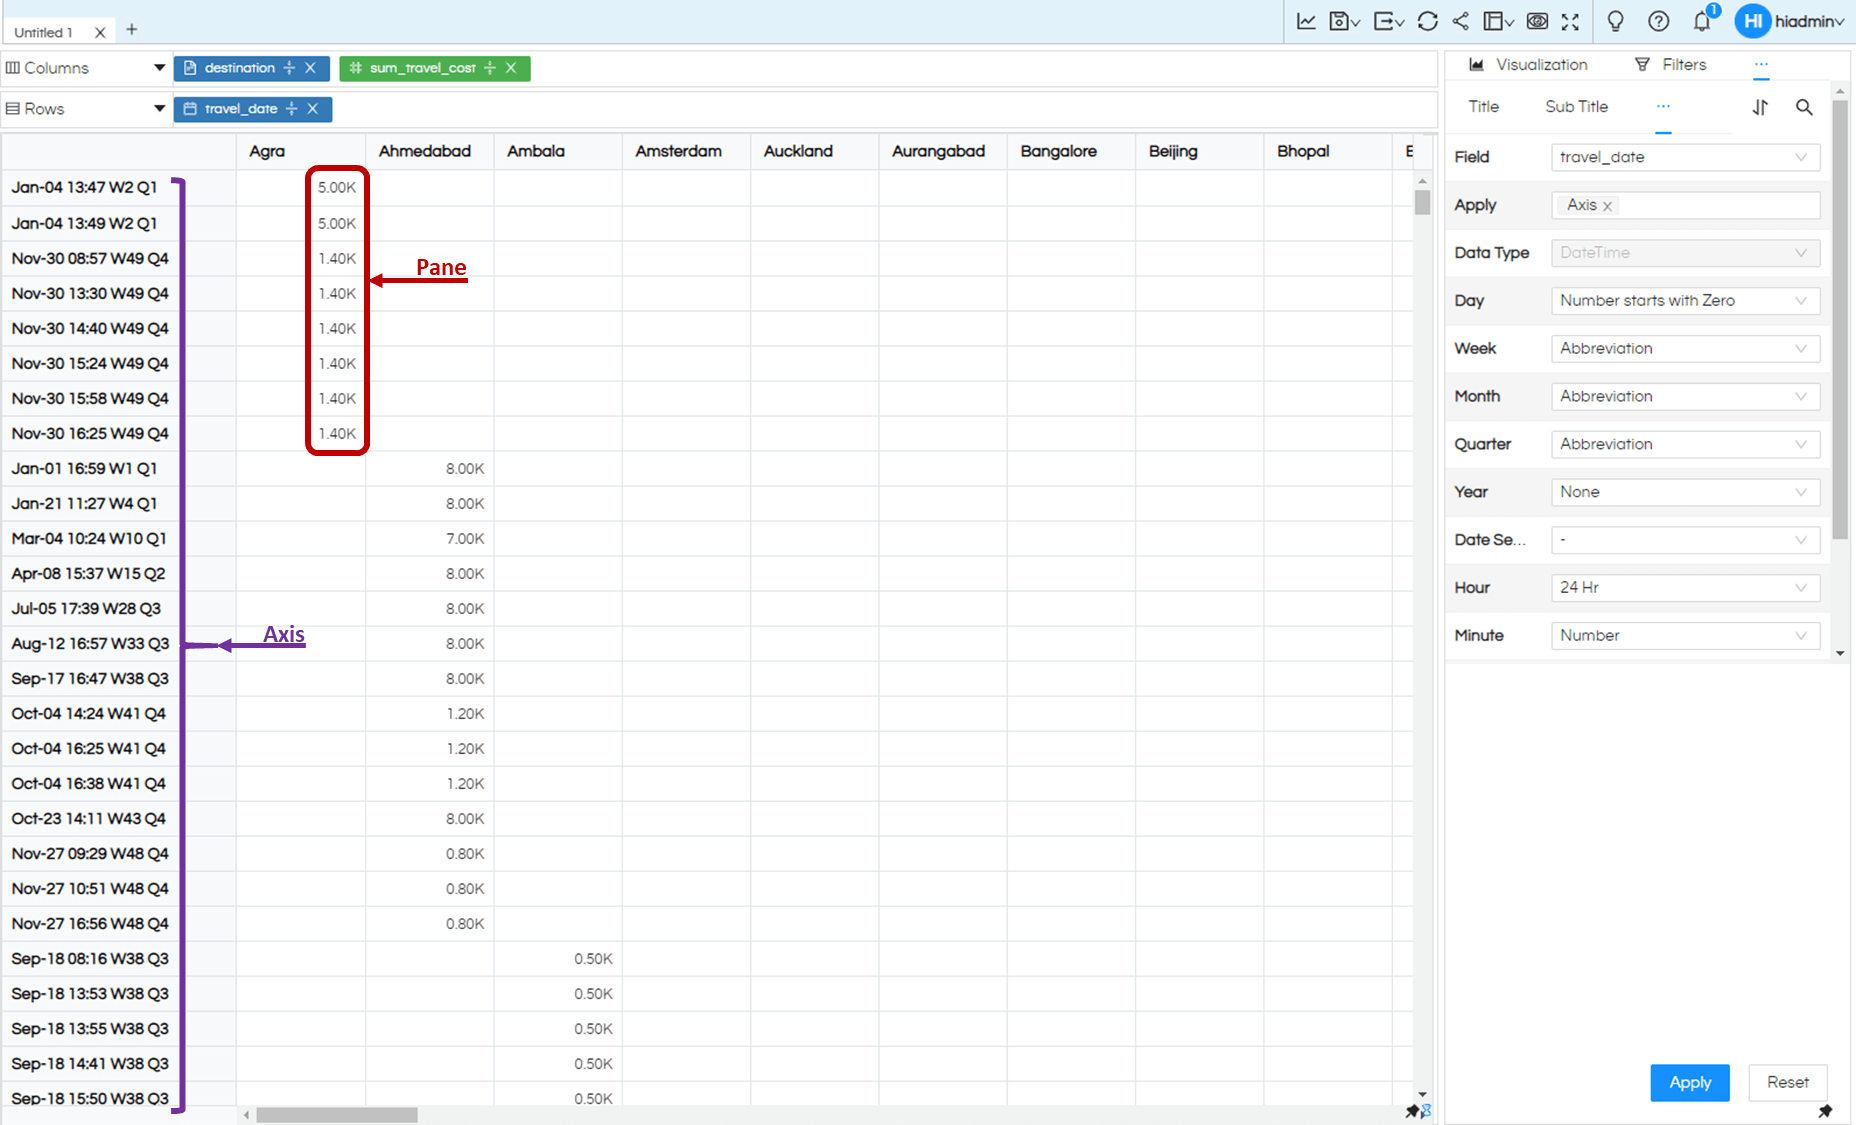
- Pane is the actual content of the report like values in a table, crosstab etc.
- Tooltip sets it on tooltip of pointer.
- Label Applies to data label on the charts when we select a Label on the report.
- Actions enable the formatting on Action Menu while going for drill-down or drill-through.
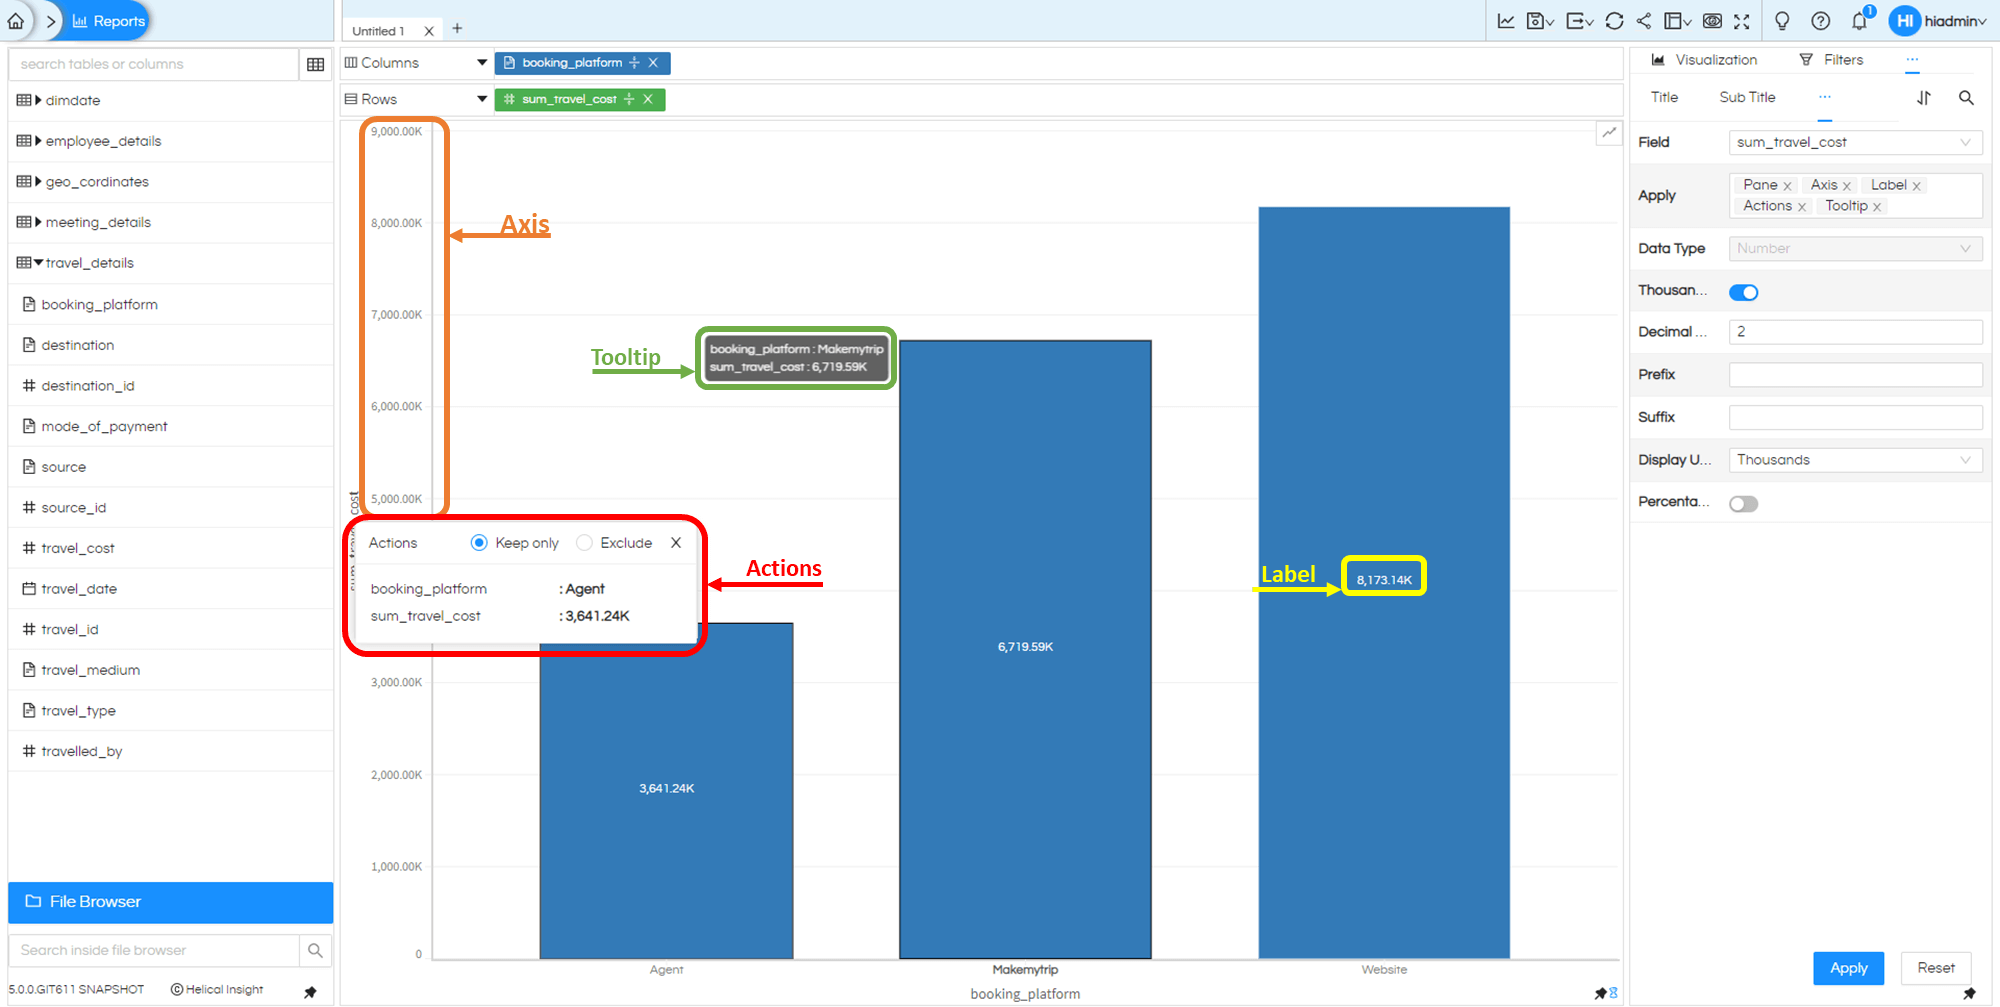
The subsequent image shows how the formatting is visible in all these places.
Data Type: displays the data type of the selected field to which the formatting is being applied.
All the subsequent fields are for formatting of date/time based on data type. This will change based on the datatype of the selected field. Let’s discuss them.
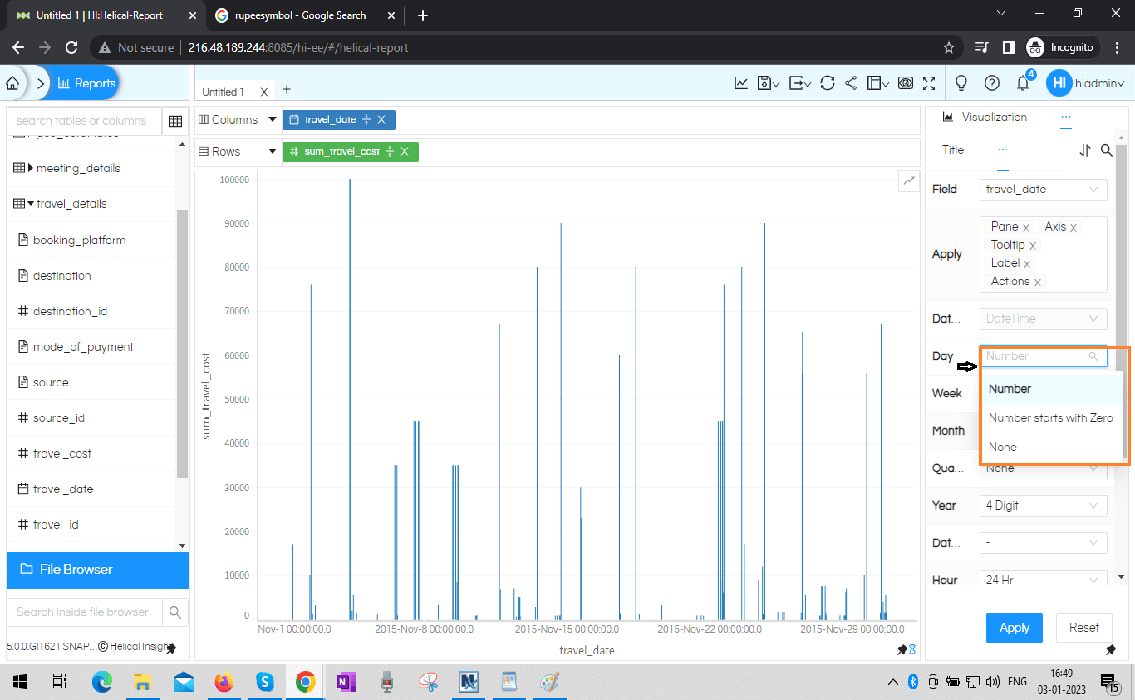
Day: we have 3 options of formatting highlighted by the orange square.
- Number: to show day part of date as without extra ‘0’. Ex: 3 will be shown as ‘3’
- Number starts with Zero: to show day part with leading 0. Ex: 3 will be shown as ‘03’.
- None: to skip showing day part of date at all.
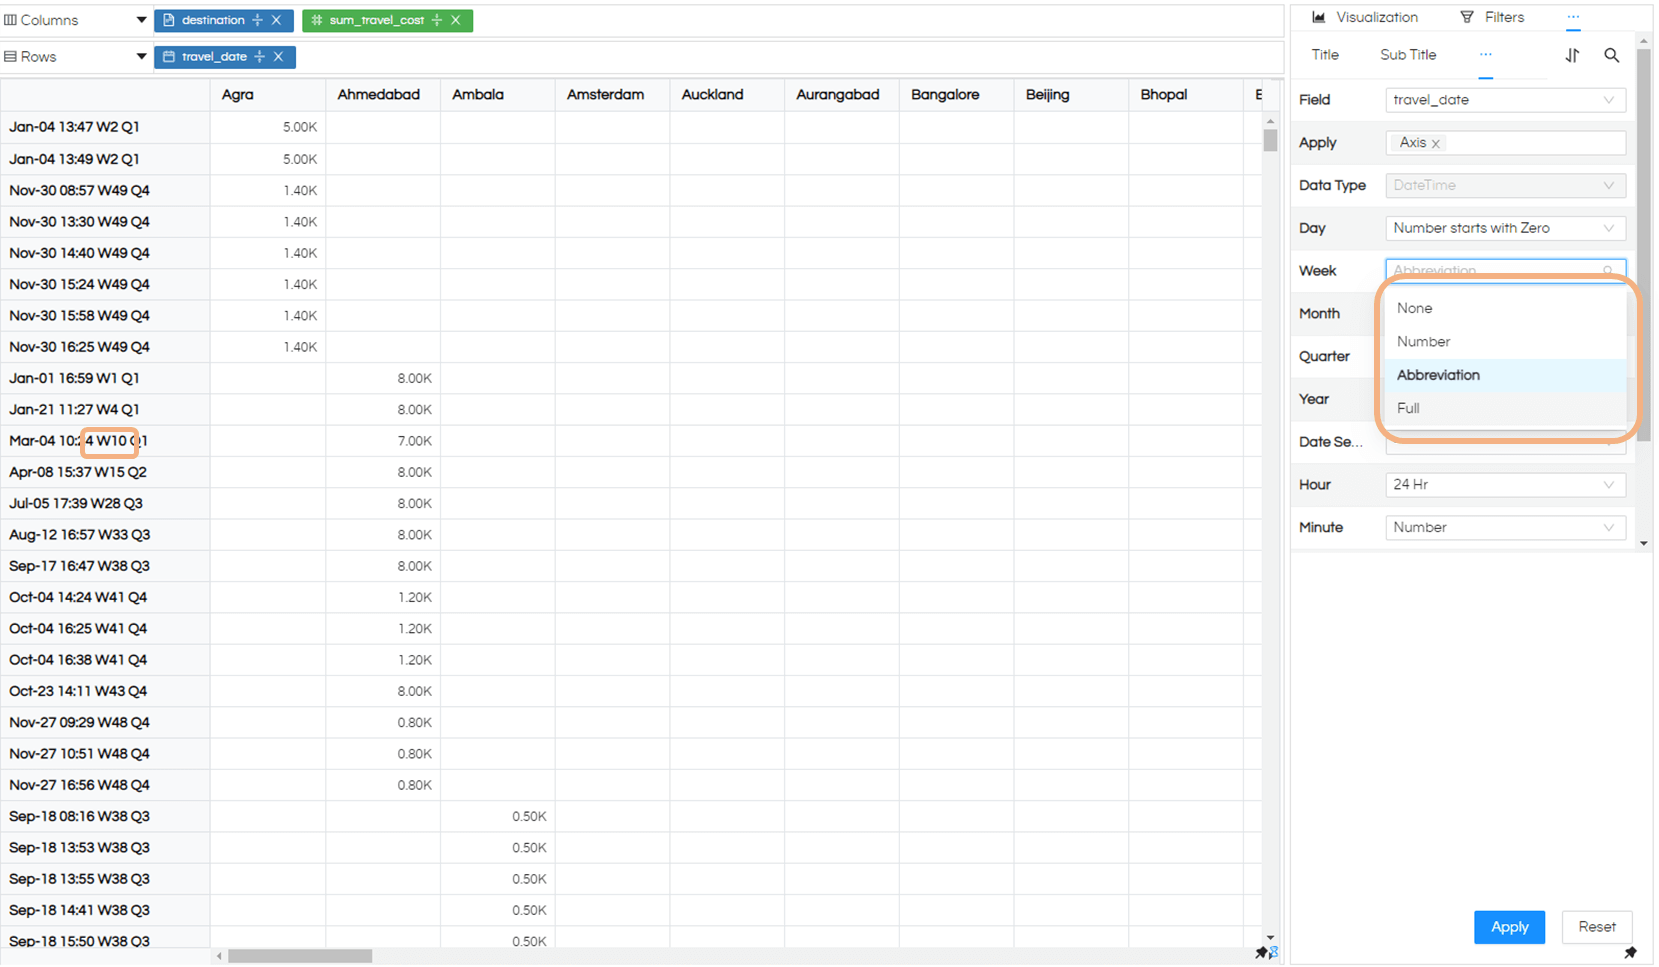
Week gives you option to calculate and add the week number for the given date
- None: does not calculate or show the week number
- Number: append the week number after date time string from 1 to 52 (or 53 depending on calendar week) as ‘1’
- Abbreviation: the week number will have ‘W’ appended to show the week part in the date time formatted string as ‘W1’
- Full: the week number will have ‘Week’ appended to show the week part in the date time formatted string as ‘Week1’
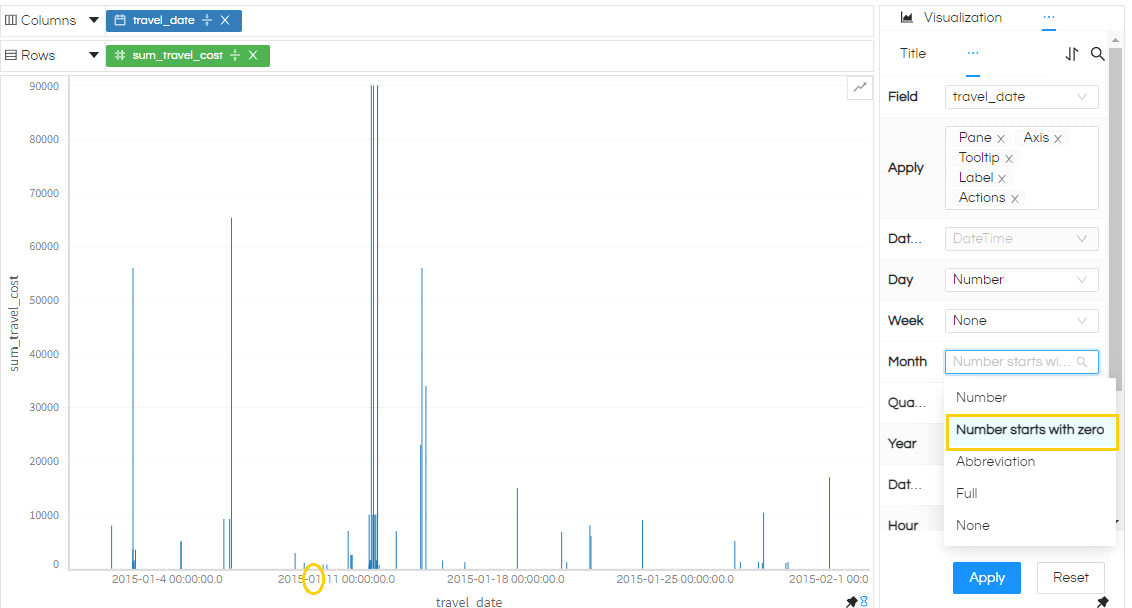
Month gives you formatting options for month part of the date, to show month as
- Number: show the month part as a number like for January show as ‘1’
- Number starts with zero:show the month part in 2 digits like for January show as ‘01’
- Abbreviation: show the month part abbreviation like for January show as ‘Jan’
- Full: show the month part in full like for January show as ‘January’
- None: to remove showing month altogether
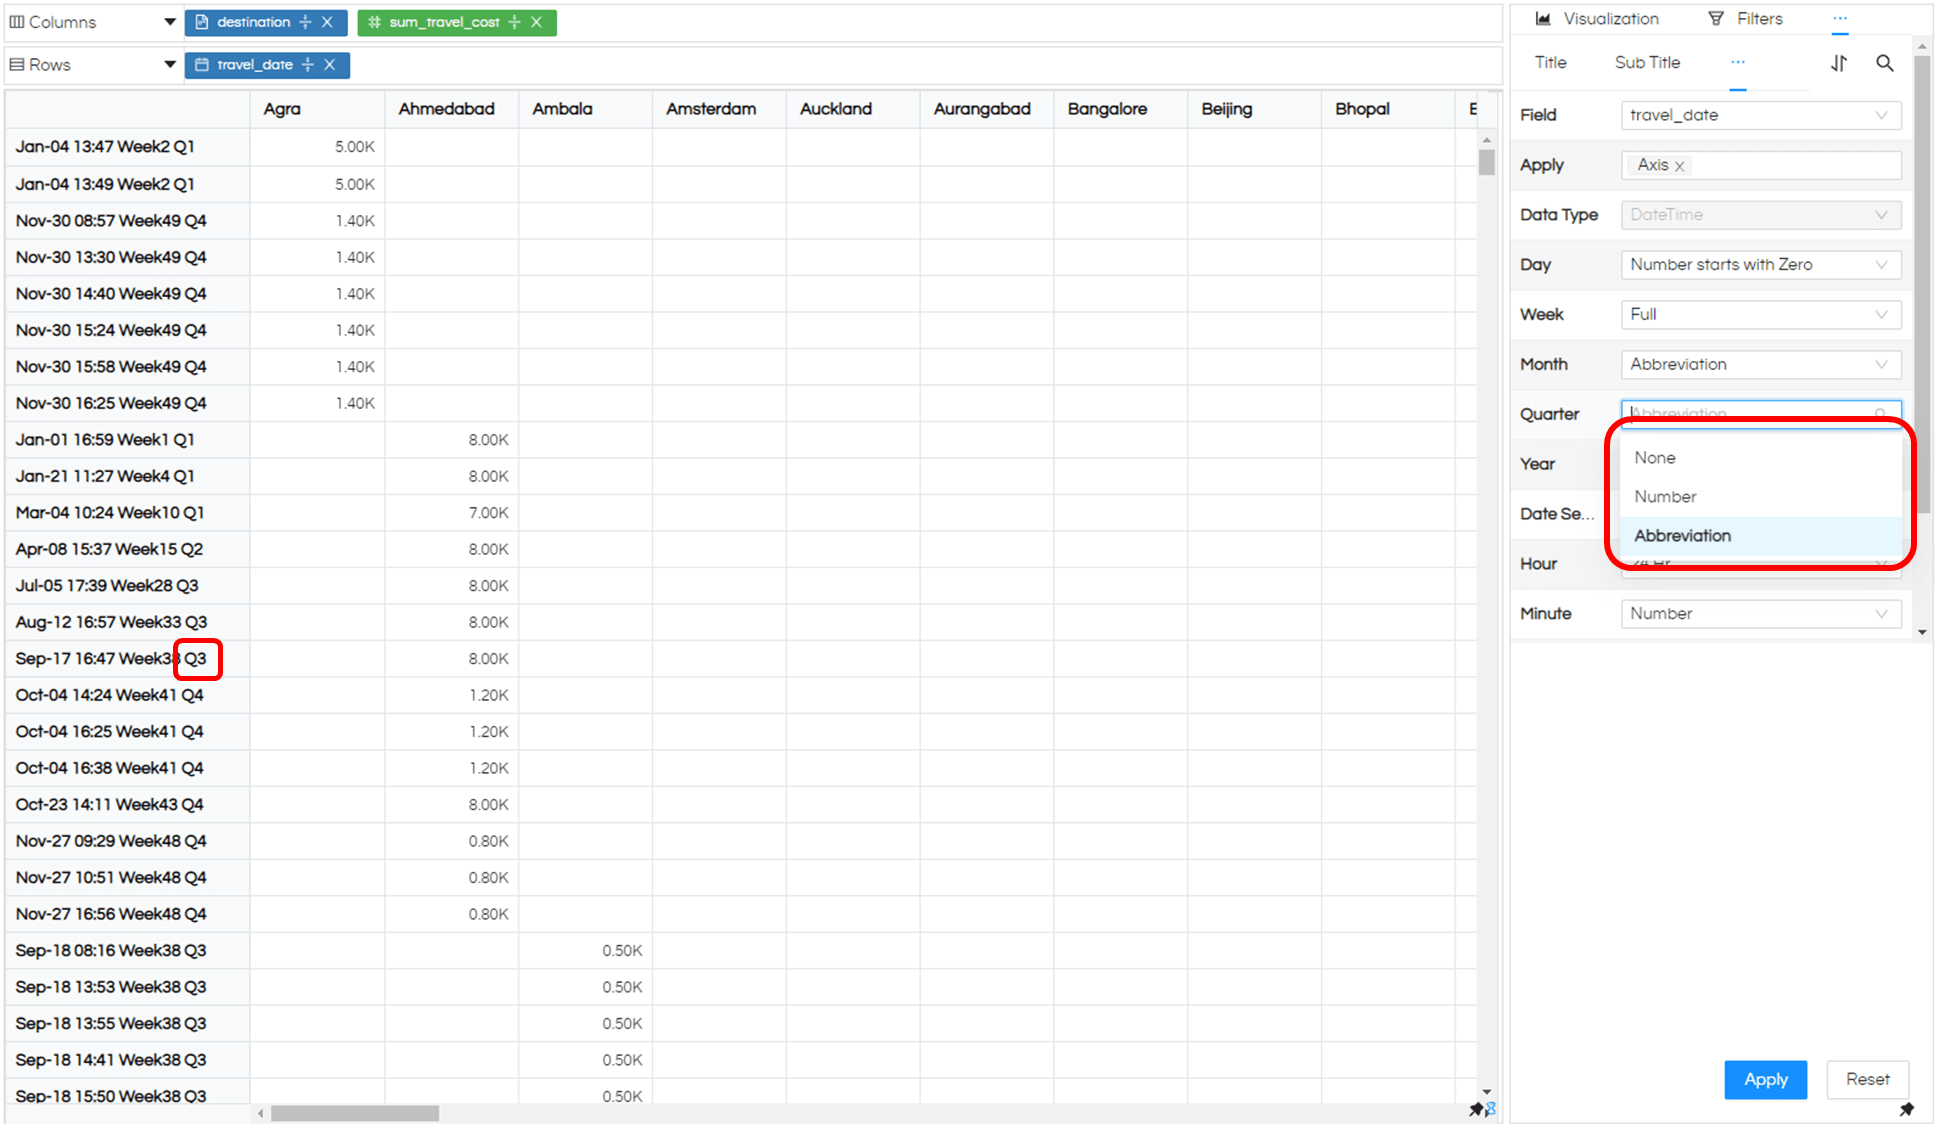
Quarter gives you option to calculate and add the quarter of the year for the given date. If you enable week along with quarter, quarter values will be appended after date, time and week values
- None:does not calculate or show the quarter number
- Number: appends the quarter of the year to which the date belongs
- Abbreviation: adds ‘Q’ before the quarter number to show the quarter part of the date time formatting
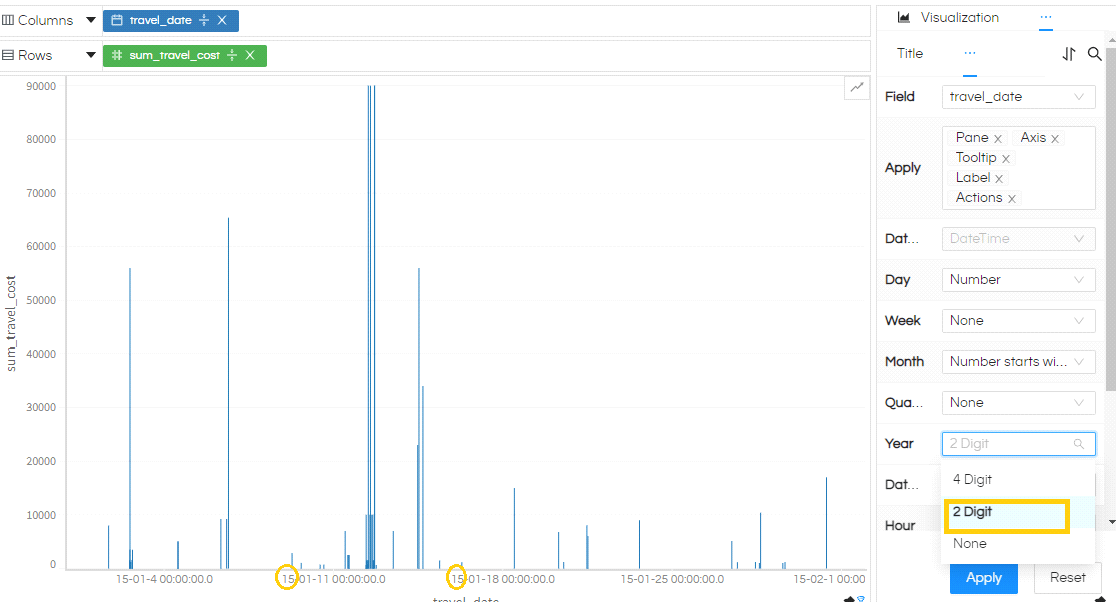
Year gives you option to change year part of the date
- 4 Digit: shows the year part in 4-digit format. Ex: 1999 will be shown as ‘1999’
- 2 Digit: shows the year part in 2-digit format. Ex: 1999 will be shown as ‘99’
- None: will remove the year part from being displayed.
Date Separator gives you choice of using a symbol between year month and date part of the date format you define. You can select from various common date separator symbols like
- hyphen ‘–’
- comma ‘,’
- forward slash ‘/’
- period (dot) ‘.’
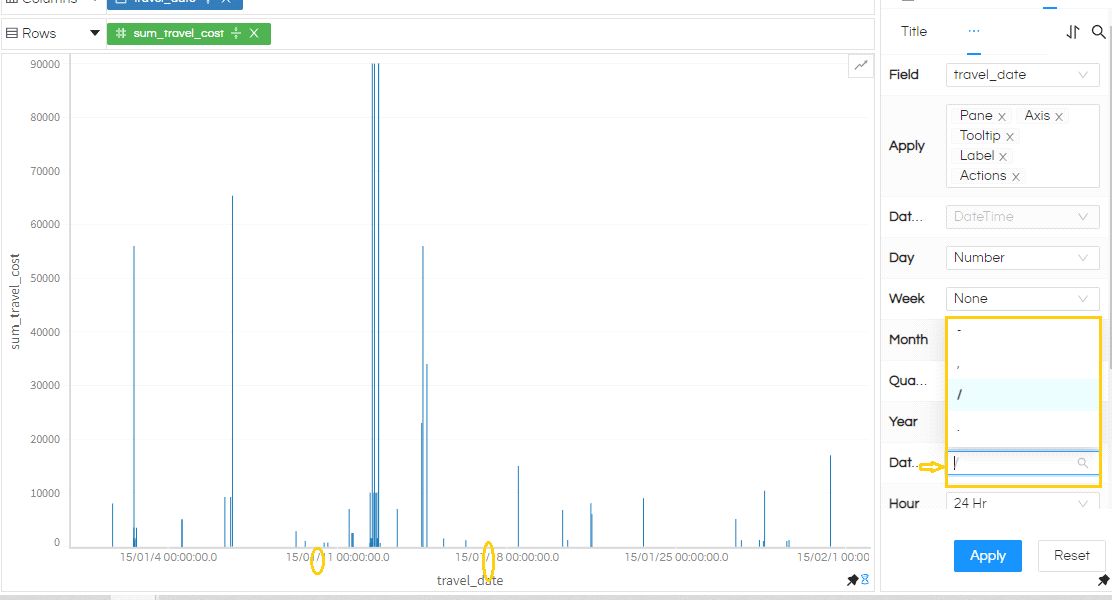
Based on our data type is date-time, we can see that time formatting option are available to us. Let us go through these options too.
Hour lets you control the formatting of hour part of the time
-
- 12 Hr: shows the time in 12-hour format, number ‘01’ through ‘12’ with ‘am’ or ‘pm’ appended after the time part of value.
- 24 Hr: shows the time in 24-hour format, numbers ‘00’ through ‘23’
- None: removes the hour part from being displayed.
Minute, Second and Millisecondgives you option to display or hide the minute, second or millisecond part with option of ‘Number’ and ‘None’.
Time Separator can be used to select the time separator of your choice from the list.
1.2 Formatting Numbers
Just like formatting date values we can format numbers. In the same place (Properties>Format) Select the numeric field you want to apply formatting to. In the example below we have used ‘travel_cost’ as the field and an aggregation of ‘sum’ is applied on it
When you click on box in front of Field, you will see that all numeric and date datatype is available in this Field.
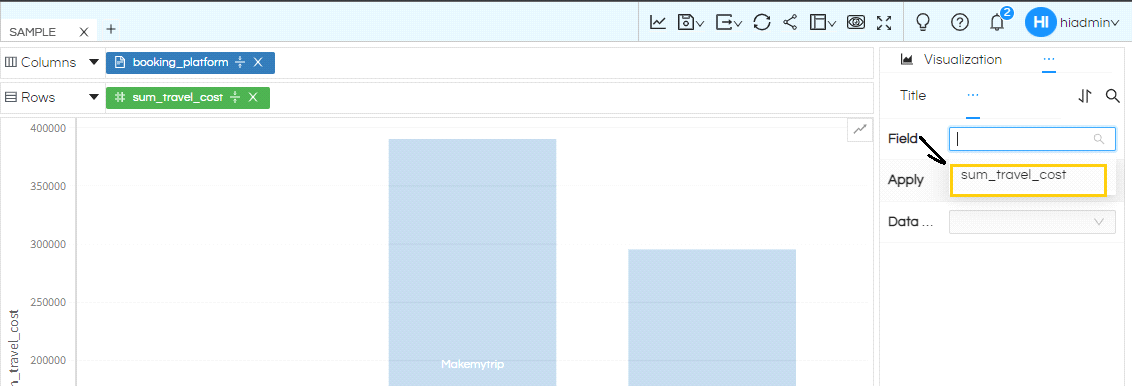
Select ‘sum_travel_cost’ and the all the all the formatting options for that numeric datatype will be shown in the panel.
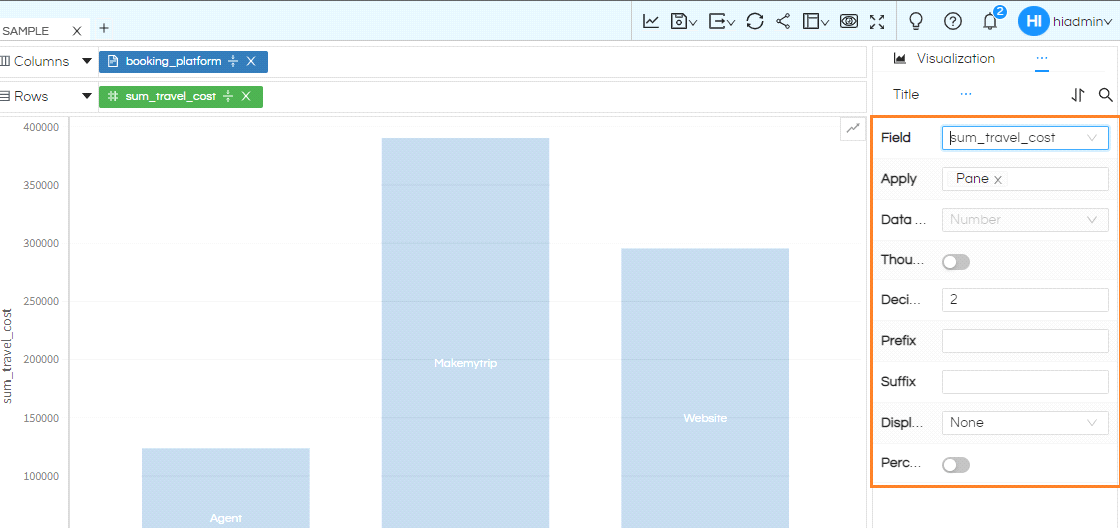
Apply can be used in the same way as discussed before with exact same options of Axis, Pane, Tooltip, Label and Actions.
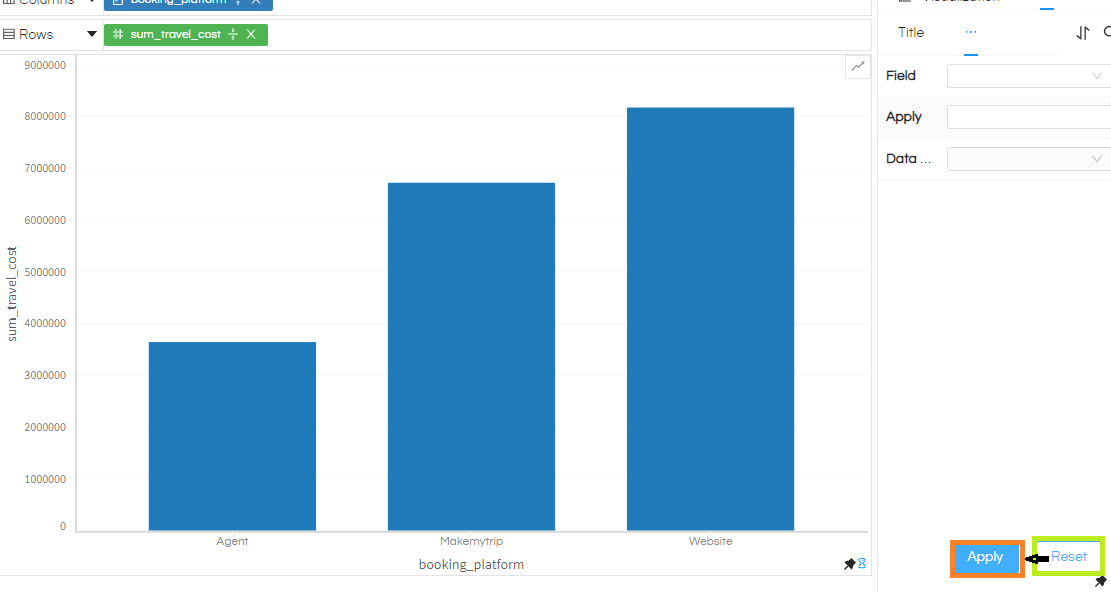
Below is the image of a sample report where travel cost in not formatted.
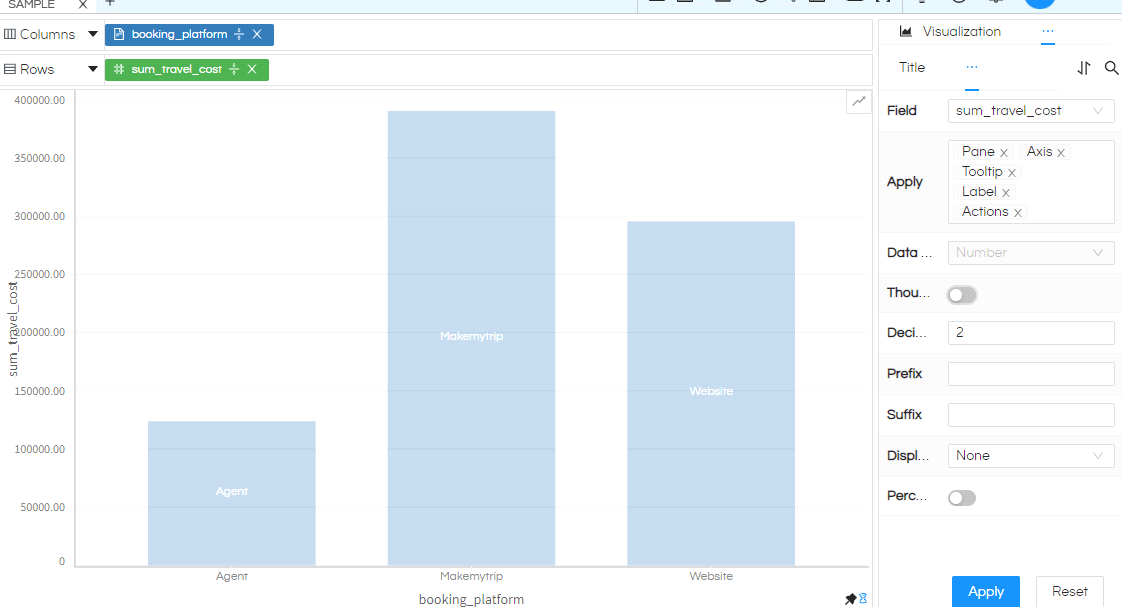
Now let us format the ‘sum_travel_cost’.
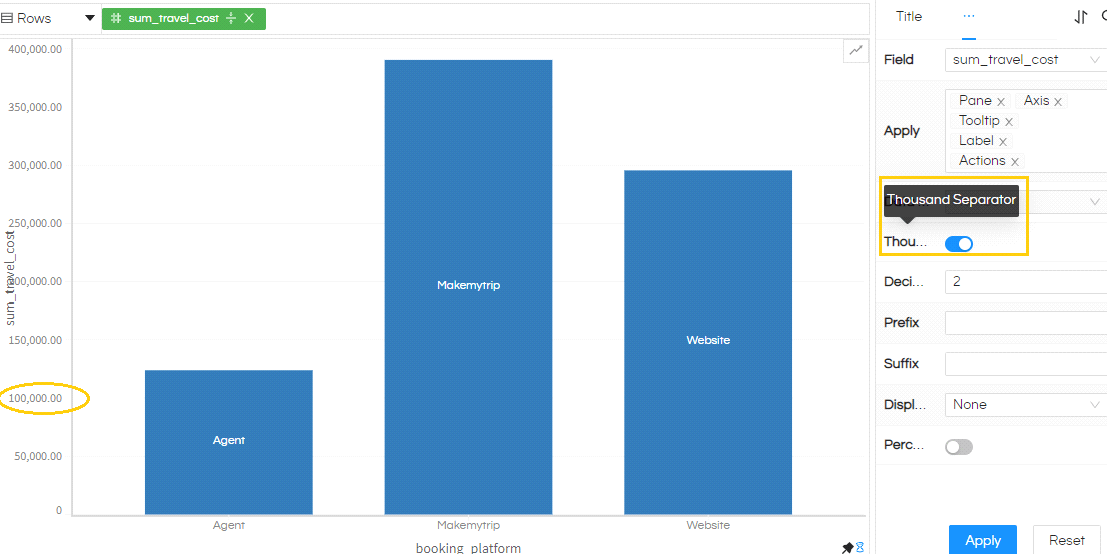
Enabling Thousand Separator will add a comma separator to make it readable as standard 3 places separator.
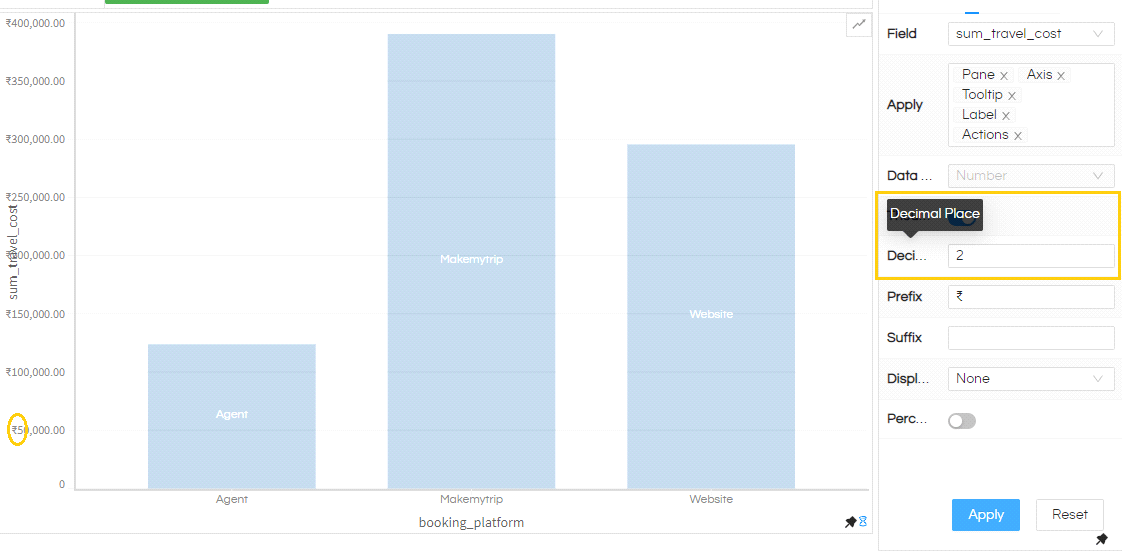
Decimal makes specified number of decimal places in the visualization anything with more decimal places will be rounded off to 2 decimal place. Here in the image the value is set to 2 decimal places.
Prefix letsyou to add text string or symbol before the number. We have added Rupee symbol for prefix.
Similarly, Suffix lets you to add text string or symbol after the number.
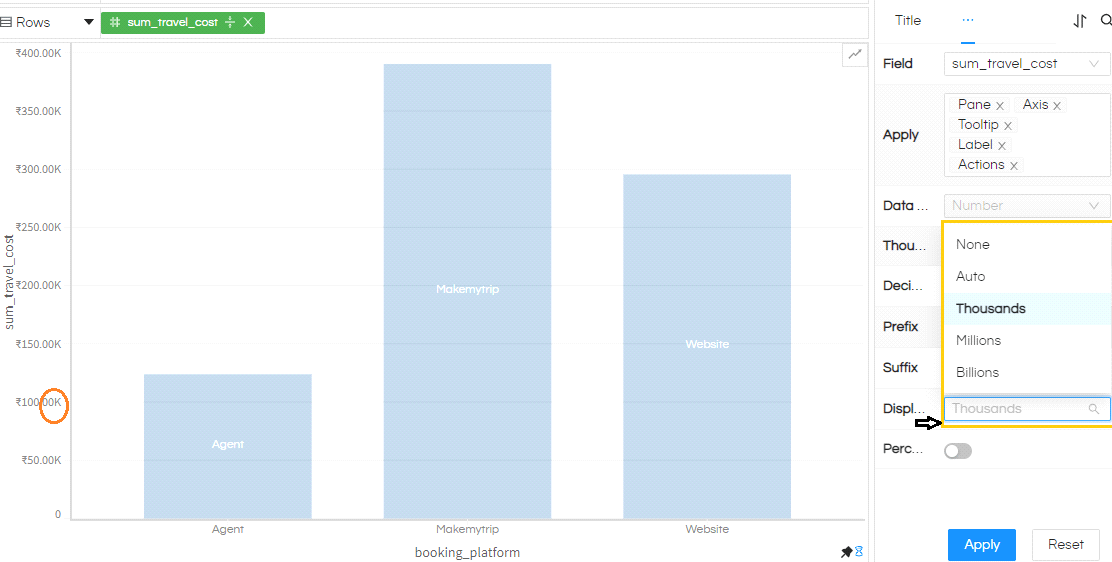
Display Units which will convertnumbers according to the chosen option
- None: No conversion will be applied.
- Auto: Convert each value based on how big the number is.
- Thousands: Will convert all values by reducing three digits and automatically apply ‘K’ in the end
- Millions: Will convert all values by reducing six digits and automatically apply ‘M’ in the end
- Billions: Will convert all values by reducing 9 digits and automatically apply ‘B’ in the end
Please note if we have other options like decimal places applied, then proper conversion to 2 decimal places will still be applied by the application.
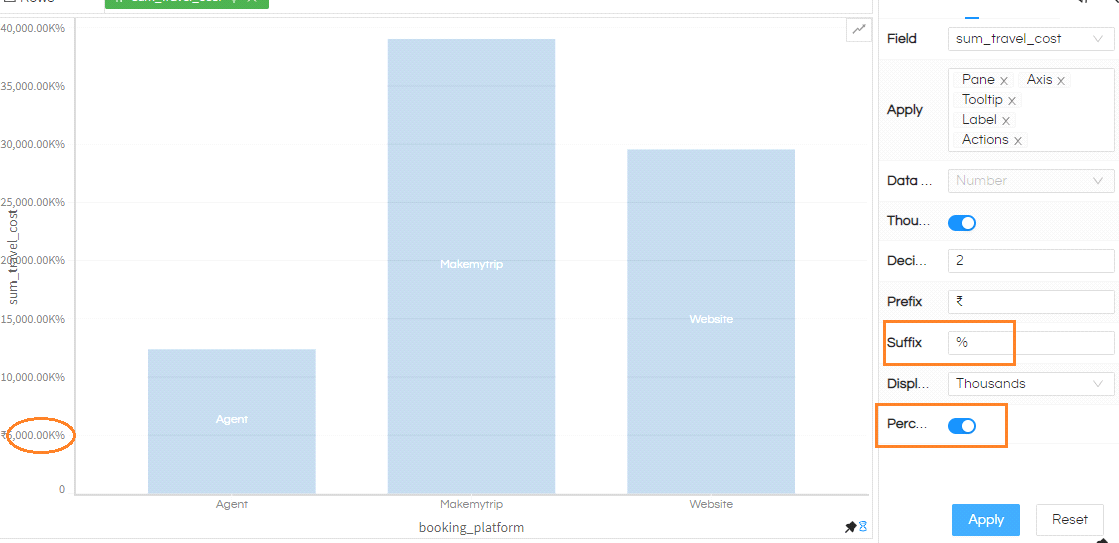
Percentage will show the numbers as percentage by multiplying the travel cost with 100 and add % in the Suffix.
Point to note
After the required formatting is done, do not forget to click Apply from the button to see the changes in your report.
Resetbutton at the bottom will reset the format settings to the default. If you want to reflect the removal of settings, after Reset, also select Apply to see the changes.
These values are only displayed in given format, the actual values are still the same as coming from DB, you can control if same value needs to be displayed in specific format in one place while in another place it should remain same as in database. Like in table you can have apply the formatting to Pane while in Action Menu you let the original values be there.
Version 5.2.3 Enhancement:
Below are few additional options introduced in version 5.2.3
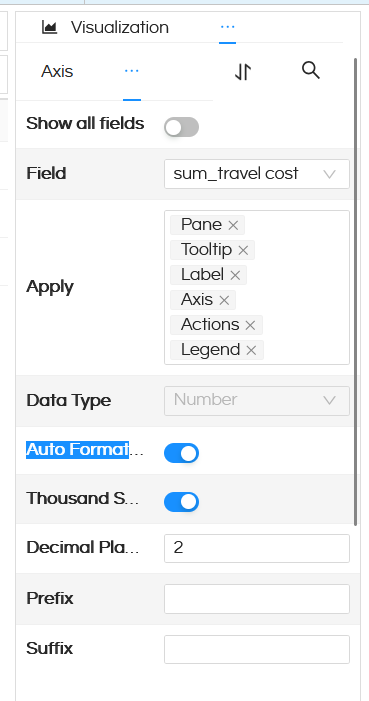
Auto Format:By default auto format will get applied, which can help in saving a lot of time and efforts in doing formatting in most of the cases. Hence, any measure/number which is created, automatically it will appear as thousand separator with 2 decimal digits and right aligned. Even though auto formatting is applied, if you still want to make changes like number of decimal digits or prefix suffix etc you can always do that.
You can also disable Auto Format option as well.
Space Before: This is the second property which is newly added from version 5.2.3. In case if you format the numbers and show it like K M B etc, then in many cases you would ideally like the numbers to be visible as 12.5 K and not 12.5K.
Hence space before will put one space between the numbers and the display unit (like K M B etc). This helps in improving the readability.
Version 6.2 Enhancement:
From version 6.2 we have added a new option allowing you to put expressions and apply any sort of custom formatting which is not provided from the UI driven option.
For example, some of the use cases are
- Show negative numbers in braces like instead of -17, show as (17)
- Show positive numbers in green color, negative in red etc
- Show date data with a prefix and a custom date type, like : “Date is : Monday 17 April 2026”
In this blog (Custom Formatting in Properties), we have covered in detail about the usage of the custom formatting options.
