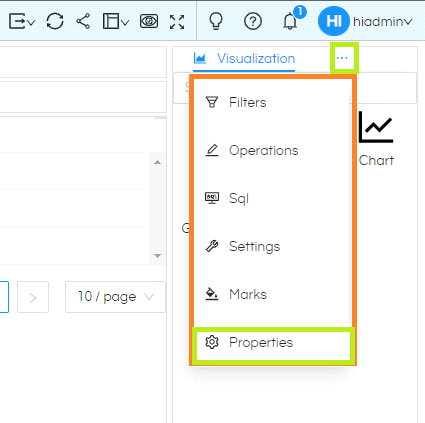
Please note that this blog is relevant to version 5.0 or higher of Open Source BI product Helical Insight. A legend gets created when we add fields in Marks option for any visualization. This is useful to display the values which gets generated by different color, size, or other properties. Legends by default goes to top right in Grid Chart and likewise to the right in More Charts. The same can be controlled with chart properties. To see legend options on report, select the meatball icon on top right. List of additional menu options will appear. Select ‘Properties‘ from this list. From that select Properties. Please note that this is only relevant to Grid Charts and More Charts.
Again, select the meatball icon within properties in front of Title. A list of additional options for Properties will appear. Select Legend from here.
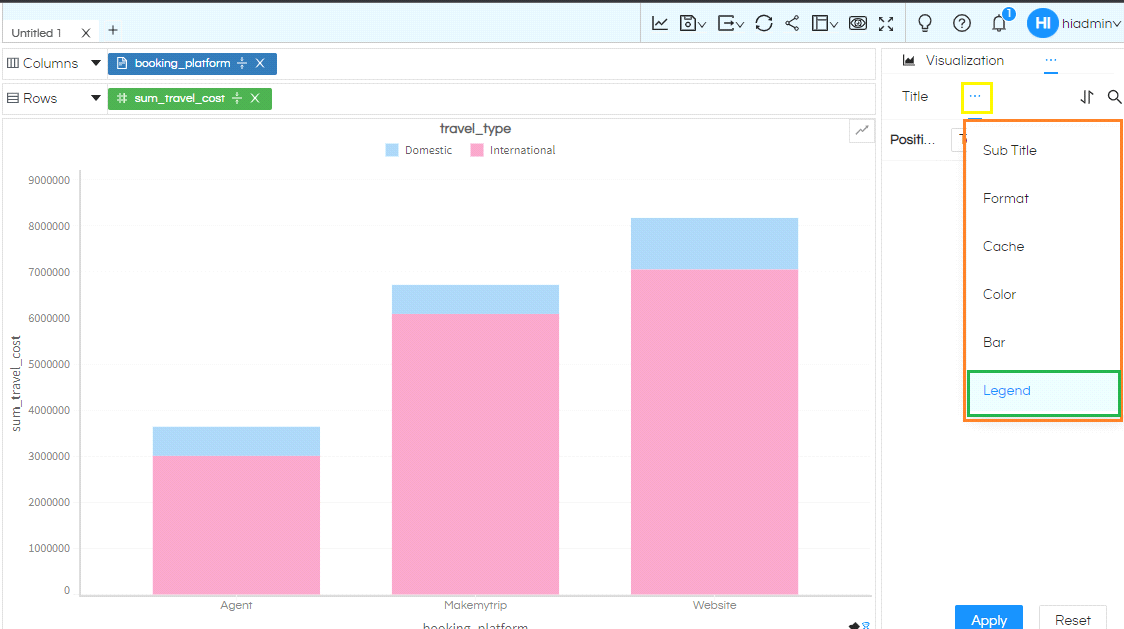
This gives us the option to control the position of Legend to any of the 4 sides or turn in off altogether.
In the image below, legend is present on the Top of the Grid Chart as Position selected is ‘Top’. Based on your needs select the option and click on Apply button
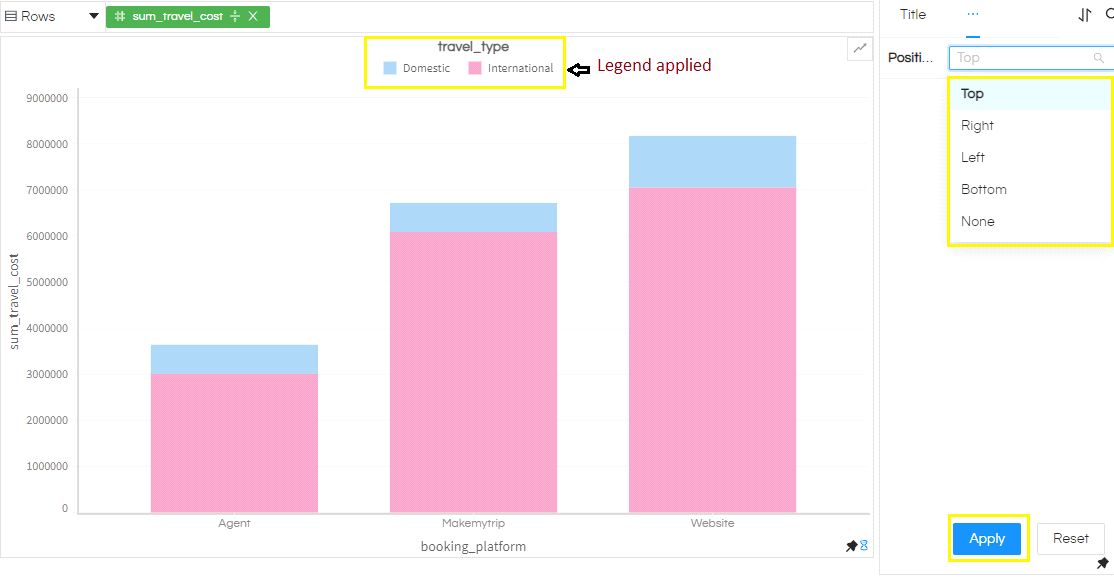
Top: The legend will be present at the top of the visualization
Right: Legends will be present at the right of the visualization
Left: Legends will be present at the left of the visualization
Bottom: Legends will be present at the bottom of the visualization
None: When this option is selected, the legends will get removed. If you have many data points because of which there are many legends which can make it look not so good. In those cases you can remove the legend using the “None” option.
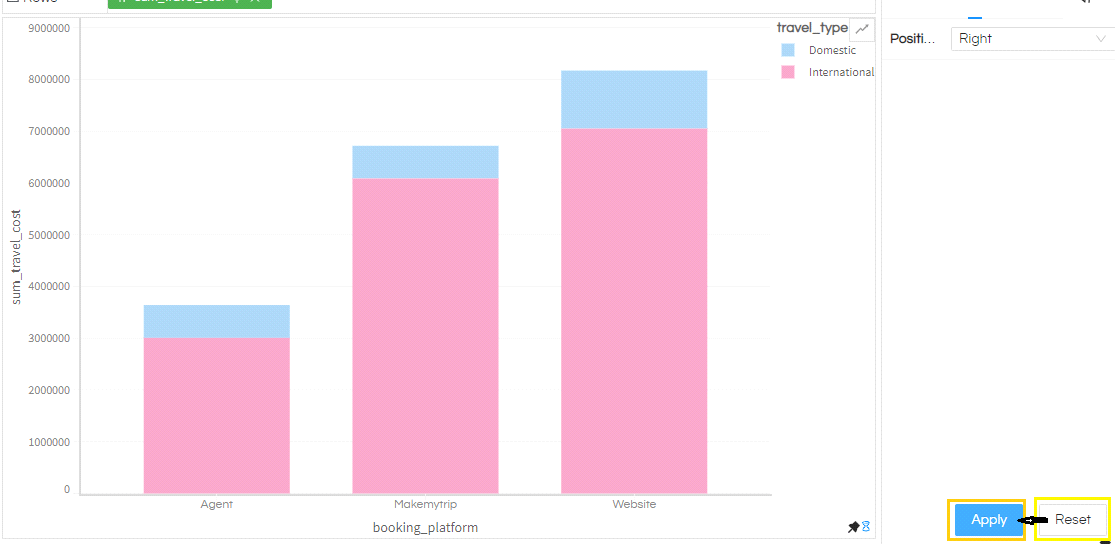
‘Reset will reset the dropdown to default status. Always remember to select Apply after choosing Reset.