
📌 Key Takeaways
- Helical Insight offers one of the most complete free open source BI platforms with dashboards, paginated pixel-perfect reporting, embedded analytics, white labeling, multi-tenancy, AI-powered analytics, scheduling, report bursting, and extensive developer customization. Get Free Forever
- Apache Superset is well suited for organizations that primarily need interactive dashboards and SQL-based data exploration.
- Metabase is ideal for teams looking for a simple, user-friendly self-service BI experience with minimal setup.
- Knowage provides a broad collection of traditional BI capabilities for organizations requiring multiple analytical components.
- Pentaho Community Edition remains useful for organizations with existing Pentaho ecosystems, although some enterprise capabilities require commercial offerings.
- Lightdash is designed for modern analytics teams that use dbt and cloud data warehouses.
- Eclipse BIRT focuses primarily on operational and embedded reporting rather than comprehensive self-service analytics.
- KNIME Analytics Platform specializes in visual data science workflows, advanced analytics, and machine learning rather than traditional BI reporting.
- ReportServer Community Edition is suitable for organizations that need centralized report management across multiple reporting engines.
- Seal Report is a lightweight reporting solution for Microsoft SQL Server environments and operational reporting use cases.
Open source Business Intelligence (BI) tools help organizations transform raw data into interactive dashboards, reports, and actionable insights without the expensive licensing costs of proprietary BI software. These platforms provide the flexibility to customize, scale, and deploy analytics on-premises, in the cloud, or in hybrid environments, making them suitable for startups, SMEs, and large enterprises alike.
In this guide, we compare the 10 Best Free Open Source BI Tools: Helical Insight, Apache Superset, Metabase, Eclipse BIRT, Pentaho Community Edition, KNIME Analytics Platform, Lightdash, ReportServer Community Edition, Seal Report, and Knowage. We evaluate each platform based on its reporting capabilities, dashboarding, self-service analytics, embedded BI, AI features, ease of use, scalability, deployment options, and ideal use cases to help you choose the right solution for your business.
📊 Open Source BI Tools Comparison
The following comparison table provides a quick overview of the 10 Best Free Open Source BI Tools based on key capabilities such as interactive dashboards, pixel-perfect reporting, self-service analytics, embedded BI, AI features, deployment options, and enterprise functionality. If you’re looking for a fast way to compare leading BI platforms, this table highlights their core strengths and helps you identify the solution that best fits your business needs.
| Feature | 🥇 Helical Insight | Apache Superset | Metabase | Eclipse BIRT | Pentaho CE | KNIME | Lightdash | ReportServer CE | Seal Report | Knowage |
|---|---|---|---|---|---|---|---|---|---|---|
| Open Source | ✅ Download Open Source |
✅ | ✅ | ✅ | ✅ | ✅ | ✅ | ✅ | ✅ | ✅ |
| Interactive Dashboards | ✅ | ✅ | ✅ | Limited | ✅ | Limited | ✅ | Limited | Limited | ✅ |
| Pixel-Perfect Reporting | ✅ | ❌ | Basic | ✅ | Basic | ❌ | ❌ | ✅ | ✅ | ✅ |
| Self-Service BI | ✅ | ✅ | ✅ | Limited | Limited | Limited | ✅ | Limited | Limited | ✅ |
| Embedded Analytics | ✅ | Limited | Limited | ✅ | Limited | ❌ | Limited | Limited | Limited | ✅ |
| AI Features | ✅ | Limited | Basic | ❌ | ❌ | ✅ | Limited | ❌ | ❌ | Basic |
| Data Visualization | ✅ | ✅ | ✅ | Basic | ✅ | Basic | ✅ | Basic | Basic | ✅ |
| Report Scheduling | ✅ | Limited | Limited | Limited | Limited | ❌ | Limited | ✅ | Limited | ✅ |
| White Labeling | ✅ | ❌ | ❌ | Limited | Limited | ❌ | ❌ | ❌ | ❌ | Limited |
| Multi-Tenancy | ✅ | ❌ | ❌ | ❌ | Limited | ❌ | ❌ | ❌ | ❌ | Limited |
| REST API Support | ✅ | ✅ | ✅ | Limited | ✅ | ✅ | ✅ | Limited | Limited | ✅ |
| Cloud & On-Premises Deployment | ✅ | ✅ | ✅ | ✅ | ✅ | ✅ | ✅ | ✅ | Windows | ✅ |
| Best For | Complete Open Source BI Platform | SQL Analytics | Self-Service BI | Reporting | ETL & BI | Data Science | dbt Analytics | Report Management | SQL Reporting | Enterprise BI |
🏆 Why Helical Insight is #1
Helical Insight provides the broadest combination of interactive dashboards, pixel-perfect reporting, self-service analytics, embedded BI, AI-powered analytics, white labeling, multi-tenancy, report scheduling, report bursting, and flexible deployment within a single open source BI platform. This comprehensive feature set makes it an excellent choice for startups, SMBs, large enterprises, consulting companies, and software vendors building embedded analytics solutions.
Ready to Try the #1 Free Open Source BI Tool?
Build interactive dashboards, paginated pixel-perfect reports, self-service analytics, embedded BI, and AI-powered insights with one powerful Free & Open Source Business Intelligence platform.
10 Best Free Open Source BI Tools in 2026
We compared the leading free open source Business Intelligence (BI) tools based on dashboards, paginated pixel-perfect reporting, self-service analytics, embedded BI, AI capabilities, deployment flexibility, enterprise features, ease of use, and overall value to help you choose the right platform for your organization.
🥇 1. Helical Insight – Best Overall Free Open Source BI Tool
Company Overview
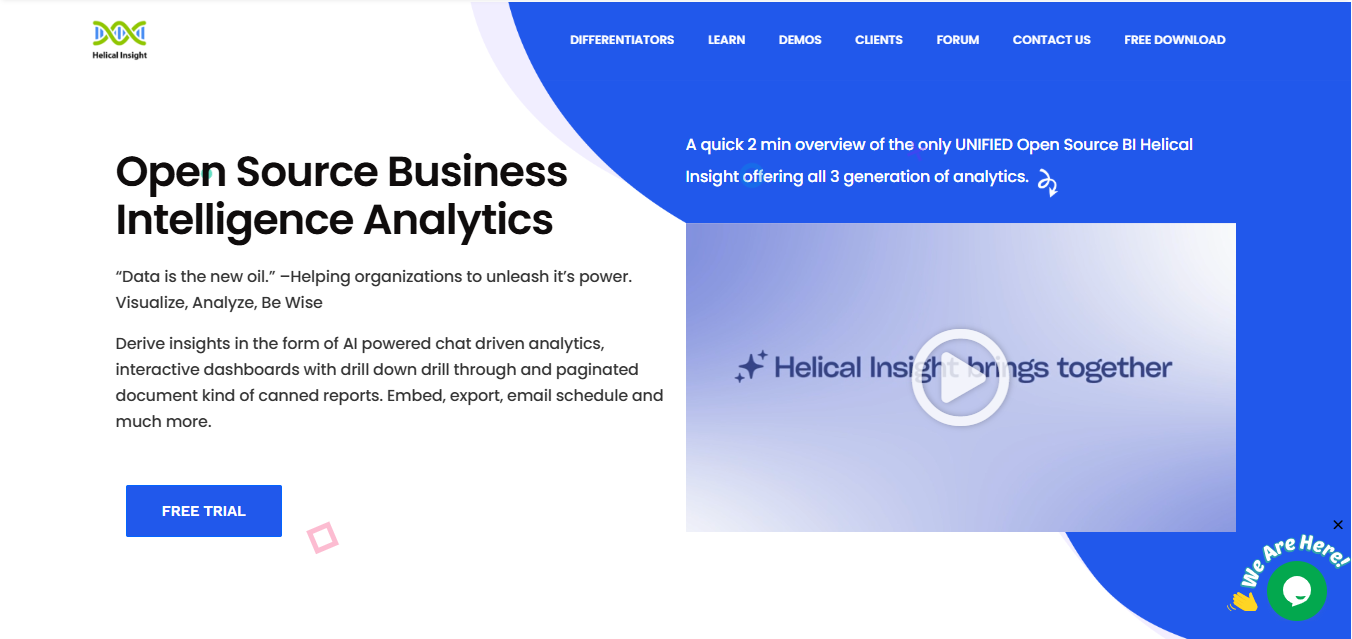
Helical Insight is an free open source Business Intelligence (BI) platform developed by Helical IT Solutions, a company specializing in modern business intelligence, reporting, embedded analytics, and enterprise data visualization solutions. The platform is designed for organizations that want complete ownership of their analytics infrastructure while avoiding expensive proprietary BI licensing costs.
Built on an extensible and developer-friendly architecture, Helical Insight combines enterprise-grade capabilities with the flexibility of open source software. Today it is used by startups, SMBs, enterprises, government organizations, educational institutions, healthcare providers, financial services companies, manufacturers, and software vendors that require scalable and customizable analytics solutions.
Product Overview
Helical Insight is a complete Business Intelligence platform that enables organizations to transform raw data into meaningful business insights through interactive dashboards, pixel-perfect reports, self-service analytics, embedded BI, and AI-powered analytics. Unlike many open source BI tools that focus only on dashboards or reporting, Helical Insight combines multiple business intelligence capabilities into one unified platform, reducing complexity while improving productivity.
Business users can build reports and dashboards without requiring deep technical knowledge, while developers can customize almost every component using JavaScript, CSS, REST APIs, and an extensible framework. The platform supports AI-powered conversational analytics, report scheduling, report bursting, white labeling, multi-tenancy, role-based security, and flexible deployment across Windows, Linux, Docker, Kubernetes, cloud, hybrid, and on-premises environments.
Key Features
✅ Pros
- Combines dashboards, paginated pixel perfect reporting, self-service BI, and embedded analytics within one platform.
- Enterprise features such as white labeling, multi-tenancy, report scheduling, and report bursting.
- Suitable for both business users and technical teams.
- Flexible deployment on cloud, on-premises, Docker, Kubernetes, Windows, and Linux.
- AI-powered conversational analytics simplifies data exploration.
- Highly customizable through REST APIs, JavaScript, CSS, and plugins.
- Supports secure role-based access control.
- Excellent platform for OEM and embedded analytics solutions.
❌ Cons
- Extensive capabilities may require some learning for first-time users.
Best For
Helical Insight is ideal for organizations looking for a complete open source Business Intelligence platform rather than deploying separate tools for dashboards, reporting, embedded analytics, and self-service BI.
It is particularly well suited for startups, SMBs, enterprises, government organizations, educational institutions, healthcare providers, financial services companies, manufacturers, consulting firms, and software vendors that require interactive dashboards, paginated pixel-perfect reporting, embedded analytics, AI-powered analytics, white labeling, multi-tenancy, report scheduling, report bursting, enterprise-grade security, and flexible deployment from a single unified platform.
Why Helical Insight is the Best Open Source BI Tool
Dashboards, reporting, embedded BI, self-service analytics, and AI in one solution.
Easily embed reports and dashboards into SaaS products and enterprise applications.
Ask questions using natural language and receive instant business insights.
Customize logos, themes, branding, and user experience for your customers.
Multi-tenancy, role-based security, report bursting, scheduling, and APIs.
Deploy on Windows, Linux, Docker, Kubernetes, cloud, hybrid, or on-premises.
Watch Helical Insight in Action
See how Helical Insight enables organizations to build interactive dashboards, paginated pixel-perfect reports, embedded analytics, and AI-powered business intelligence using a single open source platform.
Ready to Explore Helical Insight?
Experience one of the most comprehensive open source Business Intelligence platforms featuring interactive dashboards, pixel-perfect reporting, embedded analytics, AI-powered insights, white labeling, and enterprise scalability.
2. Apache Superset – Best Open Source BI Tool for Interactive Dashboards & SQL Analytics
Company Overview
Apache Superset is an open source Business Intelligence platform developed under the Apache Software Foundation. Originally created at Airbnb, it has evolved into one of the world’s most widely adopted open source dashboarding and analytics platforms.
Backed by a large global open source community, Apache Superset provides a scalable platform for organizations looking to build interactive dashboards, perform SQL-based analytics, and explore large datasets through modern visualizations.
Product Overview
Apache Superset is a modern Business Intelligence platform designed primarily for interactive dashboards, ad hoc analytics, and visual data exploration.
Users can connect to numerous SQL-compatible databases, create rich visualizations, and build interactive dashboards using a browser-based interface.
One of Superset’s standout capabilities is SQL Lab, an integrated SQL editor that enables analysts and data engineers to query data directly and transform results into visual dashboards.
The platform also supports role-based security, dashboard sharing, custom visualization plugins, REST APIs, and flexible deployment on cloud or on-premises infrastructure.
However, organizations requiring advanced pixel-perfect reporting, report bursting, or enterprise embedded analytics may require additional tools or custom development.
Key Features
✅ Pros
- Excellent dashboard creation and visualization capabilities.
- Powerful SQL-based analytics using SQL Lab.
- Highly scalable for large datasets.
- Large active Apache community.
- Supports numerous databases and connectors.
❌ Cons
- Limited built-in pixel-perfect reporting.
- Requires SQL knowledge for advanced analytics.
- Embedded analytics often requires additional implementation.
3. Metabase – Best Open Source BI Tool for Self-Service Analytics
Company Overview
Metabase is a popular open source Business Intelligence platform recognized for its simplicity, ease of use, and self-service analytics capabilities. Since its launch, it has become one of the most widely adopted BI solutions for startups, small and medium-sized businesses (SMBs), product teams, and organizations that want to empower employees to analyze data without relying heavily on technical teams.
Designed with business users in mind, Metabase provides an intuitive interface that enables anyone to create dashboards, visualize data, and answer business questions quickly. Its strong community support and straightforward deployment have made it a preferred choice for organizations beginning their business intelligence journey.
Product Overview
Metabase enables organizations to create interactive dashboards, visualize business data, and generate reports through an intuitive browser-based interface. Users can build charts, organize dashboards, schedule reports, and collaborate with team members without writing SQL.
For technical users, Metabase also includes a built-in SQL editor for creating advanced queries and customized reports. Its clean interface, rapid deployment, and focus on self-service analytics make it an excellent option for organizations looking to democratize data access. However, businesses requiring advanced pixel-perfect reporting, extensive customization, enterprise white-labeling, or sophisticated embedded analytics may need a more comprehensive BI platform.
Key Features
✅ Pros
- Very easy to learn and use.
- Fast installation and deployment.
- Excellent for non-technical business users.
- Supports a wide variety of databases.
- Strong community and comprehensive documentation.
❌ Cons
- Limited support for pixel-perfect and paginated reporting.
- Fewer enterprise customization capabilities.
- Advanced embedded analytics functionality is limited.
4. Eclipse BIRT – Best Open Source BI Tool for Pixel-Perfect Reporting
Company Overview
Eclipse BIRT (Business Intelligence and Reporting Tools) is a well-established open source reporting platform developed under the Eclipse Foundation. Since its introduction, BIRT has become one of the most recognized reporting frameworks for developers building reporting capabilities into enterprise software applications.
With a strong focus on operational reporting and report generation, Eclipse BIRT has been widely adopted by software vendors, enterprise application developers, government organizations, and businesses that require professionally formatted, printable reports integrated directly into Java applications.
Product Overview
Eclipse BIRT is primarily designed for report design, report generation, and embedded reporting. It enables developers to create highly formatted, pixel-perfect reports that can be integrated into Java applications and enterprise software systems.
The platform includes a powerful report designer, parameterized reporting, multiple export formats, charting capabilities, and flexible report templates. Unlike modern self-service Business Intelligence platforms, Eclipse BIRT focuses on structured reporting rather than interactive dashboards or AI-powered analytics. Organizations seeking comprehensive dashboarding, self-service BI, embedded analytics, or conversational analytics may require an additional BI platform alongside BIRT.
Key Features
✅ Pros
- Excellent for operational and printable reports.
- Strong Java application integration.
- Mature and reliable reporting framework.
- Highly customizable for developers.
- Supports multiple export formats.
❌ Cons
- Limited self-service Business Intelligence capabilities.
- Dashboard functionality is less comprehensive than modern BI platforms.
- Requires developer expertise for report design and customization.
Experience the Most Complete Open Source BI Platform
From dashboards and pixel-perfect reporting to embedded analytics, white labeling, multi-tenancy, and AI-powered insights—everything you need in one enterprise-ready open source BI platform.
5. Pentaho Community Edition – Best Open Source BI Tool for ETL & Traditional Business Intelligence
Company Overview
Pentaho Community Edition (CE) is the open source version of the Pentaho Business Intelligence platform. Over the years, it has become one of the most recognized open source BI solutions for organizations requiring business intelligence, reporting, analytics, and data integration.
Pentaho has earned a strong reputation for combining powerful ETL (Extract, Transform, Load) capabilities with reporting and analytics, making it a preferred choice for enterprises that manage large volumes of business data across multiple systems and databases.
Product Overview
Pentaho Community Edition provides a complete environment for data integration, dashboard creation, reporting, and OLAP analysis. Through Pentaho Data Integration (PDI), organizations can extract data from multiple sources, perform transformations, automate workflows, and prepare data for reporting and analytics.
The platform is particularly valuable for organizations looking to combine ETL and Business Intelligence within a single ecosystem. While Pentaho Community Edition delivers strong capabilities for traditional BI, several advanced enterprise features, modern self-service analytics, AI-powered insights, and enhanced governance capabilities are available only in commercial editions or require additional customization.
Key Features
✅ Pros
- Combines ETL and Business Intelligence in a single platform.
- Mature and well-established open source ecosystem.
- Excellent for complex data integration projects.
- Supports numerous databases and enterprise data sources.
- Flexible Java-based architecture for developers.
❌ Cons
- User interface feels dated compared to modern BI platforms.
- Community Edition lacks several enterprise capabilities.
- Learning curve can be steep for new users.
6. KNIME Analytics Platform – Best Open Source Platform for Data Science & Machine Learning
Company Overview
KNIME Analytics Platform is an open source platform designed for data analytics, machine learning, artificial intelligence, and data science. It is widely adopted by data scientists, analysts, researchers, universities, and enterprises that need powerful analytical capabilities without relying heavily on programming.
By providing a visual workflow-based environment, KNIME enables users to build sophisticated analytical pipelines through drag-and-drop components. Its flexibility and extensive ecosystem have made it one of the leading open source platforms for advanced analytics and predictive modeling.
Product Overview
KNIME Analytics Platform provides a visual workflow environment where users can connect to multiple data sources, prepare and transform data, perform advanced analytics, build predictive models, and automate analytical processes using reusable workflows.
The platform supports data blending, predictive analytics, statistical analysis, AI workflows, machine learning, and integrations with Python, R, Apache Spark, and big data platforms. Unlike traditional Business Intelligence tools that focus primarily on dashboards and reporting, KNIME emphasizes advanced analytics and data science. Organizations requiring executive dashboards or pixel-perfect reporting often combine KNIME with a dedicated BI platform.
Key Features
✅ Pros
- Excellent platform for data science and machine learning.
- No-code workflow development using drag-and-drop components.
- Extensive collection of analytical nodes and extensions.
- Strong integration with Python, R, and open source technologies.
- Large community with excellent documentation.
❌ Cons
- Not a traditional dashboard-centric Business Intelligence platform.
- Limited support for pixel-perfect operational reporting.
- Advanced workflows require analytics and data science knowledge.
7. Lightdash – Best Open Source BI Tool for dbt & Modern Data Stacks
Company Overview
Lightdash is an open source Business Intelligence platform built specifically for modern analytics teams working with dbt (data build tool) and cloud data warehouses. It enables business users and analysts to explore trusted business metrics while maintaining a consistent semantic layer across the organization.
By integrating directly with dbt projects, Lightdash helps organizations bridge the gap between data engineering and business intelligence. It ensures that teams work from a single source of truth, reducing inconsistencies in metric definitions and improving confidence in business reporting.
Product Overview
Lightdash allows users to create interactive dashboards, visualize business metrics, and perform self-service analytics directly from data models managed in dbt. Instead of recreating metrics inside the BI tool, Lightdash leverages existing dbt transformations, ensuring consistency between engineering teams and business users.
The platform is designed for cloud-native analytics environments and integrates seamlessly with modern cloud data warehouses. It offers collaborative dashboarding, SQL-powered exploration, and metric-based analysis through an intuitive browser interface. While it delivers an excellent experience for modern analytics teams, organizations requiring pixel-perfect reporting, highly formatted operational reports, or advanced embedded analytics may need additional BI solutions.
Key Features
✅ Pros
- Excellent choice for organizations using dbt.
- Modern, clean, and intuitive user interface.
- Ensures consistent business metric definitions.
- Supports collaborative analytics and dashboard sharing.
- Well suited for cloud-native analytics environments.
❌ Cons
- Best suited for organizations already using dbt.
- Limited support for pixel-perfect reporting.
- Smaller ecosystem compared to more mature BI platforms.
8. ReportServer Community Edition – Best Open Source BI Tool for Centralized Report Management
Company Overview
ReportServer Community Edition is an open source Business Intelligence and reporting platform designed to simplify enterprise report management, scheduling, and distribution. It enables organizations to centralize reports generated from multiple reporting engines into a single web-based portal, making business information easier to access, organize, and share across departments.
By providing a unified reporting environment, ReportServer helps organizations streamline report administration, improve governance, and automate report delivery. Its emphasis on centralized reporting makes it particularly valuable for enterprises managing large collections of operational and business reports.
Product Overview
ReportServer Community Edition provides a browser-based platform for creating, organizing, managing, scheduling, and distributing reports across an organization. One of its key advantages is support for multiple reporting engines, allowing businesses to consolidate reports from different technologies within a single interface.
Users can organize reports into folders, assign role-based permissions, automate report generation through scheduling, and distribute reports in multiple formats. While ReportServer includes dashboard capabilities, its primary strength lies in enterprise report administration rather than self-service analytics, AI-powered insights, or highly interactive dashboards. Organizations seeking advanced Business Intelligence capabilities may choose to integrate ReportServer with dedicated BI platforms.
Key Features
✅ Pros
- Excellent for centralized report administration.
- Supports multiple reporting engines in one platform.
- Powerful report scheduling and automated distribution.
- Easy report organization through folders and permissions.
- Well suited for enterprise reporting environments.
❌ Cons
- Limited self-service Business Intelligence capabilities.
- Dashboard functionality is less advanced than dedicated BI platforms.
- Smaller open source community compared to leading BI solutions.
9. Seal Report – Best Open Source Reporting Tool for SQL-Based Operational Reports
Company Overview
Seal Report is a lightweight open source reporting platform designed primarily for Microsoft SQL Server and other relational database environments. It enables organizations to quickly build operational reports, charts, and dashboards without requiring extensive development or complex BI infrastructure.
Its simplicity, fast deployment, and low resource requirements make Seal Report a practical solution for small businesses, internal reporting applications, and development teams that need an easy-to-use reporting tool for SQL-based data sources.
Product Overview
Seal Report provides a browser-based environment for creating reports, charts, and dashboards using SQL queries for data retrieval. Users can design parameterized reports, visualize business data, schedule report execution, and export reports into multiple formats, making it well suited for operational reporting requirements.
Unlike comprehensive Business Intelligence platforms, Seal Report focuses primarily on report generation rather than advanced self-service analytics, AI-driven insights, embedded analytics, or enterprise dashboarding. Organizations with straightforward reporting requirements will find it a lightweight and efficient solution, while enterprises with advanced BI needs may require a more feature-rich platform.
Key Features
✅ Pros
- Easy to install and configure.
- Excellent for SQL Server reporting environments.
- Lightweight and resource efficient.
- Well suited for operational and business reports.
- Open source and customizable.
❌ Cons
- Limited enterprise Business Intelligence capabilities.
- Basic dashboard functionality compared to modern BI platforms.
- Fewer advanced analytics and AI-powered features.
10. Knowage – Best Open Source Enterprise Business Intelligence Suite
Company Overview
Knowage is a comprehensive open source Business Intelligence suite designed to deliver a broad range of analytics capabilities through a single integrated platform. It combines interactive dashboards, reporting, data visualization, performance management, location intelligence, KPI monitoring, and advanced analytics, making it one of the most feature-rich open source BI platforms for enterprise environments.
Built with a modular architecture, Knowage enables organizations to implement only the components they need while maintaining the flexibility to expand their analytics capabilities as business requirements evolve. Its enterprise-oriented approach makes it suitable for organizations with complex reporting and analytics needs.
Product Overview
Knowage enables organizations to build interactive dashboards, generate pixel-perfect reports, perform multidimensional analysis, monitor business performance, and create customized analytics applications. It supports connectivity to numerous databases and enterprise data sources, allowing businesses to consolidate information across multiple systems.
The platform includes capabilities such as self-service Business Intelligence, KPI monitoring, location intelligence, OLAP analysis, scheduling, report distribution, and role-based security. Its extensive feature set makes Knowage well suited for enterprise analytics initiatives, although implementation and administration can require more technical expertise than lightweight BI platforms designed primarily for dashboard creation.
Key Features
✅ Pros
- Comprehensive enterprise Business Intelligence suite.
- Supports dashboards, reporting, performance management, and advanced analytics.
- Flexible modular architecture for enterprise deployments.
- Strong reporting and dashboard capabilities.
- Suitable for complex enterprise analytics environments.
❌ Cons
- More complex to implement than lightweight BI tools.
- User interface may require training for new users.
- Smaller open source community compared to some leading BI platforms.
Looking for a Better Open Source BI Tool?
Replace multiple analytics tools with a single platform for dashboards, pixel-perfect reports, self-service BI, embedded analytics, and AI-powered business intelligence.
FAQs: Free Open Source BI Tools
1. What is the best free open source BI tool?
The best free open source BI tool depends on your organization’s requirements. However, if you need a complete Business Intelligence platform that combines interactive dashboards, pixel-perfect reporting, self-service analytics, embedded analytics, AI-powered conversational analytics, report scheduling, and enterprise-grade security, Helical Insight is one of the strongest choices. Unlike many open source BI tools that specialize in only dashboards or reporting, Helical Insight delivers a comprehensive analytics platform within a single solution.
2. Which open source BI tool is best for dashboards and reporting?
Most open source BI tools focus primarily on either dashboards or reporting. If your organization requires both interactive dashboards and pixel-perfect operational reports within the same platform, Helical Insight is an excellent choice. Apache Superset is widely used for dashboarding, while Eclipse BIRT is primarily designed for operational and printable reporting.
3. Which is the best open source alternative to Microsoft Power BI?
If you’re looking for an open source alternative to Microsoft Power BI, Helical Insight is one of the leading options because it offers dashboards, self-service analytics, embedded BI, AI-powered analytics, enterprise reporting, and flexible deployment without vendor lock-in. Other popular alternatives include Apache Superset, Metabase, Knowage, and Pentaho Community Edition, depending on your reporting and analytics requirements.
4. What is the difference between open source BI tools and proprietary BI software?
Open source BI platforms provide access to the source code, allowing organizations to customize the software, deploy it on their preferred infrastructure, and avoid recurring licensing fees. Proprietary BI tools typically require paid licenses but often include commercial support and managed services. Platforms such as Helical Insight combine the flexibility of open source software with enterprise support, customization, and professional services when required.
5. Which open source BI tool is best for embedded analytics?
For organizations building SaaS products or customer-facing applications, Helical Insight is one of the strongest open source platforms for embedded analytics. It supports white labeling, REST APIs, multi-tenancy, role-based security, JavaScript integration, and flexible embedding options, making it easy to integrate dashboards and reports into existing web applications.
6. What features should I look for in an open source BI tool?
A modern Business Intelligence platform should provide interactive dashboards, pixel-perfect reporting, self-service analytics, embedded BI, AI-powered analytics, report scheduling, report bursting, role-based security, REST APIs, extensive database connectivity, and flexible deployment options. Helical Insight includes all of these capabilities within a single platform, making it suitable for organizations of all sizes.
7. Which open source BI tool is best for enterprises?
Enterprise organizations require scalability, security, governance, scheduling, embedded analytics, and flexible deployment. Helical Insight addresses these requirements through features such as multi-tenancy, white labeling, role-based security, report bursting, Docker and Kubernetes support, cloud deployment, and extensive customization capabilities, making it one of the strongest enterprise-ready open source BI platforms.
8. Are free open source BI tools suitable for large organizations?
Yes. Many enterprises, government agencies, healthcare providers, and financial institutions successfully use open source BI software for reporting and analytics. The key is selecting a platform that supports enterprise-grade security, scalability, and customization. Helical Insight is designed to support organizations ranging from startups to large enterprises with flexible deployment and enterprise-level capabilities.
9. Which open source BI tool supports AI-powered analytics?
AI is becoming an essential capability in modern Business Intelligence. Helical Insight includes AI-powered conversational analytics, allowing users to ask questions in natural language and receive meaningful business insights. When evaluating AI-enabled BI platforms, organizations should also compare reporting capabilities, dashboard functionality, customization options, deployment flexibility, and overall scalability.
10. How do I choose the right open source BI tool for my business?
The right Business Intelligence platform depends on your reporting requirements, dashboard needs, deployment preferences, data sources, scalability, security, and technical expertise. If you need a complete solution that combines interactive dashboards, pixel-perfect reporting, self-service BI, embedded analytics, AI-powered insights, enterprise security, and flexible deployment, Helical Insight is one of the best free open source BI tools to evaluate. Organizations with more specialized requirements may also consider platforms such as Apache Superset, Metabase, Knowage, Pentaho Community Edition, or KNIME based on their specific use cases.
