
Overview
There are many scenarios where we need to identify the top-performing or bottom-performing records from a dataset. For example, you may want to display the Top 5 employees, Top 10 products, Bottom 5 destinations, or any other Top N / Bottom N analysis.
In this blog, we will explain how to create Top 5, Top N, Bottom 5, and Bottom N type of reports in Open Source BI Helical Insight interactive reports designer module (HReport). This blog is relevant in case if you are using upwards of version 5.0 onwards.
The approach is simple. We need to perform two steps:
- Limit the number of records to the required value.
- Apply sorting in the appropriate direction.
By combining these two options, you can easily create Top N and Bottom N reports.
Step 1: Open the HReport options
While creating or editing an HReport, click the (…) three-dot menu to open the available options.
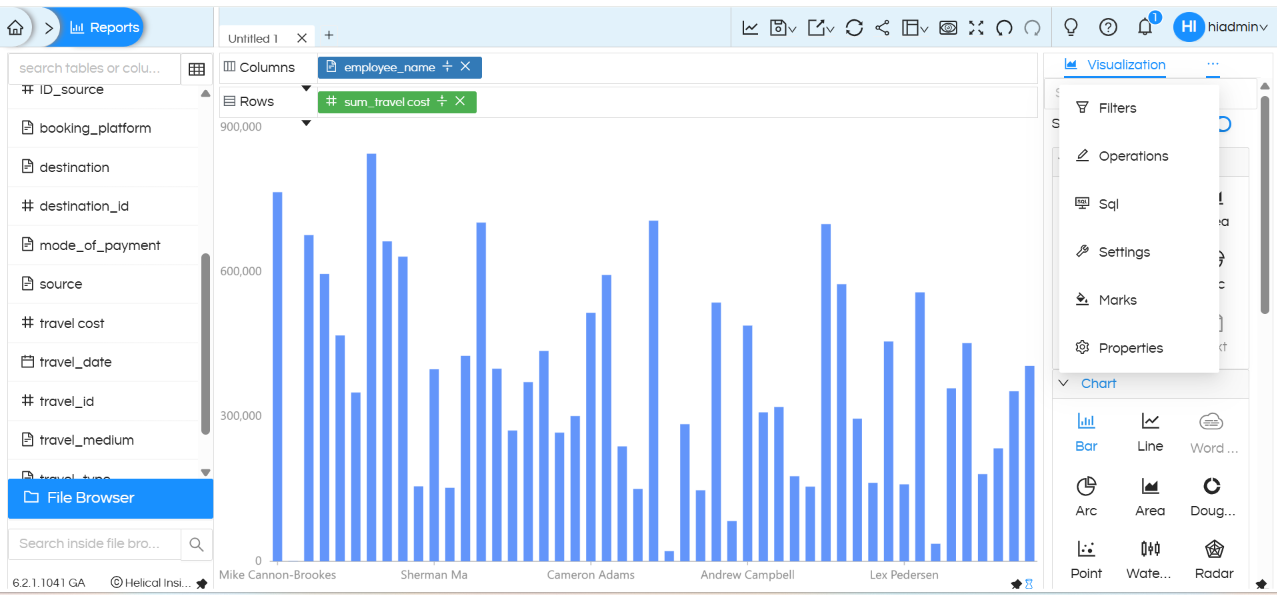
Screenshot showing the three-dot menu in the HReport interface.
Step 2: Select Settings
From the list of available options, click Settings.
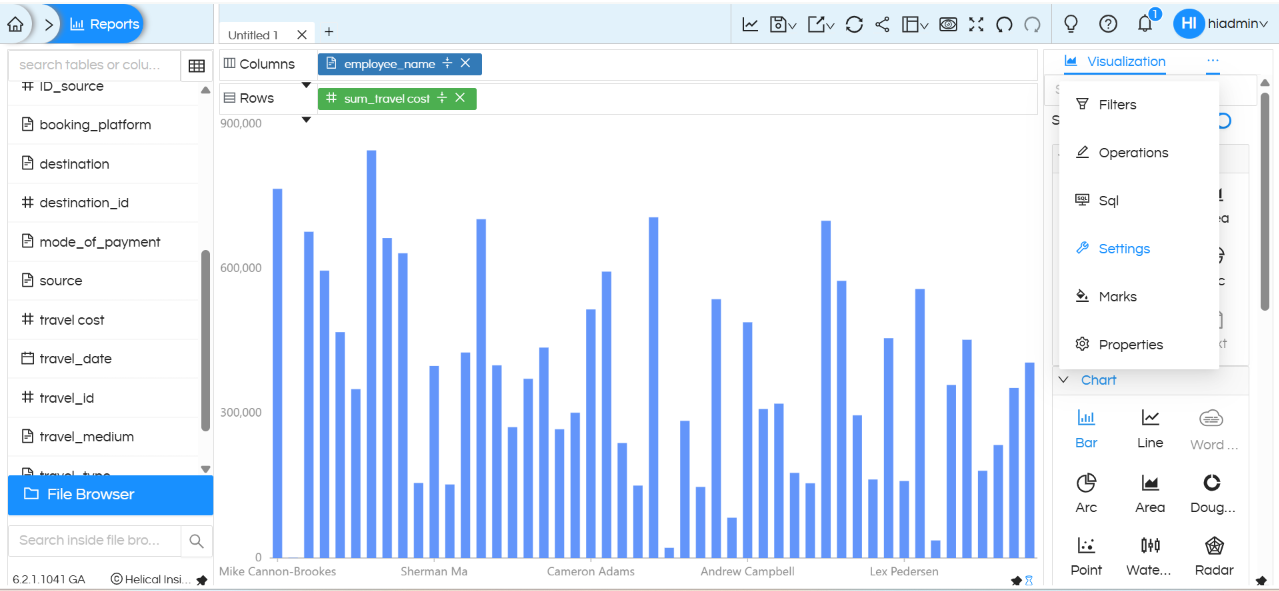
Screenshot showing the Settings option in the HReport menu.
Step 3: Set the required number of records
Once you click Settings, you will see the Sample option.
By default, the value of Sample is set to 1000.
This means that, by default, Helical Insight applies a limit of 1,000 records and displays up to a maximum of 1,000 records in the HReport.
You can change this value according to your requirement.
For example:
- For Top 5 / Bottom 5, set Sample to 5.
- For Top 10 / Bottom 10, set Sample to 10.
- For Top 15 / Bottom 15, set Sample to 15.
- For Top N / Bottom N, set Sample to the required value of N.
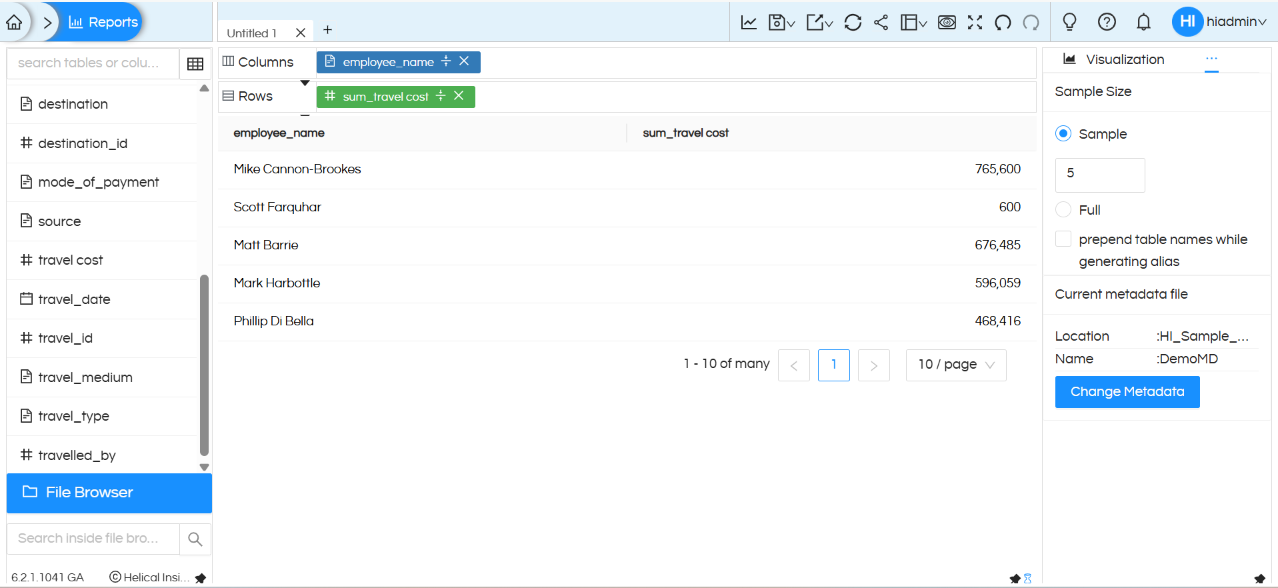
Screenshot showing the Sample setting and the required record limit.
Step 4: Apply sorting
After setting the required record limit, apply sorting on the field that should determine the Top N or Bottom N result.
For example, if you want to identify the employees with the highest travel costs, you would apply sorting on the travel cost field.
For information about how to apply sorting in Helical Insight 5.0 onwards, refer to:
Sorting in Reports with Helical Insight 5.0
https://www.helicalinsight.com/sorting-in-reports-with-helical-insight-5-0/
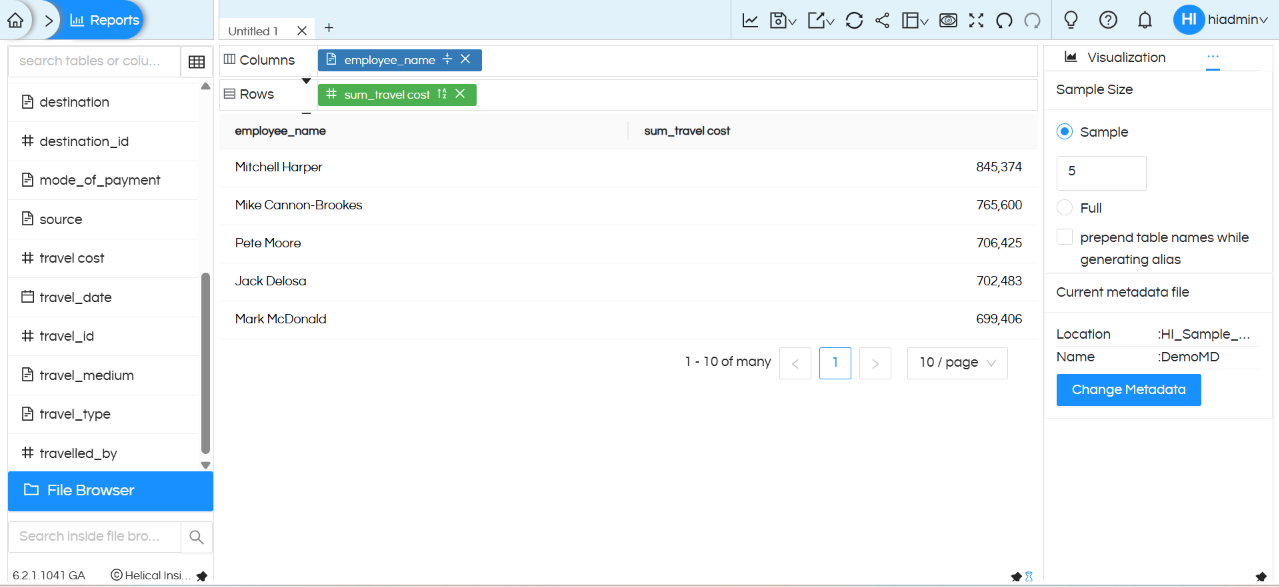
Screenshot showing sorting applied to the required field.
Creating a Top 5 / Top N Report
To create a Top 5 report:
- Set the Sample value to 5.
- Apply descending sorting on the relevant field.
The records with the highest values will then be displayed within the selected record limit.
Similarly, to create a Top N report:
- Set the Sample value to the required value of N.
- Apply descending sorting on the relevant field.
For example, if Sample is set to 5 and the selected field is sorted in descending order, the first five records will represent the Top 5 records based on that field.
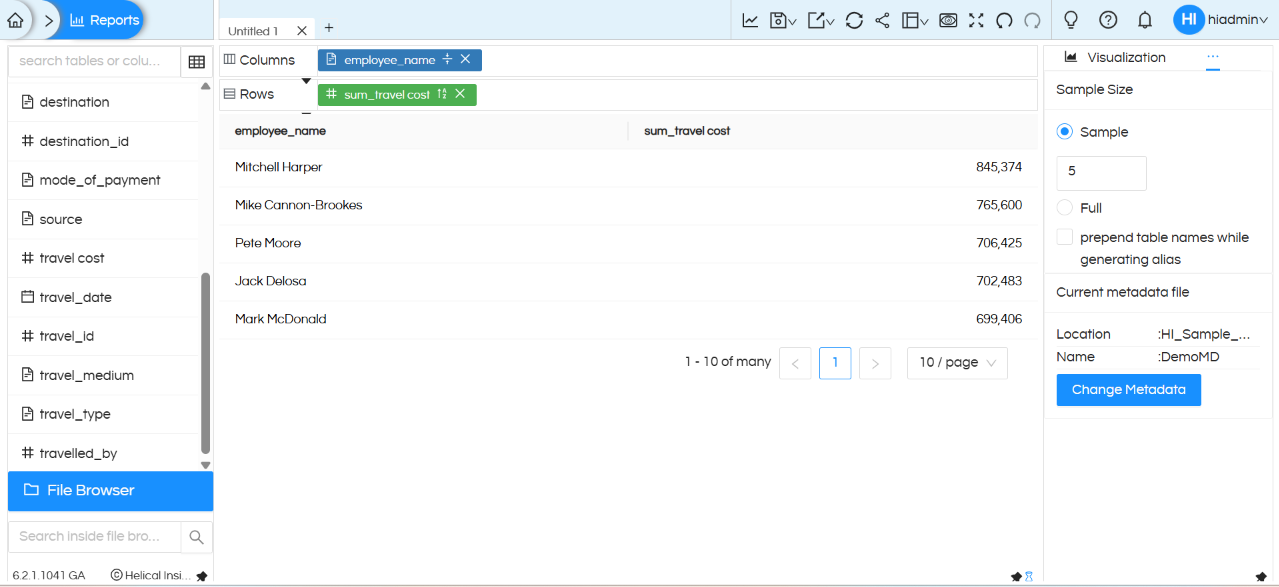
Screenshot showing a Top 5 / Top N report.
Creating a Bottom 5 / Bottom N Report
To create a Bottom 5 report:
- Set the Sample value to 5.
- Apply ascending sorting on the relevant field.
The records with the lowest values will then be displayed within the selected record limit.
Similarly, to create a Bottom N report:
- Set the Sample value to the required value of N.
- Apply ascending sorting on the relevant field.
For example, if Sample is set to 5 and the selected field is sorted in ascending order, the first five records will represent the Bottom 5 records based on that field.
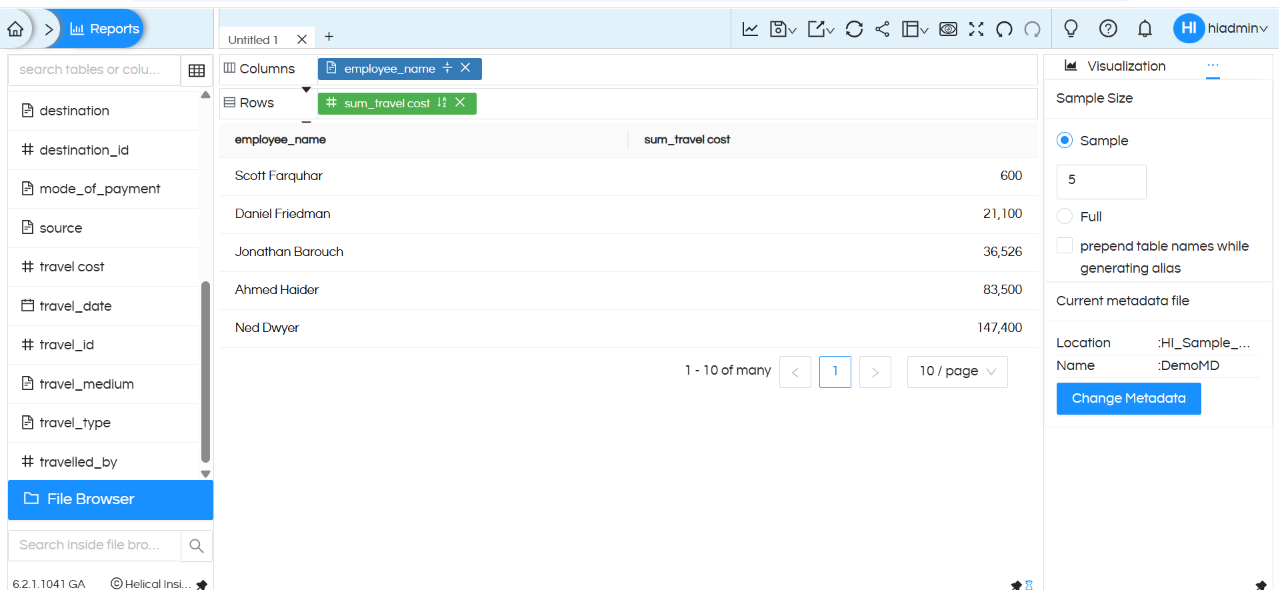
Screenshot showing a Bottom 5 / Bottom N report.
Top N and Bottom N – Quick Reference
Independent of Visualization
The approach described above is independent of the visualization used in the HReport.
The combination of record limiting and sorting can be used to create Top N and Bottom N analysis across the applicable visualizations available in HReport.
This means you can use the same approach regardless of which visualization you choose to display the data.
Conclusion
Creating Top N and Bottom N reports in Helical Insight HReport is straightforward.
By combining the Sample setting with sorting, you can limit the report to the required number of records and display either the highest-performing or lowest-performing records.
For Top 5 / Top N reports, use the required Sample value together with descending sorting.
For Bottom 5 / Bottom N reports, use the required Sample value together with ascending sorting.
Using these two simple settings, you can easily create Top N and Bottom N analysis in Helical Insight HReport.
In case of any other questions, please reach out on support@helicalinsight.com or raise ask your questions on forum.helicalinsight.com
