This blog will show how to create a dashboard group and what all editing features can be applied to the dashboard group.

A group is a collection of objects on a dashboards like reports, charts, tables, even image components or text components etc. We can have individual set of reports grouped together and placed at specific position on dashboard, group can have its own heading, and customizations too.

Groups allows better organization of dashboards. The most common use case is to group reports of same team under the same “group”. For example, all dashboards related to marketing could be grouped together under a dashboard group “Marketing”.

A single dashboard can be in multiple groups. A group can also have another group inside it.

Grouping up Reports

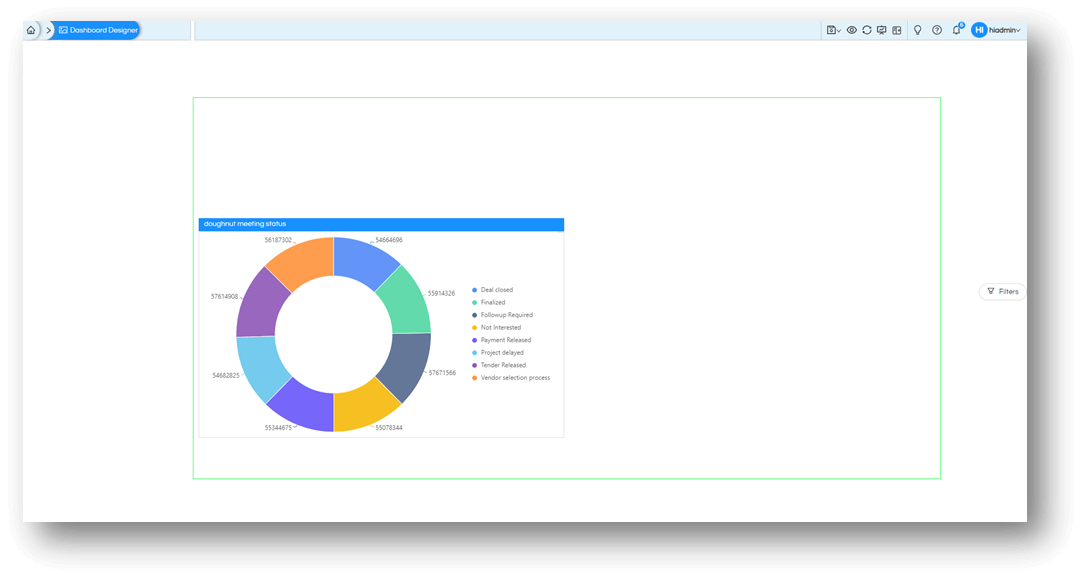
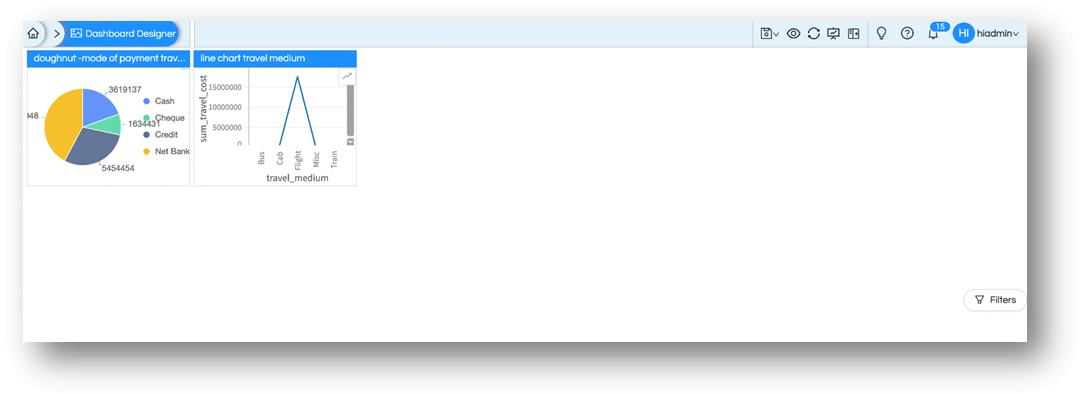
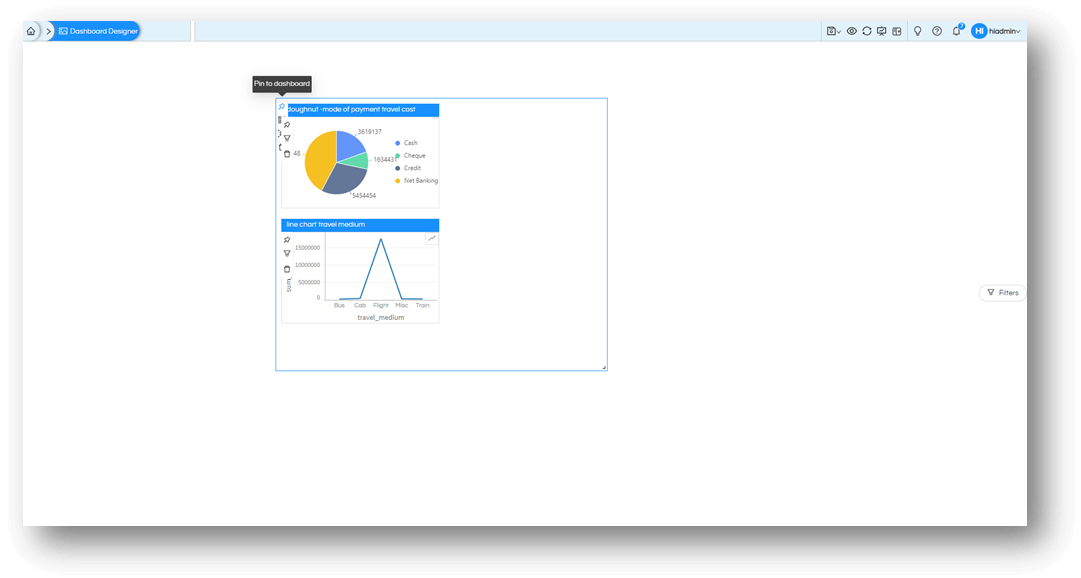
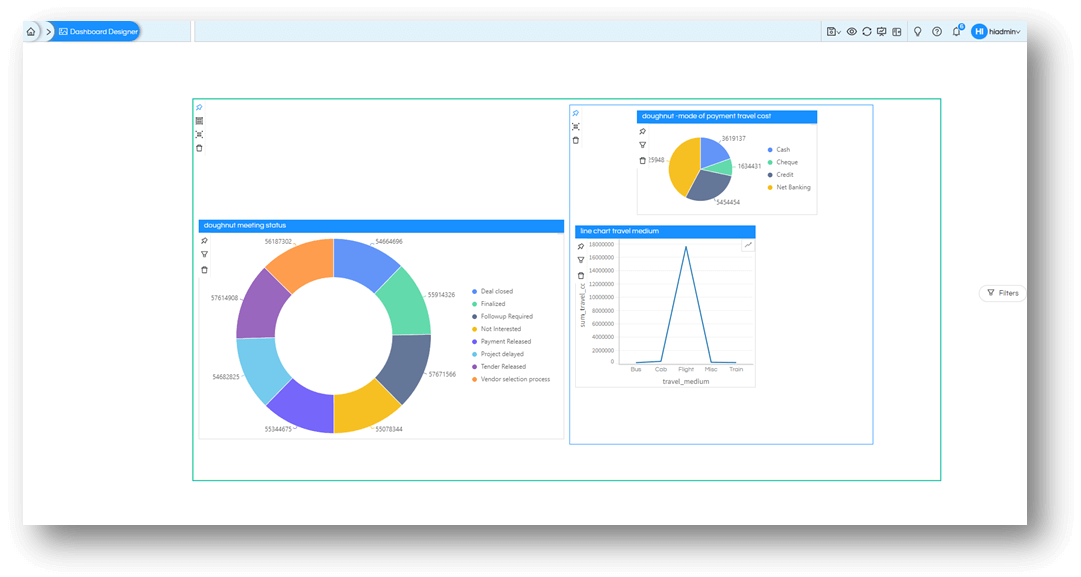
To create a group on the dashboard, first step is to identify which reports are to be grouped in one group. For example, I am selecting these 2 reports as shown below.

Making Report groups in Helical Insight 5.0

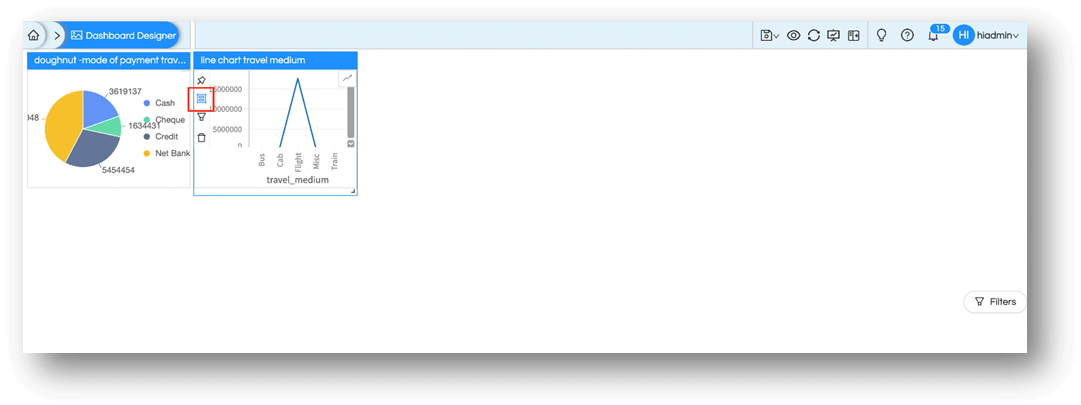
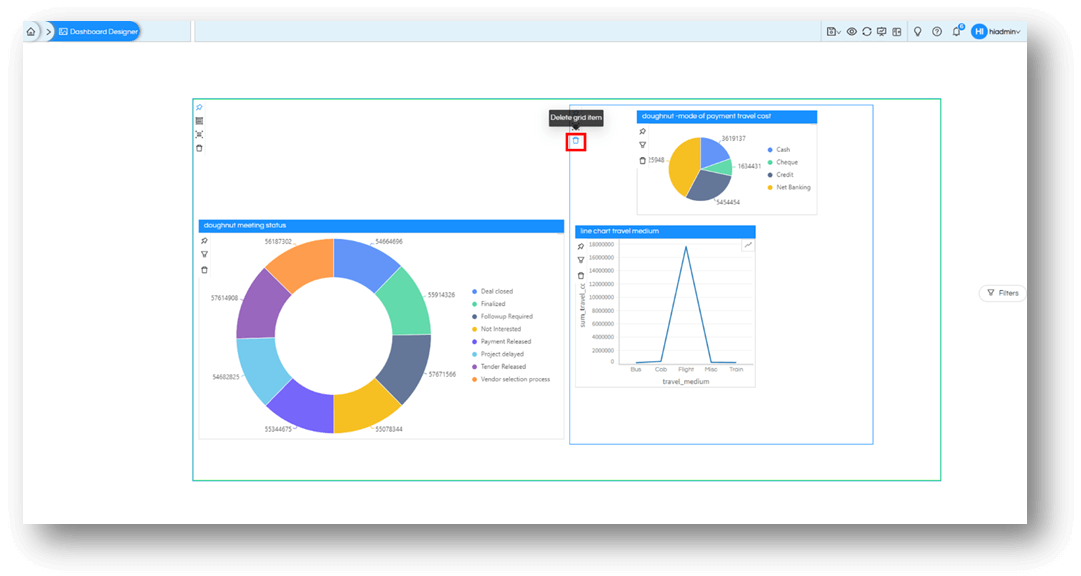
Then hover over that report and you will see several icons to its left.Select the icon (highlighted in red color) on the reports to be grouped. This will tag the reports for grouping.

Making Report groups in Helical Insight 5.0

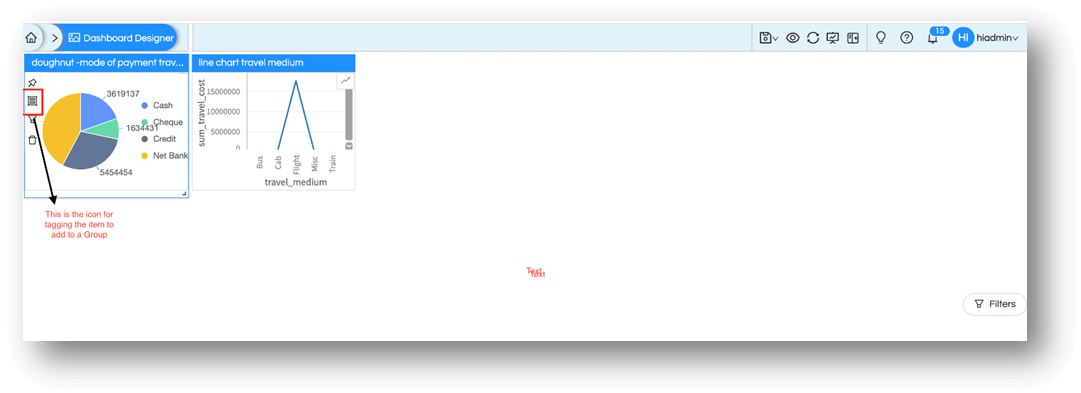
To verify that the item is tagged, make sure that the icon is blue in color once tagged.

Making Report groups in Helical Insight 5.0

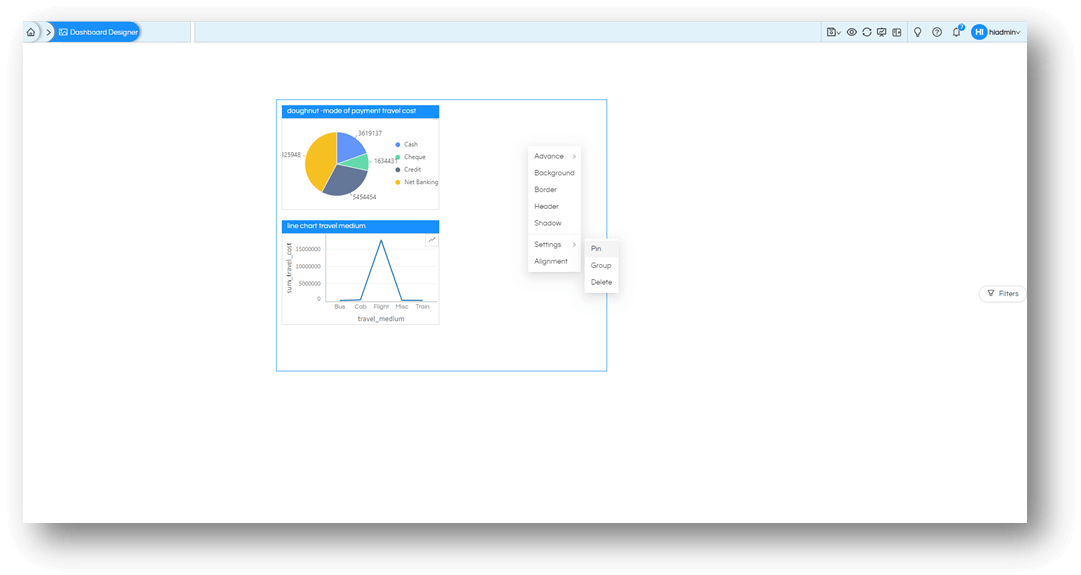
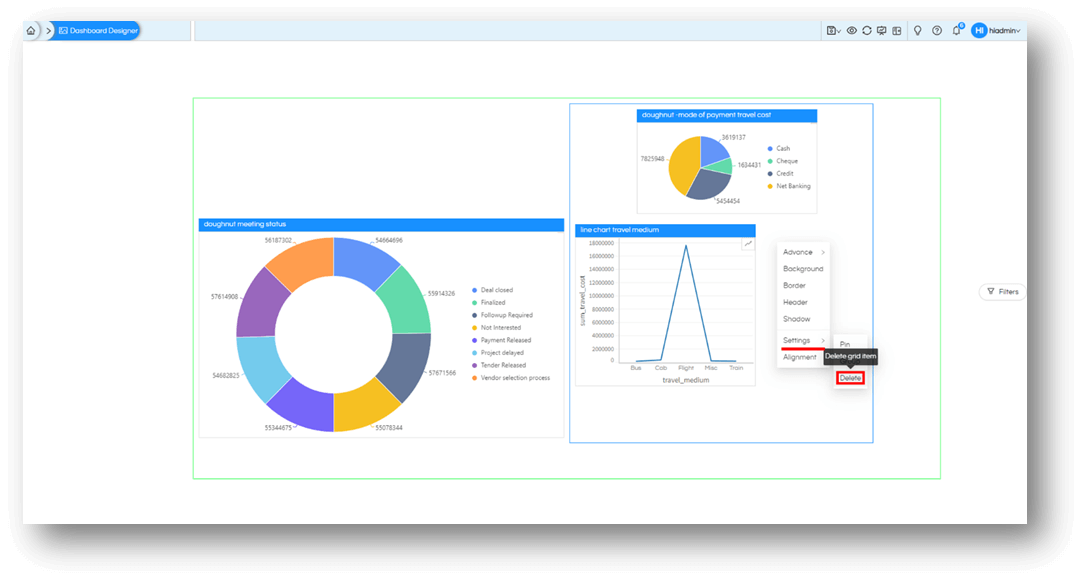
Alternatively, you can also select Group from right click context menu under settings mark an object for selection

Making Report groups in Helical Insight 5.0

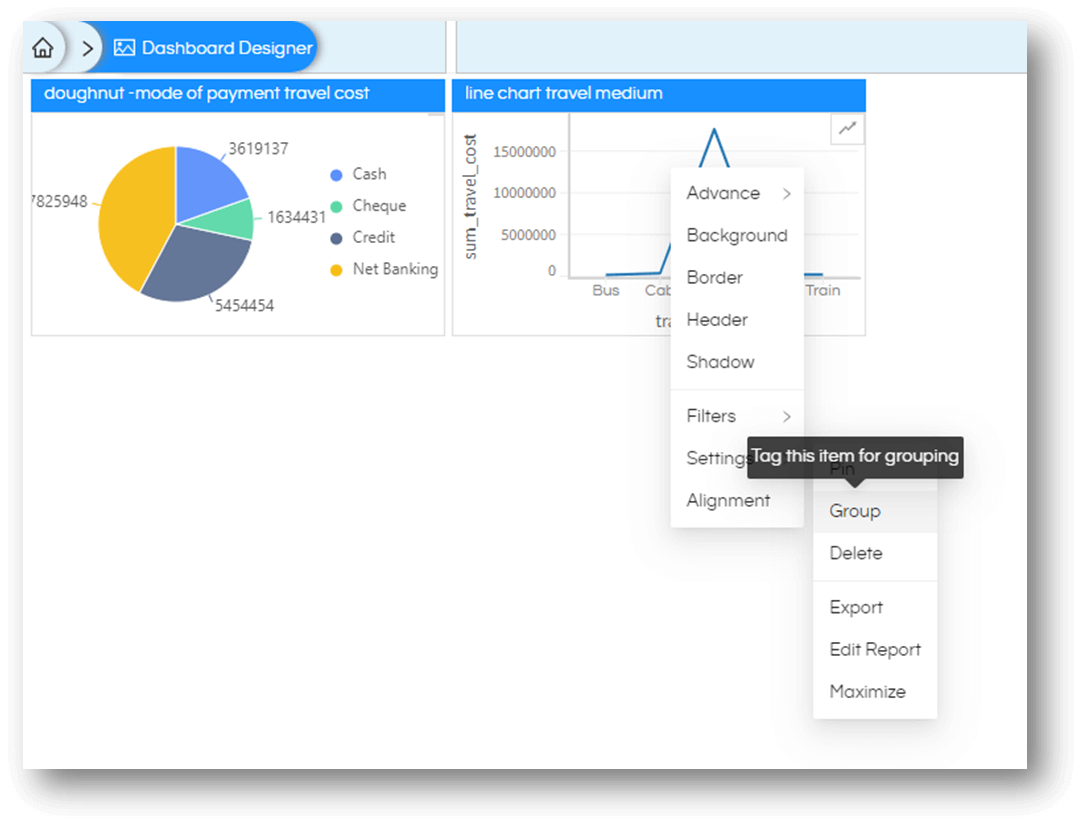
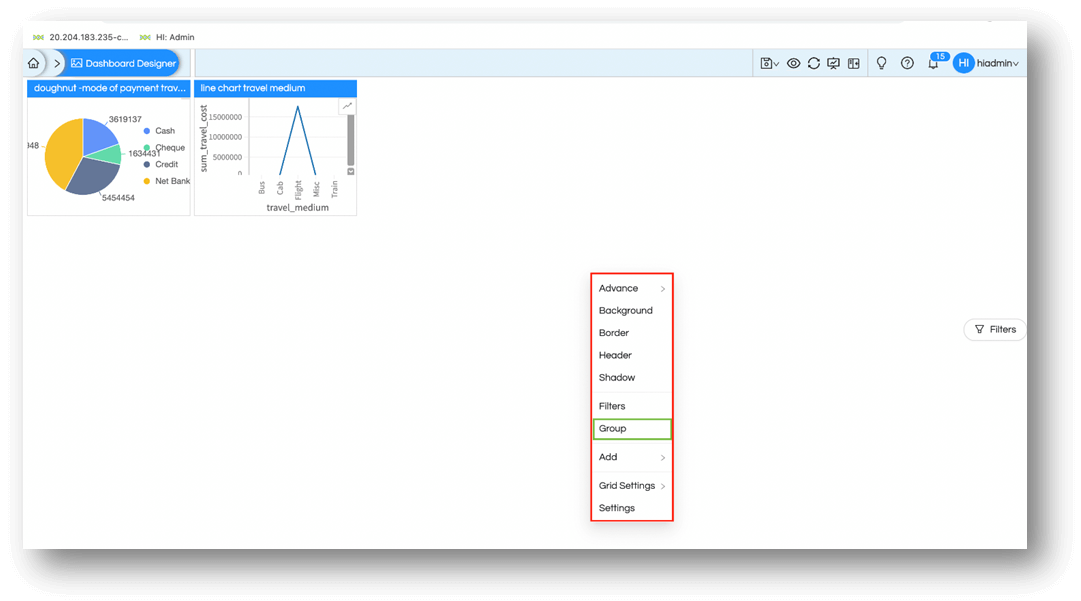
Once all objects on dashboard are marked for grouping, right-click on the empty space of dashboard canvas and from the dropdown menu select Group.

Making Report groups in Helical Insight 5.0

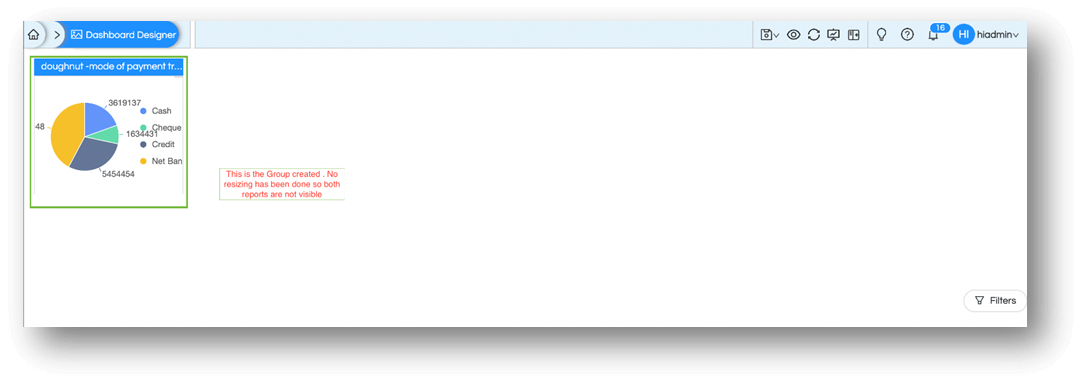
Once this action has been performed you will see a that a single element, containing the tagged items, appears on dashboard canvas.

Making Report groups in Helical Insight 5.0

Aligning the groups

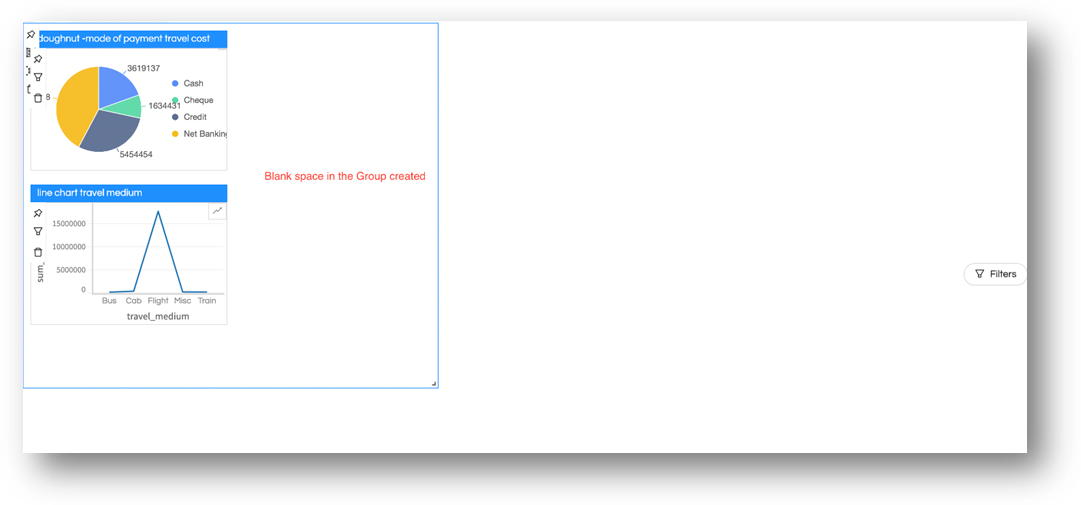
When you hover over the Group created, just like reports it will be highlighted with a blue border. (The border only appears till you are hovering over it for easy understanding, there is no default border or any other settings yet applied.)

Making Report groups in Helical Insight 5.0

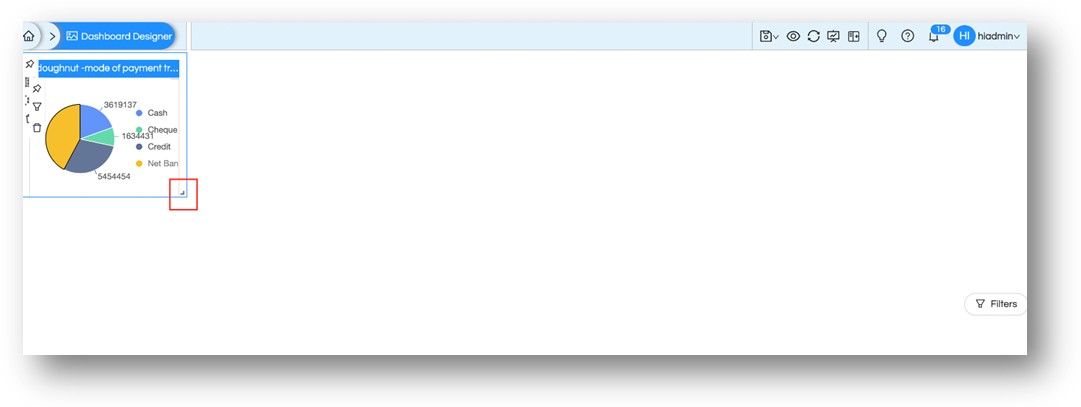
You can resize and reposition the group now by dragging and dropping just like any other report.

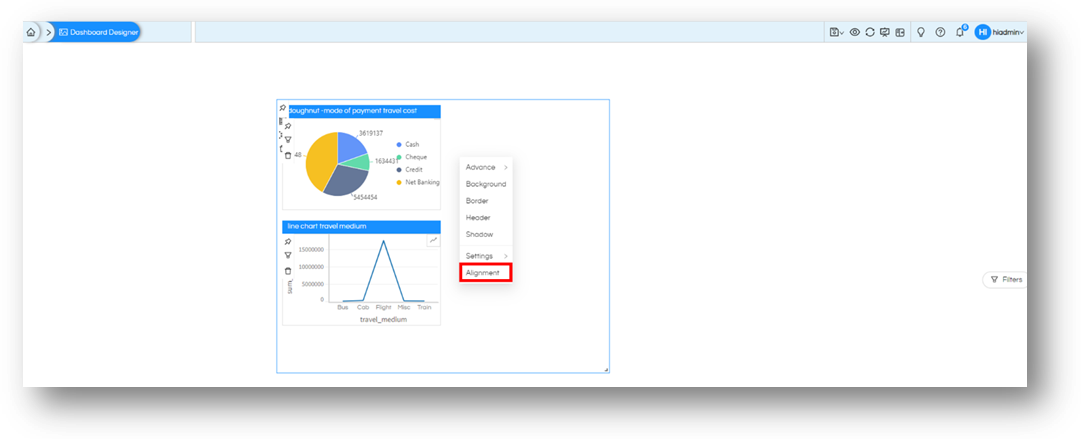
You can also do the same by using Alignment option from right-click context menu of the group.To change it from the alignment pane, right click on the empty space withinthe group and select Alignment from the context menu.

Making Report groups in Helical Insight 5.0

In the image above although the reports appear to be separate but if you hover on or near them, you will be able to see the common blue dynamic boundary to them and the blank space as well.

Making Report groups in Helical Insight 5.0

Applying Properties to Group (Background, Border, Header, Shadow)

This grouped item behaves is now another dashboard object (just like other reports or charts) and open to many editing optionslike background,border, header, shadow.

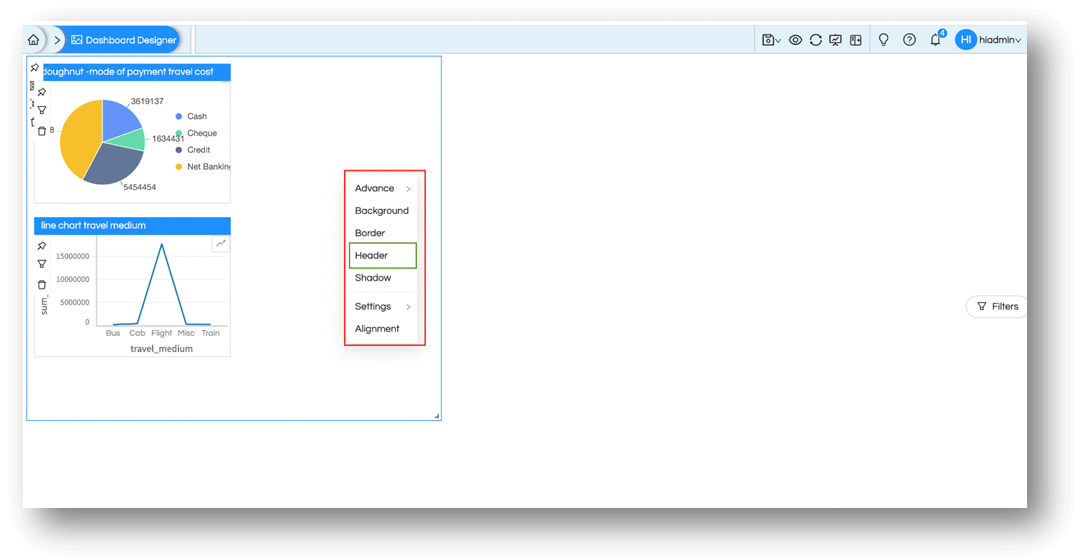
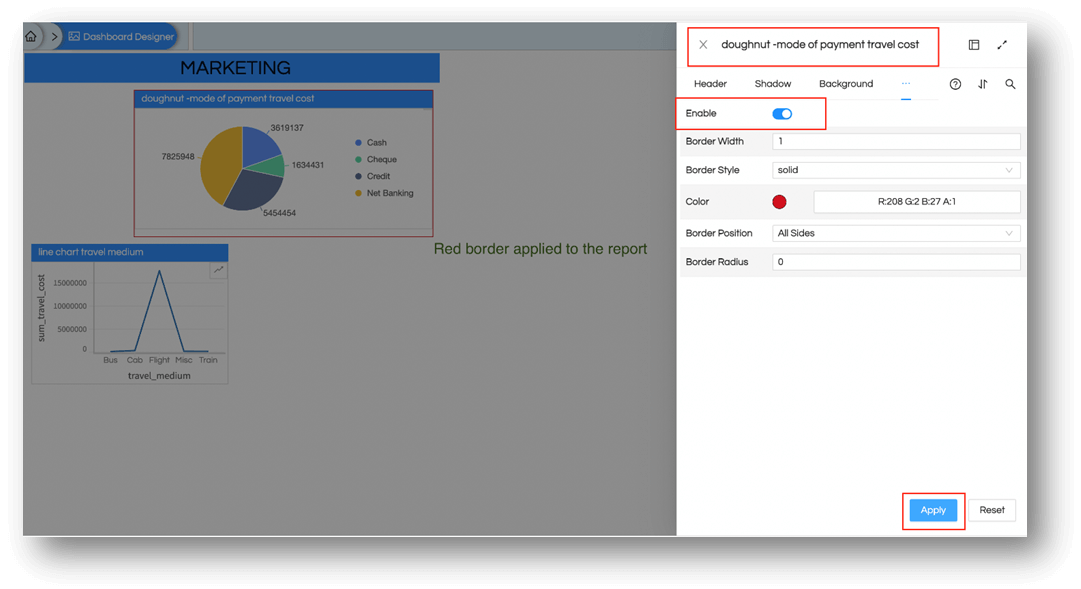
For example, if I want add header to this Grouped item, then right-click in the empty space in the grouped element. From the context menu, Select Header.

Making Report groups in Helical Insight 5.0

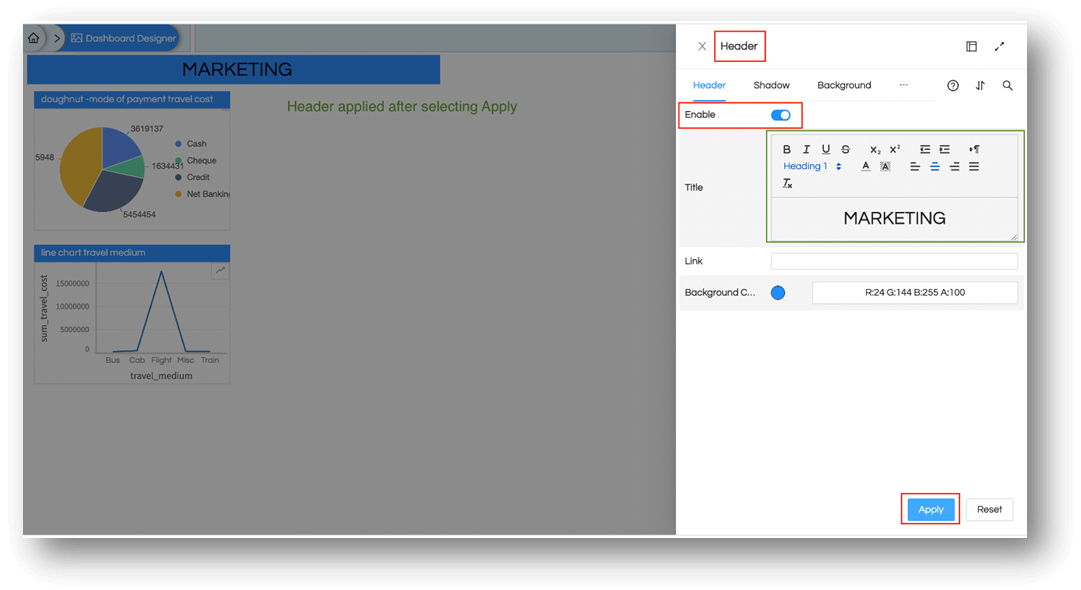
Just like any other report on dashboard a header panel will open up. Enable the header. In Title editor enter the text for header, for example, ‘Marketing’. Format the header as needed and then select Apply.

Making Report groups in Helical Insight 5.0

In a similar way, we can edit other properties like adding border or change the background or applying a shadow to the group.

Aligning individual reports within a Group

If you want to reposition or realign individual reports inside the group. You may do so by Alignment pane of individual object.

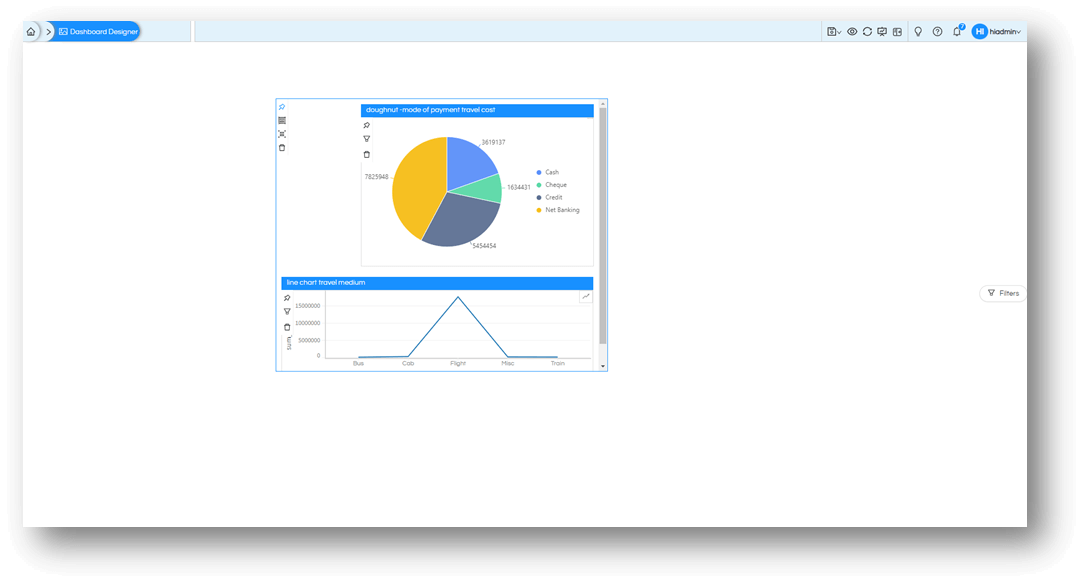
If you want to use drag/drop option. First ensure to pin the group itself by selecting the pin icon at the top left of the group. (Please note that each object and group both have their own options and icons, if they are overlapping be careful while choosing it). You may also pin it by right clicking on the group and selecting Pin from Settings. Both options are shown in images below.

Making Report groups in Helical Insight 5.0

Making Report groups in Helical Insight 5.0

Once pinned, we will not be able to resize or reposition the group by dragging.However, you can still go to alignment pane and make the changes.

As the group is pinned to its place then you can drag individual objects inside to reposition or resize it. The image below shows the above report repositioned and resized by dragging it. If overall any report is going beyond the group limits, a scrollbar will be added automatically to keep all reports accessible within the confined area of the group.

Making Report groups in Helical Insight 5.0

Editing individual reports inside a Group

You can edit individual reports or the group area as per your needs by right clicking and apply background, border, headers, shadow etc. as per your needs.

Making Report groups in Helical Insight 5.0

Ungrouping the Grouped reports

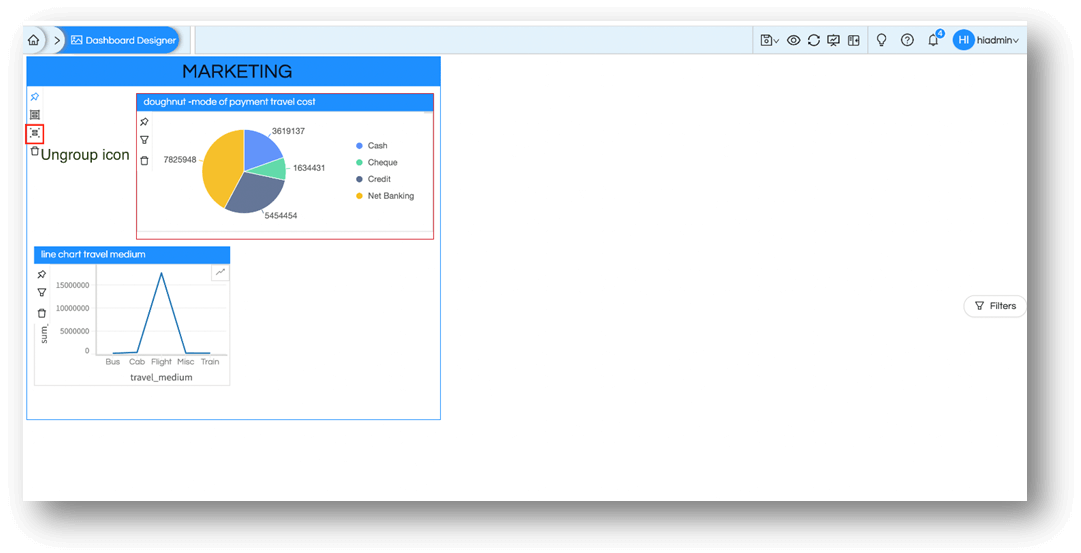
To ungroup the items from the group, select the icon highlighted in the image below. This will simply remove the reports from group, delete the group and its properties, but will retain any changes done to the report even after grouping.

Making Report groups in Helical Insight 5.0

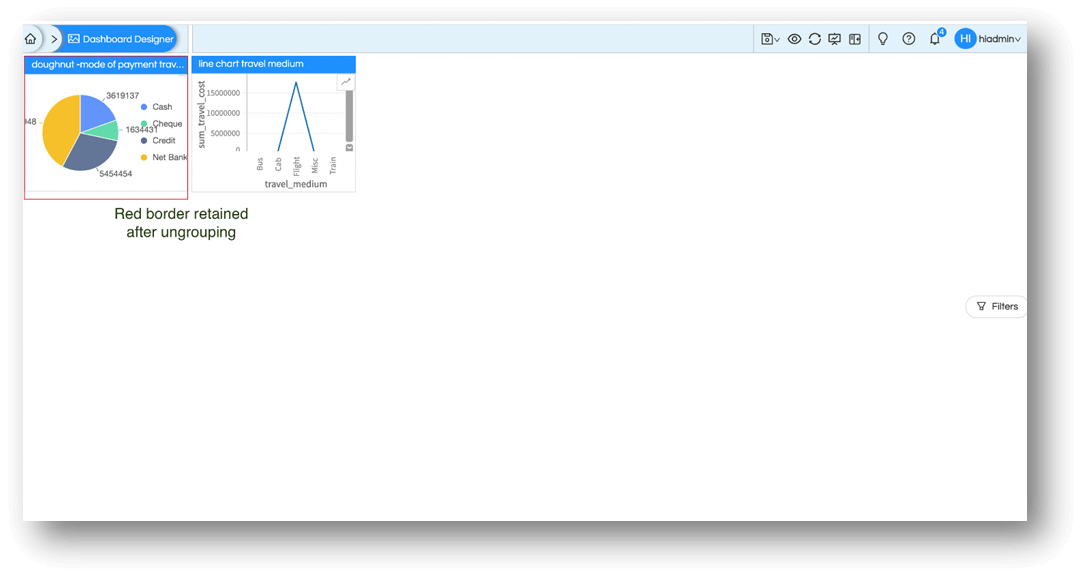
For example, the red border in the image below has been retained by the report.

Making Report groups in Helical Insight 5.0

Grouping a Group

If you want to add one more report to the group, it is suggested that you Ungroup them and then select all reports and Group them up again. However, there are needs when a group itself needs to be part of a larger group then you can mark group along with another report or group to apply another level of grouping.

For example, the below image shows a group of two report, along with a independent third report.

Making Report groups in Helical Insight 5.0

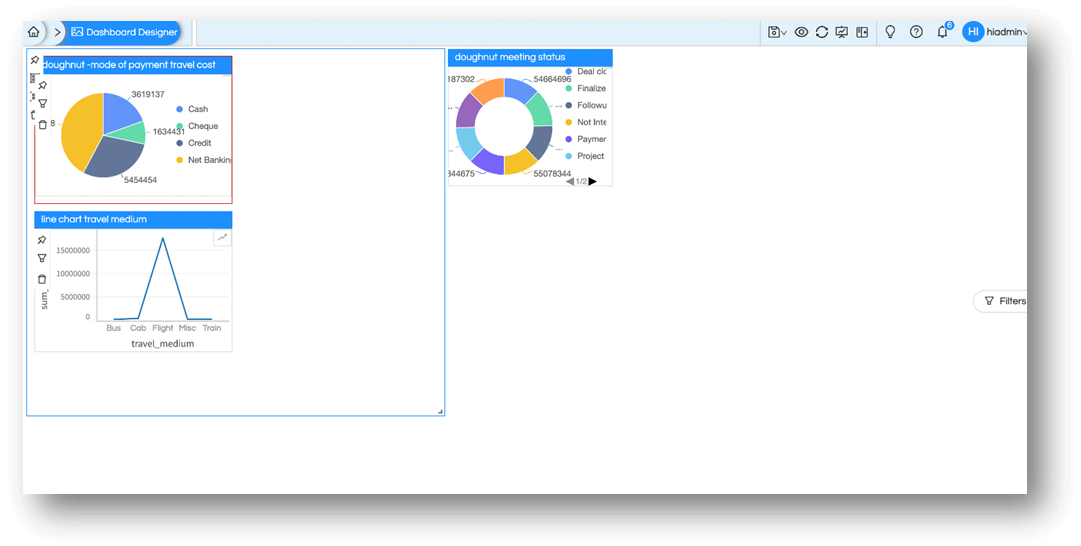
The group and the third report needs to be grouped up in a new group. If so if we tag them for groupingjust like the process explained before and a new group will be created with components.

Making Report groups in Helical Insight 5.0

In the image shown below, a new group has been created. We have organized all the components in the group for better understanding.

Making Report groups in Helical Insight 5.0

Deleting the Group

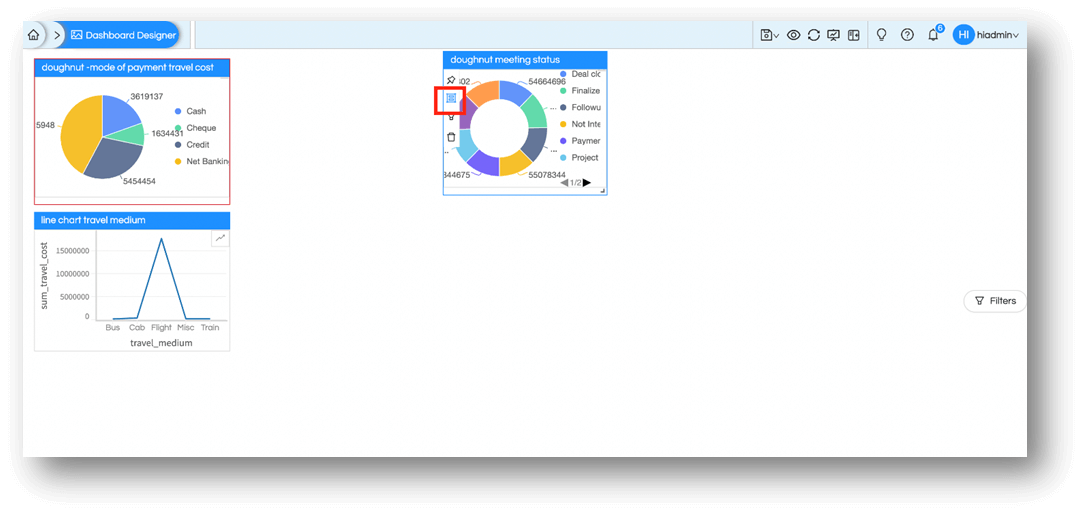
If we select Delete icon or from right-click context menu within Settings, then it deletes the group as well the components contained within it. This is the easy way to remove everything in it. However, if you are not looking to delete everything inside, Ungroup is the correct option to choose as explained above.

Both ways to delete a group is show in image below

Making Report groups in Helical Insight 5.0

Making Report groups in Helical Insight 5.0

In both ways the inner group containing two reports will be deleted completely with all its components and settings.

Making Report groups in Helical Insight 5.0

Helical Insight’s self-service capabilities is one to reckon with. It allows you to simply drag and drop columns, add filters, apply aggregate functions if required, and create reports and dashboards on the fly. For advanced users, the self-service component has ability to add javascript, HTML, HTML5, CSS, CSS3 and AJAX. These customizations allow you to create dynamic reports and dashboards. You can also add new charts inside the self-service component, add new kind of aggregate functions and customize it using our APIs.
Helical Insight, via simple browser based interface of Canned Reporting module, also allows to create pixel perfect printer friendly document kind of reports also like Invoice, P&L Statement, Balance sheet etc.
If you have a product, built on any platform like Dot Net or Java or PHP or Ruby, you can easily embed Helical Insight within it using iFrames or webservices, for quick value add through instant visualization of data.
Being a 100% browser-based BI tool, you can connect with your database and analyse across any location and device. There is no need to download or install heavy memory-consuming developer tools – All you need is a Browser application! We are battle-tested on most of the commonly used browsers.
We have organization level security where the Superadmin can create, delete and modify roles. Dashboards and reports can be added to that organization. This ensures multitenancy.
A first-of-its-kind Open-Source BI framework, Helical Insight is completely API-driven. This allows you to add functionalities, including but not limited to adding a new exporting type, new datasource type, core functionality expansion, new charting in adhoc etc., at any place whenever you wish, using your own in-house developers.
It handles huge volumes of data effectively. Caching, Pagination, Load-Balancing and In-Memory not only provides you with amazing experience, but also and does not burden the database server more than required. Further effective use of computing power gives best performance and complex calculations even on the big data even with smaller machines for your personal use. Filtering, Sorting, Cube Analysis, Inter Panel Communication on the dashboards all at lightning speed. Thereby, making best open-source Business Intelligence solution in the market.
With advance NLP algorithm, business users simply ask questions like, “show me sales of last quarter”, “average monthly sales of my products”. Let the application give the power to users without knowledge of query language or underlying data architecture
Our application is compatible with almost all databases, be it RDBMS, or columnar database, or even flat files like spreadsheets or csv files. You can even connect to your own custom database via JDBC connection. Further, our database connection can be switched dynamically based on logged in users or its organization or other parameters. So, all your clients can use the same reports and dashboards without worrying about any data security breech.
Our application can be installed on an in-house server where you have full control of your data and its security. Or on cloud where it is accessible to larger audience without overheads and maintenance of the servers. One solution that works for all.
Different companies have different business processes that the existing BI tools do not encompass. Helical Insight permits you to design your own workflows and specify what functional module of BI gets triggered