Although we can add header to a report at Dashboard level, a title can be given to a report at the report level also. This can be helpful when you are sharing a single report or embedding it in your own application directly, without putting on dashboard.

1.      Adding Title to a report

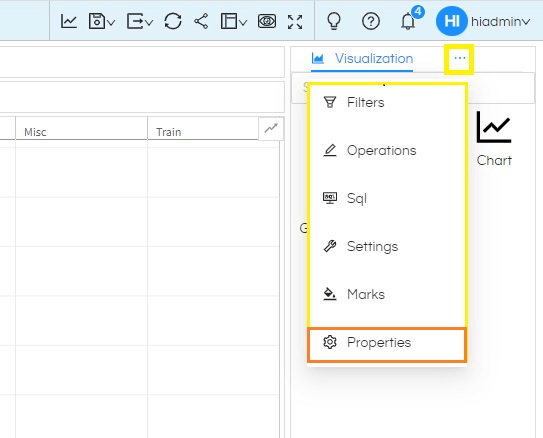
Select the meatball icon on top right (highlighted in yellow) as shown in image. List of additional menu options will appear. Select ‘Properties‘ from this list.

Selecting the type of bar charts in Helical Insight 5.0

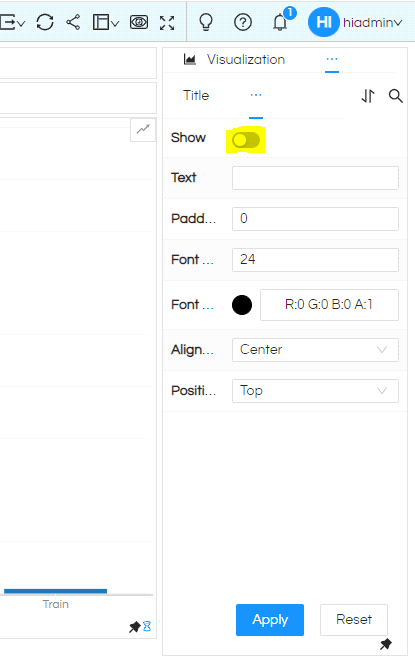
To add the Title, enable the highlighted Show button(if disabled).

Selecting the type of bar charts in Helical Insight 5.0

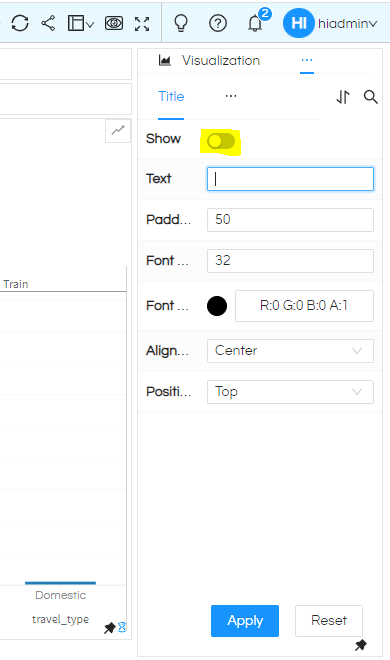
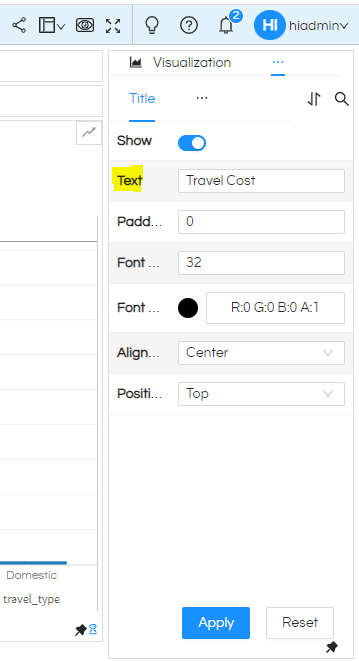
In the Text box, enter the Title name and Select Apply from the bottom. There are other options to customize Title below text box.

Selecting the type of bar charts in Helical Insight 5.0

Selecting the type of bar charts in Helical Insight 5.0

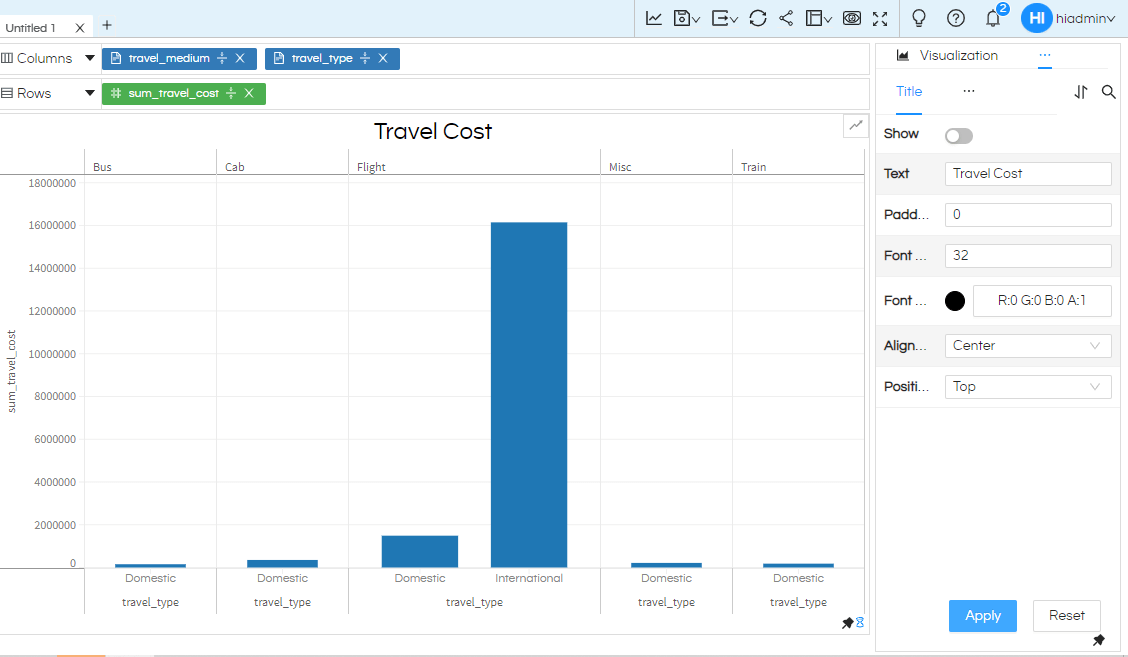
  • Padding, you can add space after the report title by increasing it value. I have added 10 as padding value.
  • FontSize will set the size of report title.
  • Font Color of the report title can also be changed.
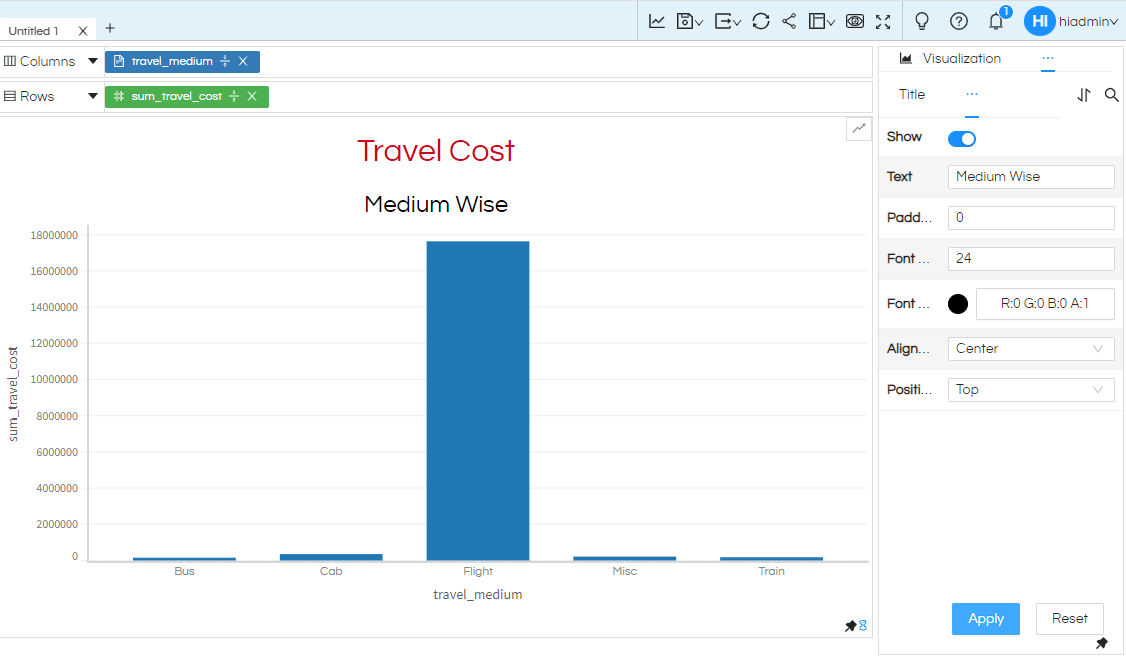
  • Alignment lets you align the report title to the left, center or right.In the image below, Travel Cost is aligned in the center.
  • Position allows us to place the report title at the top or at thebottom of the report.

Use the required option as per your need and click on Apply button. If you want to reset every field to default values, click on Reset button. Once the values are reset, you may need to click on Apply button to see the effect on the report

Selecting the type of bar charts in Helical Insight 5.0


2.      Adding Sub Title to a report

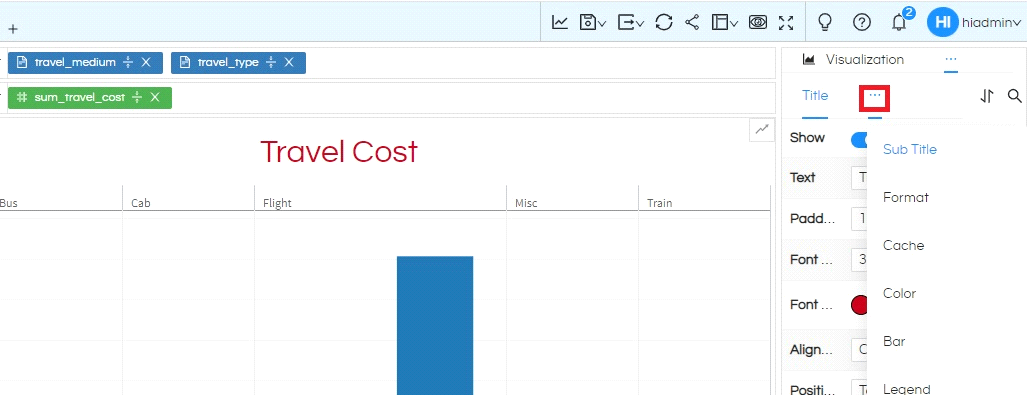
To add a subtitle, select this meatball icon within Properties and again a dropdown menu will appear. Select Sub Title from here.

Selecting the type of bar charts in Helical Insight 5.0

Again, enable the Show Button and enter the subtitle name in Text box.

Selecting the type of bar charts in Helical Insight 5.0

We can customize the subtitle text in the same way as we did for text for title. At the end select Apply to show subtitle at the report.

Selecting the type of bar charts in Helical Insight 5.0

Helical Insight’s self-service capabilities is one to reckon with. It allows you to simply drag and drop columns, add filters, apply aggregate functions if required, and create reports and dashboards on the fly. For advanced users, the self-service component has ability to add javascript, HTML, HTML5, CSS, CSS3 and AJAX. These customizations allow you to create dynamic reports and dashboards. You can also add new charts inside the self-service component, add new kind of aggregate functions and customize it using our APIs.
Helical Insight, via simple browser based interface of Canned Reporting module, also allows to create pixel perfect printer friendly document kind of reports also like Invoice, P&L Statement, Balance sheet etc.
If you have a product, built on any platform like Dot Net or Java or PHP or Ruby, you can easily embed Helical Insight within it using iFrames or webservices, for quick value add through instant visualization of data.
Being a 100% browser-based BI tool, you can connect with your database and analyse across any location and device. There is no need to download or install heavy memory-consuming developer tools – All you need is a Browser application! We are battle-tested on most of the commonly used browsers.
We have organization level security where the Superadmin can create, delete and modify roles. Dashboards and reports can be added to that organization. This ensures multitenancy.
A first-of-its-kind Open-Source BI framework, Helical Insight is completely API-driven. This allows you to add functionalities, including but not limited to adding a new exporting type, new datasource type, core functionality expansion, new charting in adhoc etc., at any place whenever you wish, using your own in-house developers.
It handles huge volumes of data effectively. Caching, Pagination, Load-Balancing and In-Memory not only provides you with amazing experience, but also and does not burden the database server more than required. Further effective use of computing power gives best performance and complex calculations even on the big data even with smaller machines for your personal use. Filtering, Sorting, Cube Analysis, Inter Panel Communication on the dashboards all at lightning speed. Thereby, making best open-source Business Intelligence solution in the market.
With advance NLP algorithm, business users simply ask questions like, “show me sales of last quarter”, “average monthly sales of my products”. Let the application give the power to users without knowledge of query language or underlying data architecture
Our application is compatible with almost all databases, be it RDBMS, or columnar database, or even flat files like spreadsheets or csv files. You can even connect to your own custom database via JDBC connection. Further, our database connection can be switched dynamically based on logged in users or its organization or other parameters. So, all your clients can use the same reports and dashboards without worrying about any data security breech.
Our application can be installed on an in-house server where you have full control of your data and its security. Or on cloud where it is accessible to larger audience without overheads and maintenance of the servers. One solution that works for all.
Different companies have different business processes that the existing BI tools do not encompass. Helical Insight permits you to design your own workflows and specify what functional module of BI gets triggered