In this blog, we are going to see how to use groups in Helical Canned Report as well as usage of Group_Count function.
A group is a set of field values in the result set. You can create different groups and then repeat components for each group.
You can create a group for a field by right clicking on the field and clicking on Create Group.
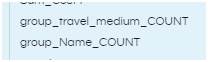
As soon as a group is created, a calculation named <group_name>_count is added in the Calculations/Parameters section visible on the right side. This calculation can be used on the report directly like any other calculation.
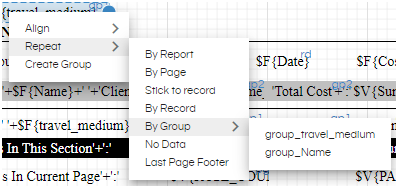
If at least one group is created, the “Repeat Options” on right click also contain “Repeat by Group” option. When a particular component is set to “Repeat by Group”, then the value is calculated and repeated for each value in the result set of the group.
If you want to use a field as a group, then in the query, there must be an order by clause for that field name.
Group Header: If a component is placed above the row of data fields and Repeat by Group is selected, it will act as Group Header.
Group Footer: If a component is placed below the row of data fields and Repeat by Group is selected, it will act as Group Footer.
EXAMPLE OF GROUP USAGE:
Let us say, we want to view the client wise details of travel cost and also for every client how many count of travels happened as a calculation before the next set of data starts for the next client. In this case, we are displaying ID, Source, Destination, Date and Cost. Hence, in our query section, we have taken all the necessary fields.
Order by clause in SQL Query: When we use Group by for any field, by default, grouping happens based on the SQL query that we have given. So in case, if the value on which we want to do the grouping appears at multiple places, it treats each occurrence as a separate group. This leads to multiple groups and multiple group counts for the same field value. We can avoid this directly in SQL by applying an ORDER BY clause on the same field that is used for grouping. Thus all the values for that field will appear together and grouping will happen only once.
For example if you are grouping by travel medium and if a normal SQL results into travel medium which is Bus at multiple places it will show multiple groups. Whereas when ordering is applied on Travel Medium column in the SQL, all the Bus related values will appear together, thus group_count group_sum etc values will also appear correctly.
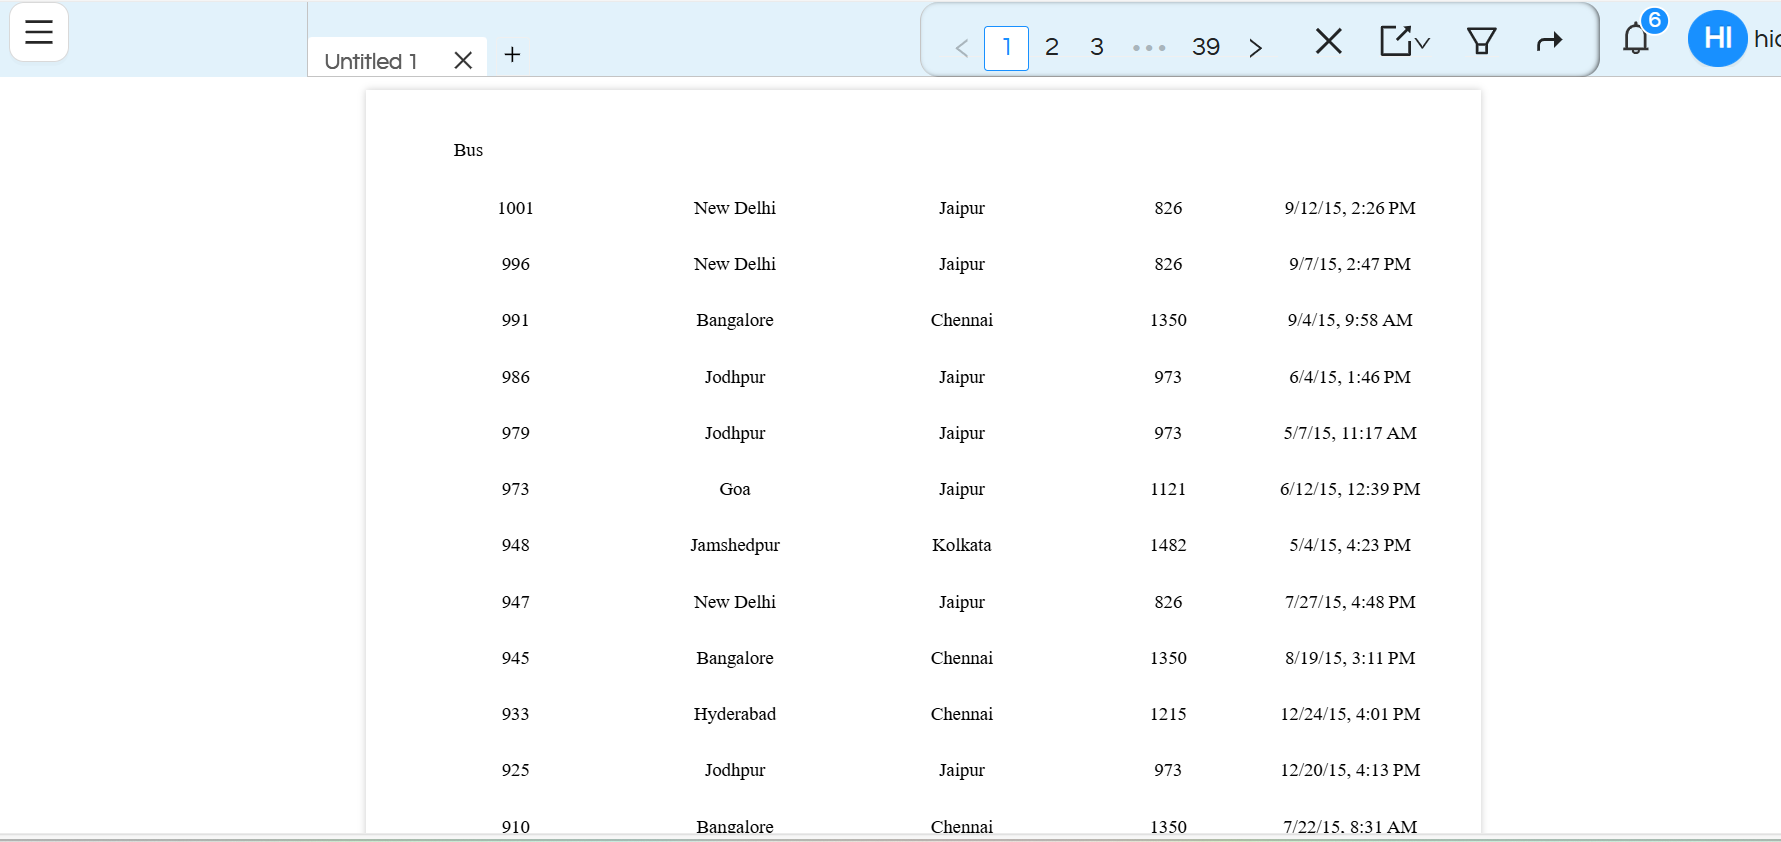
Below shown image is the example of how the data is shown without using ORDERBY clause in SQL.
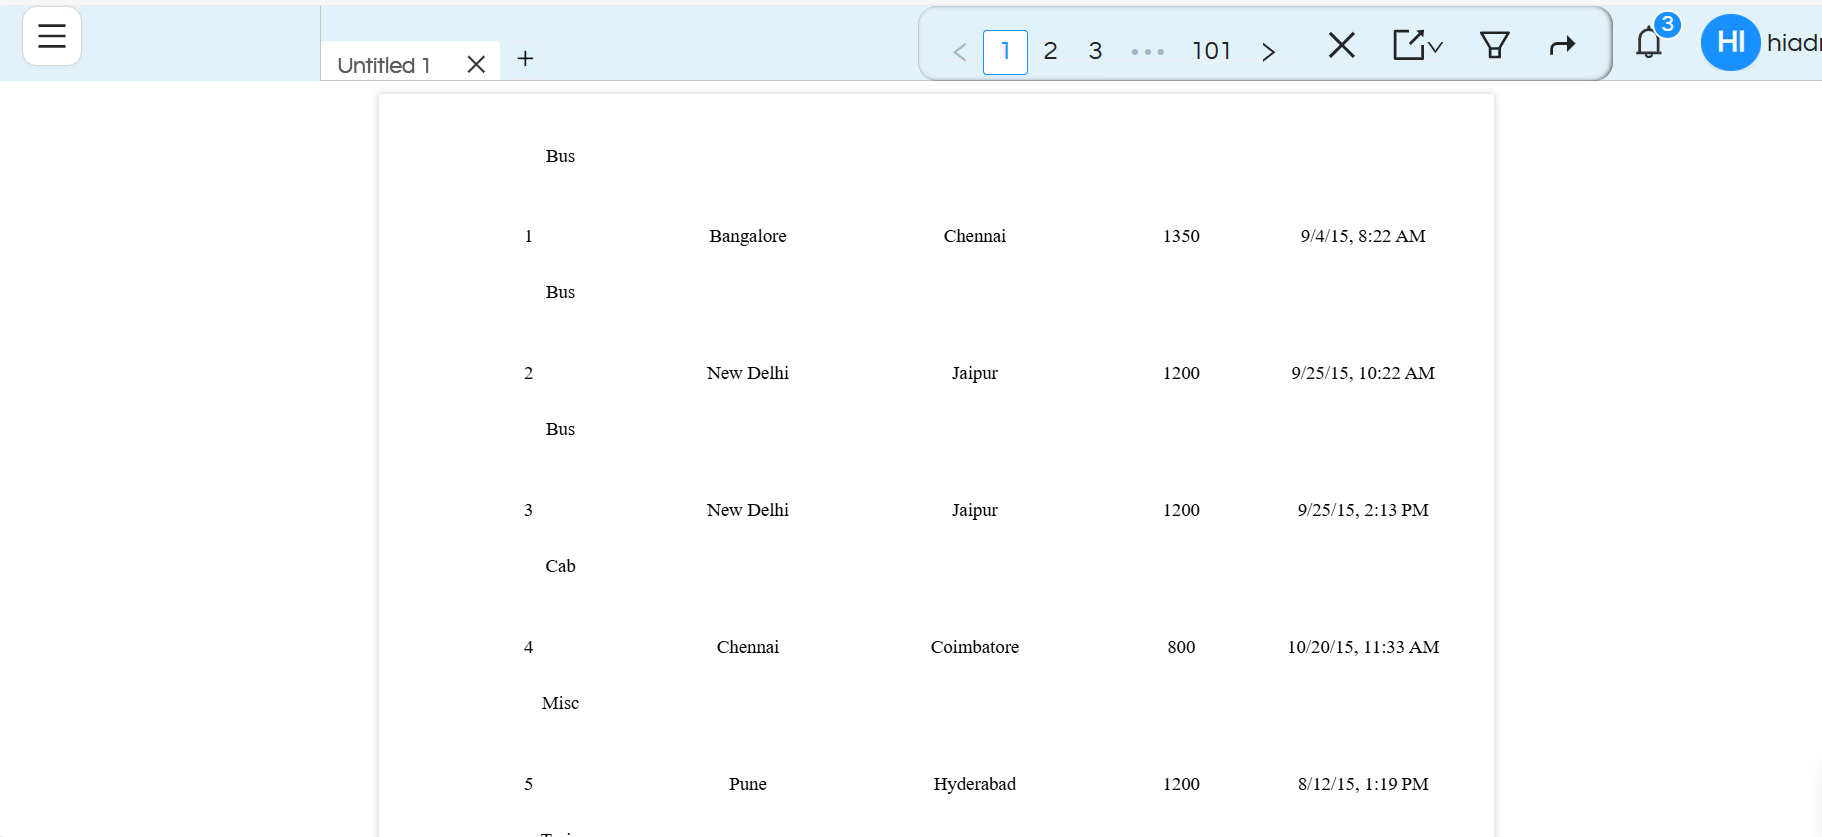
With ORDERBY clause in SQL query, data is shown as below.
Multiple Groups – In many cases, we may want to create multi level group reports. In those cases, our SQL should have multiple fields in the ORDERBY clause in the correct sequence.
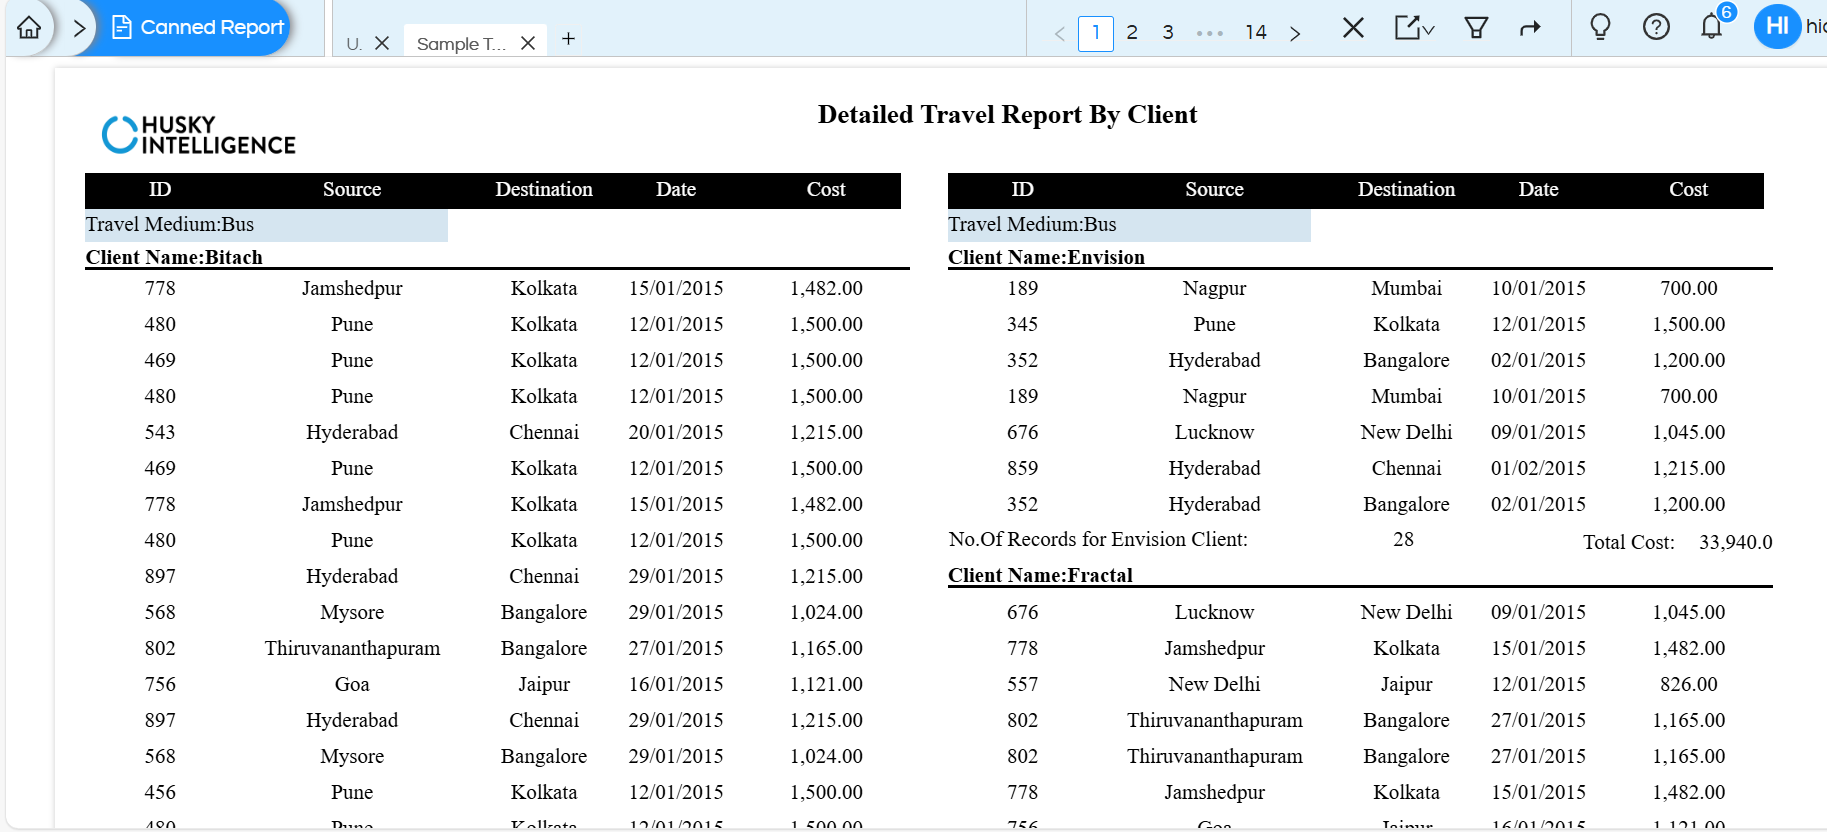
In the image shown above, the report is grouped by two groups.
Group 1 – Travel Medium and Group 2 – Client name.
In this case, the SQL query would specify ORDERBY for both the fields and would be this
order by "travel_medium","Name"
To create canned report we are using the below SQL in this blog
select
	"HIUSER"."travel_details"."travel_id" as "ID",
 	"HIUSER"."meeting_details"."client_name" as "Name",
 	"HIUSER"."travel_details"."destination" as "Destination",
 	"HIUSER"."travel_details"."source" as "Source",
 	"HIUSER"."travel_details"."travel_cost" as "Cost",
 	"HIUSER"."travel_details"."travel_date" as "Date",
 	"HIUSER"."travel_details"."travel_medium" as "travel_medium"

from
	"HIUSER"."travel_details"
	inner join "HIUSER"."employee_details" on ("HIUSER"."employee_details"."employee_id" = "HIUSER"."travel_details"."travelled_by")
	inner join "HIUSER"."meeting_details" on ("HIUSER"."employee_details"."employee_id" = "HIUSER"."meeting_details"."meeting_by")

	order by "travel_medium","Name"
Consider the following picture:
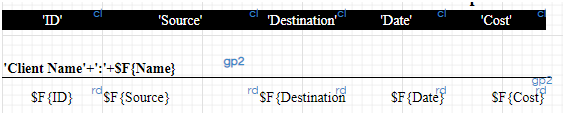
Now, we have dragged the respective fields on the canvas so that we can see these fields. We have also given heading to the fields by adding text components and aligning it with “repeat by – page”.
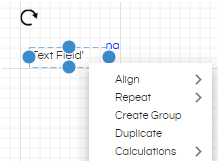
Since we want to see the details for each client wise, we will drag the client_name i.e. $F{Name} field on the canvas. We will right click on this and select Create Group.
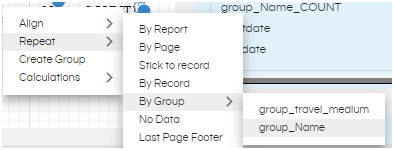
We want to view the number of records for each client also. As soon as we create the group, count of this group is added to the calculations section of datasource panel. In this specific case the function which got added its name is “group_Name_COUNT”. We can directly drag this calculation on the canvas and place it below the fields already added.

Right click on this above dragged field and select Repeat by Group –name. In this case we will select “Repeat – By Group – Group_Name”
The output will be as shown below. This is for one client. The same type of output will be repeated for the other clients as well.
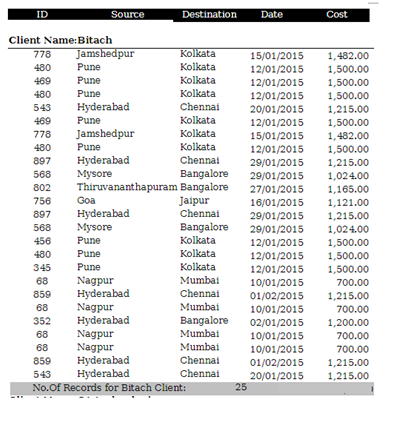
Similarly, you can also add other custom calculations like sum, average, max, min etc. and add them to the canvas and repeat by a group. You can refer to this blog to know how to add calculations.
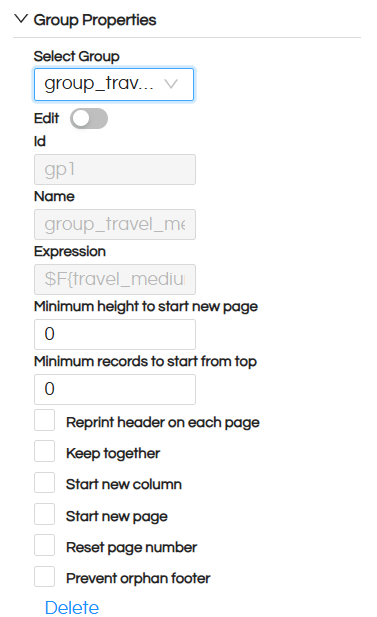
Group Properties can be set by clicking on the canvas and going to the properties pane. For this, click on the canvas. At the bottom right, you will see Group Properties option.
The following options are available:
- Select Group – Select the group that you are setting the property for.
- Minimum height to start new page – Minimum height after which the data should appear on a new page.
- Minimum records to start from top – Define the number of records to be rendered on the current column, so as to avoid starting the group on a new column
- Reprint header on each page – checkbox, if selected, on every page, the header of the group will be visible.
- Keep together – select to keep all the records of a group together
- Start new column – select to start a new group in new column
- Start new page – select to start a new group on a new page
- Reset page number – select to reset the page number after each group
- Prevent orphan footer – select to prevent only group footer to be printed on the next page if it does not fit in the current page.
version 6.0 onwards the new UI is like shown below
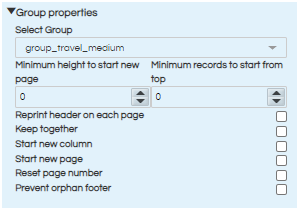
for version 4.1 or below the UI is like shown below
For further assistance, kindly contact us on support@helicalinsight.com or post your queries at Helical Forum
