In the Canned Reports module, there are various quick alignment options that are available on right clicking any component.
When you hover the mouse on Align option, you get a number of options. They are detailed below:
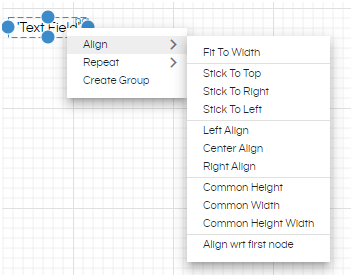
-
- Fit to Width: This option is used to make the width of the selected component to the width of the column or page where it is placed.
Before: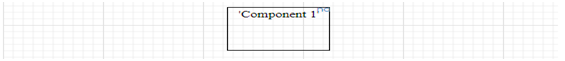
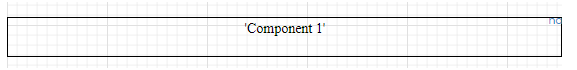
After fit to width applied:
-
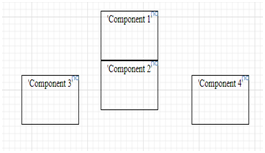
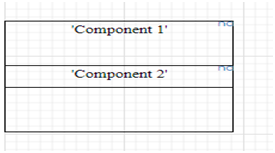
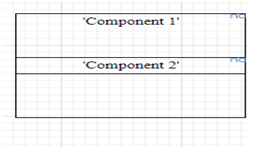
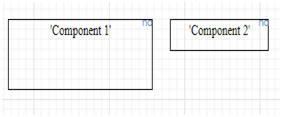
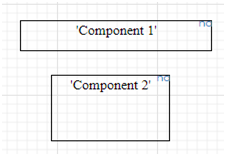
- Stick to Top: This is used to place the component at the topmost location. This location is relative. So, if there is a component placed above it already, the selected component is placed at the bottom of the previous component.
Before
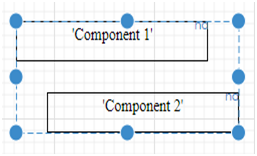
After Applying Stick to Top on Component 2
-
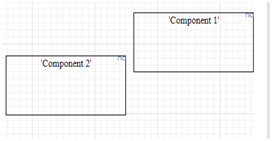
- Stick to Right: This is used to place the component to the rightmost position. If space is free then the component goes to the right most side of the page, or otherwise if there is a component then the selected component is placed to the left of that component.
Before
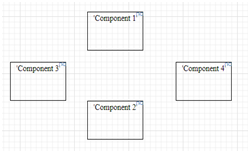
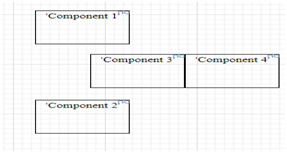
After Applying Stick to Right on Component 3
-
- Stick to Left: This is used to place the component to the leftmost position. If space is free then the component goes to the left most side of the page, or otherwise if there is a component already preset then the selected component is placed to the right of that component.
Before
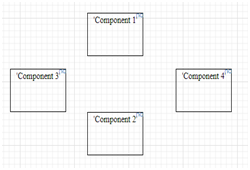
After Applying Stick to Left on Component 3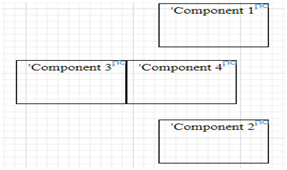
-
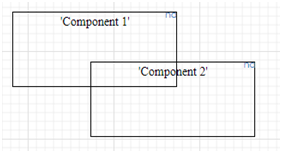
- Left Align: The selected component is aligned to left of the canvas. If there is any component to the left of it, it will overlap on that component as well
Before

After applying Left Align to component 2
-
- Center Align: The selected component is aligned to the center of the canvas. It may overlap with any other component.
Before
After applying Center Align to Component 1
-
- Right Align: The selected component is aligned to left of the canvas. If there is any component to the left of it, it will overlap on that component as well
Before
After applying Right Align to component 2
-
- Common Height: You can select multiple components on the canvas by pressing control while selecting the components or dragging the mouse to highlight components to be selected and set a common height for them. Now that you have selected multiple components, on whichever component you right click and apply common height, that component’s height will get applied to all other components.
Before
After applying Common Height
-
- Common Width: You can select multiple components on the canvas by pressing control while selecting the components or dragging the mouse to highlight components to be selected and select a common width for them. Now that you have selected multiple components, on whichever component you right click and apply common width, that component’s width will get applied to all other components.
Before

After applying Common Width
-
- Common Height Width: If you want to set a common height and width for selected components, you can use this option directly.
Before
After applying Common Height Width
-
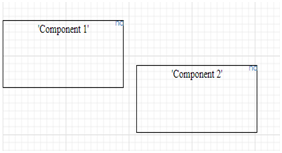
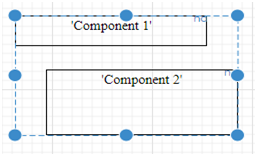
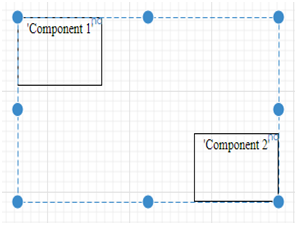
- Align wrt first node: If there are 2 components on the canvas and you want to align them together, you can select both the components and click on align wrt first node on right click for the second component. This will align both of them together.
Select both components
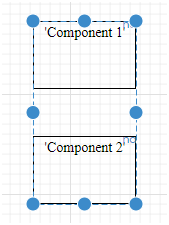
After selecting Align wrt first node
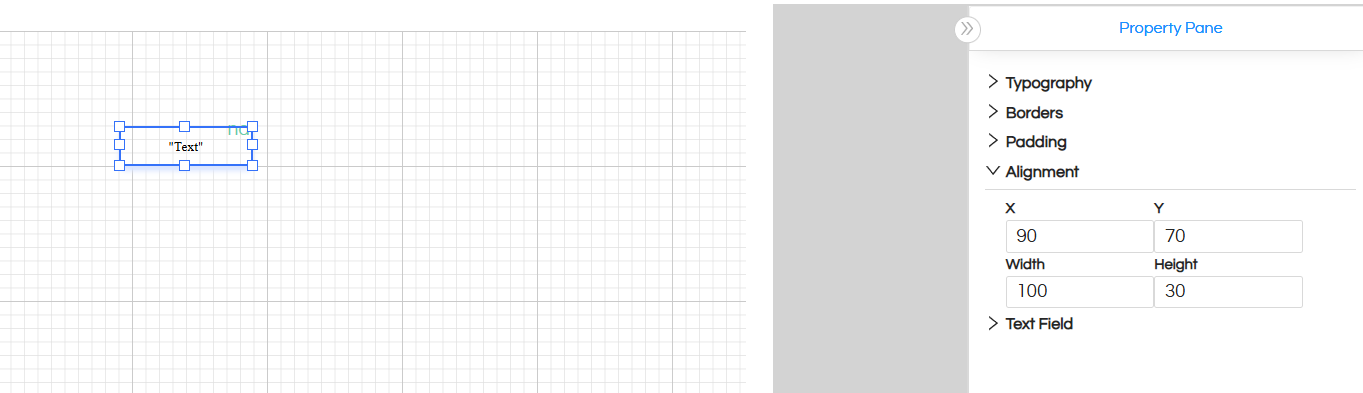
PIXEL PERFECT ALIGNMENT
Apart from the above options, you can also set the alignment of a particular component by giving the X, Y coordinates and the height and width of the component in pixels.
In order to do this, click on the component and go to properties pane. Now the properties pane will show the properties for that particular component only. Go to the alignment section and give the alignment required.
version 6.0 onwards the new UI is like shown below
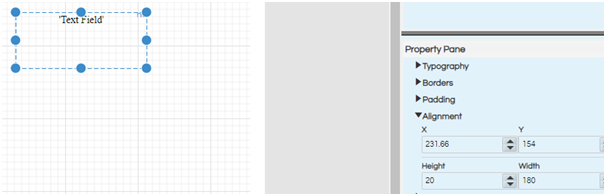
for version 4.1 or below the UI is like shown below
For further assistance, kindly contact us on support@helicalinsight.com or post your queries at Helical Forum
