Metadata is basically a logical DB schema which gets stored locally in the backend DB of Helical Insight and allows users to define which tables, columns they would want to keep. Thus, different Metadata can be created for the different set of users like finance metadata, sales metadata, operations metadata which then can be shared with the relevant set of people. This will not only increase the performance but also help users to see only relevant tables and columns they are interested in, thus aiding in ease of usage.
Metadata further also allows users to define/edit “Joins” (over and above present in the database which can also be edited at metadata level), give “Alias” name for the tables and column and apply “Data security” as well as write custom native SQL also as a View (not to be confused with the database views, these views are helpful when it is a bit complex to create reports by simply using drag drop interface).
To create a metadata, a user has to create a data source initially. Without a data source, metadata cannot be created. There are two methods of creating metadata.
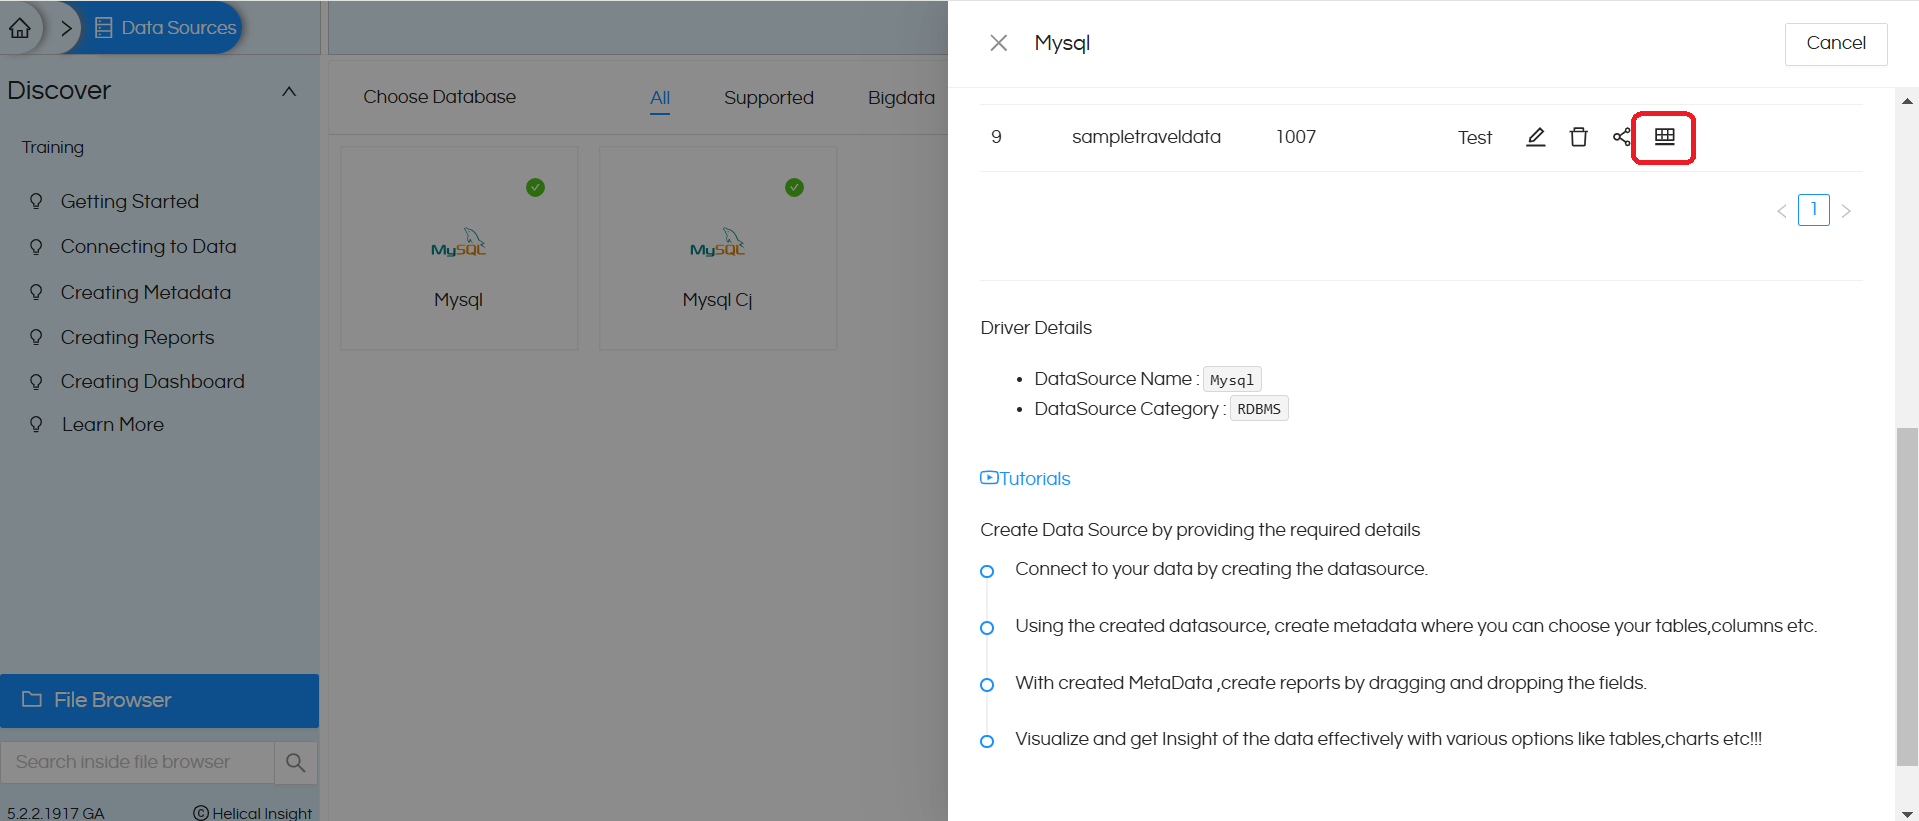
Method 1: Once the data source is created then on the “view” tab you can see the listings of the data source for that specific database. You can click on “Create Metadata” icon and you will get navigated to create-metadata page.
Method 2: You can click on the “Metadata” button on the top ribbon. Then it will navigate to created metadata page.
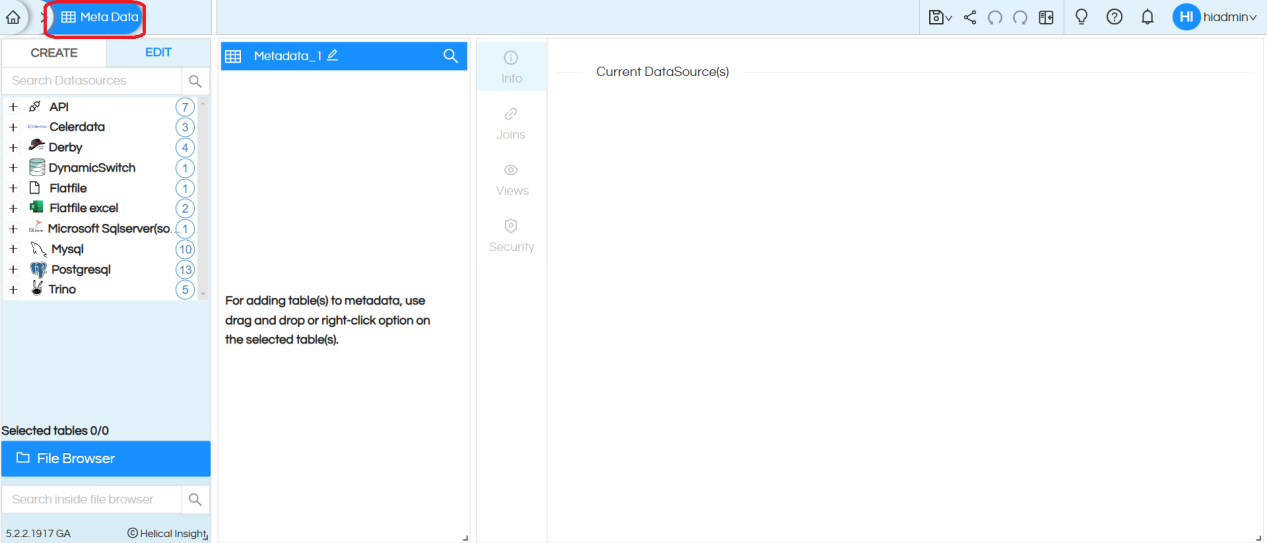
Note: On the left side, we only show the list of databases for which atleast one connection has been made.
After you have finished first step (using either method 1 or method 2) you will be on the metadata page and on the left side you can see listings of the data sources created by you or shared with you. If the datasource has been shared with you as “Execute Only” permission then it will not appear here in this list. Navigate to the required data source and click on it.
Step 3: You can see the list of catalogs and schemas present in the database. Select the required schema (from Mysql we have selected sampletraveldata database)
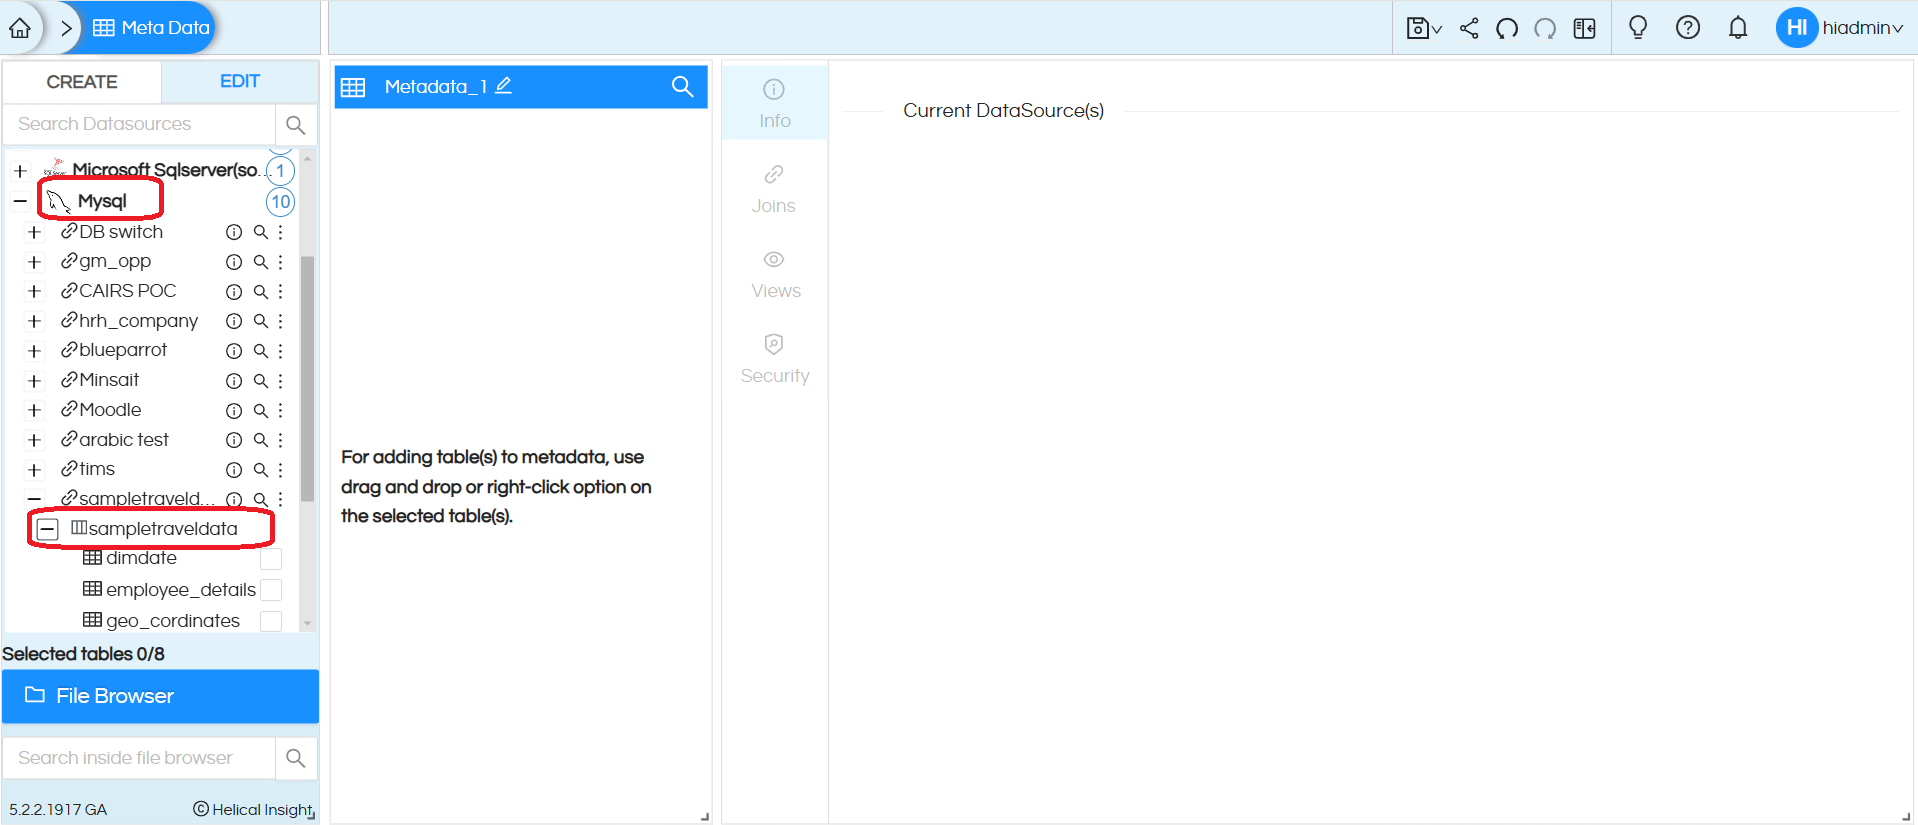
Step 4: When we expand the schemas, it lists all the tables.
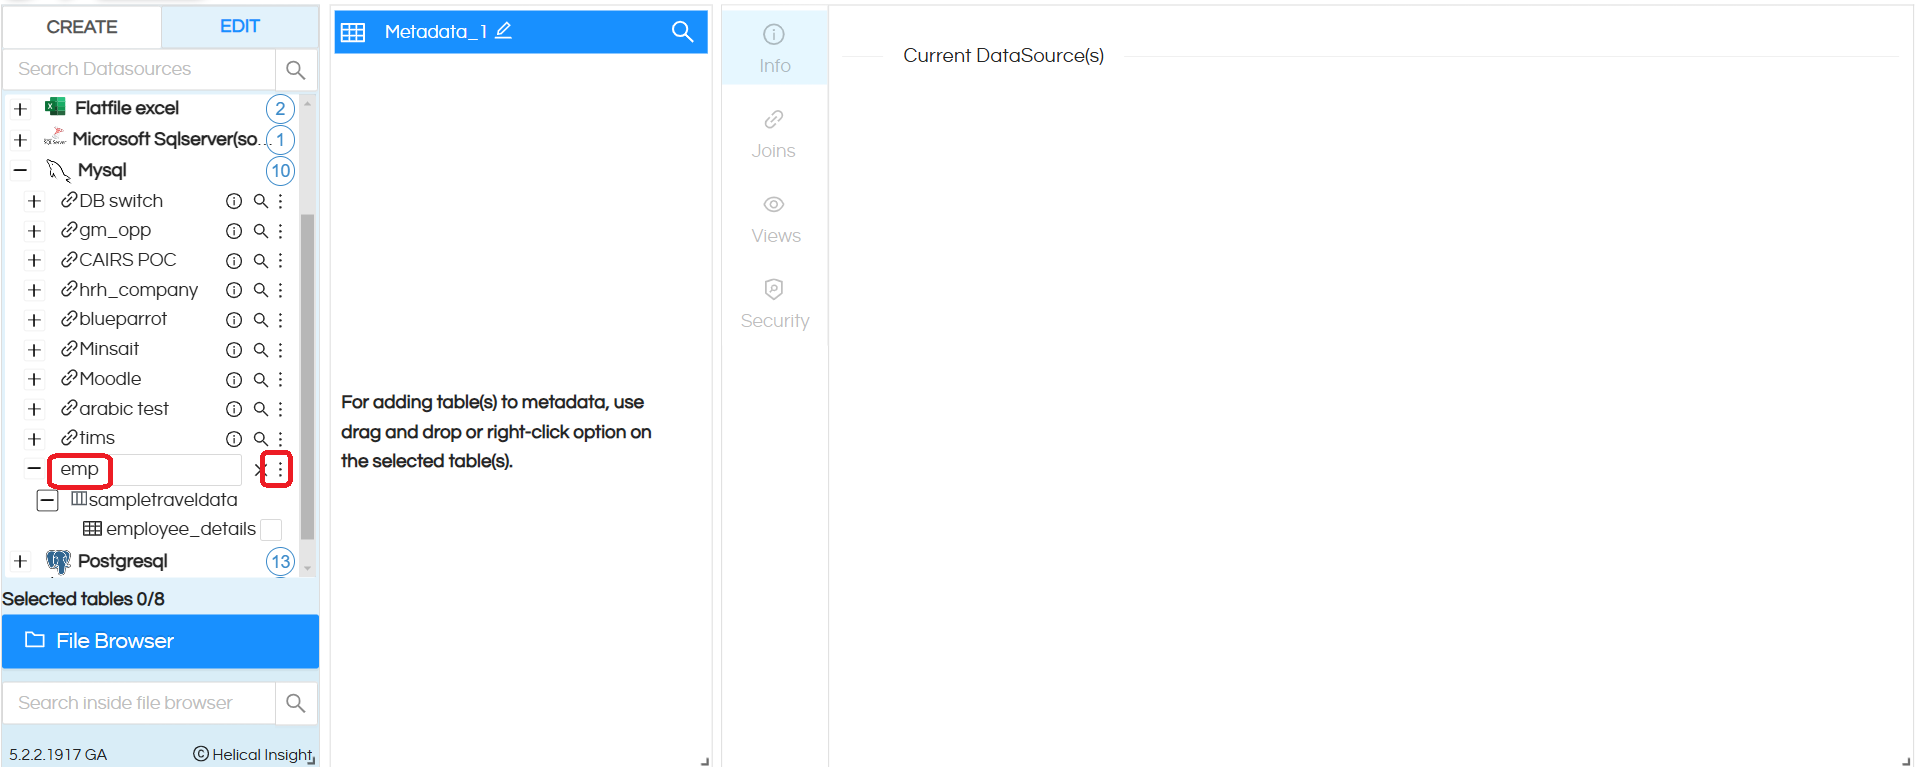
Search: There is a search option available which also supports wild character (regex) search which can also be used for quicker navigation (as shown in below image).

More Functions: (as shown in above image) Clicking on the three dots allows you certain additional functionalities like to refresh the connection (especially useful if meanwhile more tables and columns have been added), edit the data source.
Note:
If the data source connection credentials have been changed at the data source page and the application is not able to make the connection to the data source it will appear as red.
Clicking on Refresh will delete the existing cache entry and prepare a new cache for the connection. This is to be used in case if you new tables/columns have been added in the DB which you would like to use for reports dashboards creation purpose. Due to this, it might take a bit of time for loading the tables (depending on the hardware configuration and number of tables columns present).
Step 5: By default, none of the tables and associated columns are selected. Select the tables you are interested to keep in the metadata. It is always advisable to keep only limited tables in the metadata which are required for reporting purposes. You can also create multiple metadata’s for different set of roles/functional requirements (which is a recommended approach).
Once the selections are made you can either drag into the second selection interface or right click and use the option “Add to Metadata”. The selected tables and columns will appear like the below. On right click on the left most side wherein all schema and tables are listed, you also have option to Select All also.
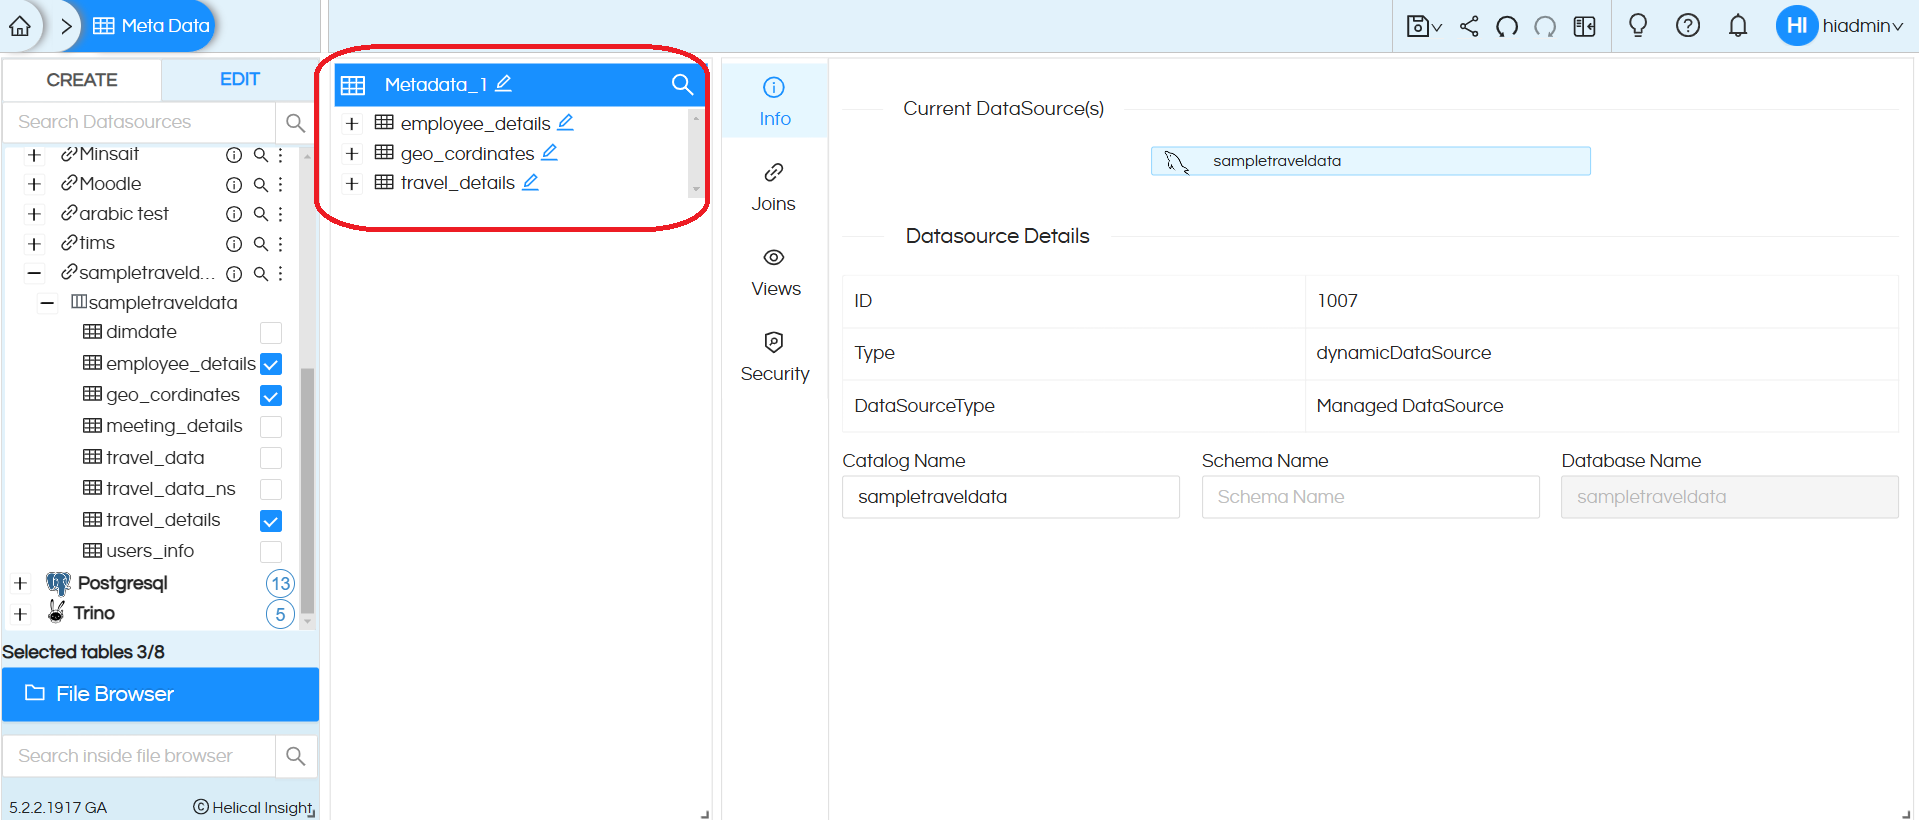
Step 6: Once the tables are added to the metadata, on clicking on a particular table name, the columns within that table will be loaded. This operation can be aborted by clicking on the line that appears below the table name while loading.
You can right-click on the table/column names and perform certain operations.
The first operation is edit table name. You can rename the tables and columns in order to give it a simpler name (This is especially crucial since the metadata might be used by non-tech users for reports creation). You can rename any table/column this way.
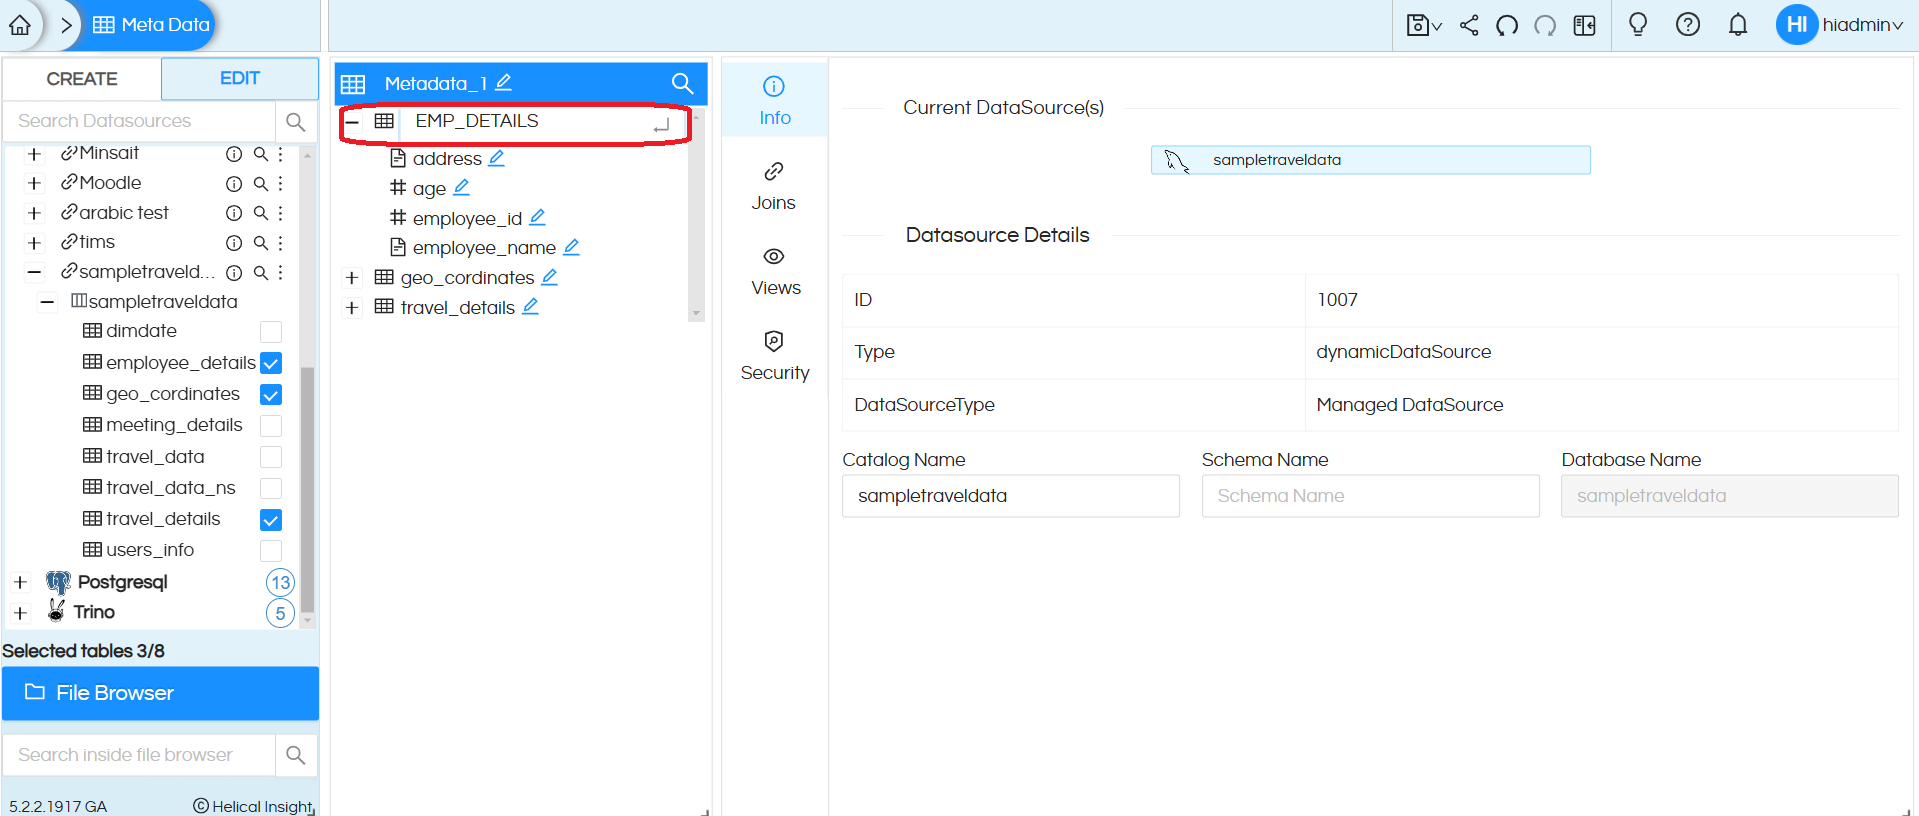
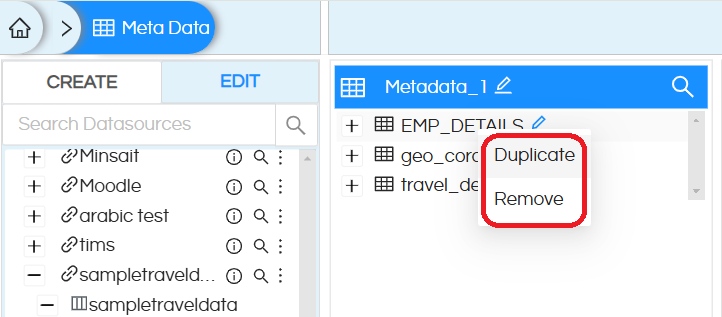
The second operation is “Duplicate”. You can make a duplicate of a table or column by this operation. Name of the duplicate table/column is the same as the original table/column with an additional _1 added to the file name. This can be renamed as explained above. Duplicate of a column appears in the same table with the nomenclature as described.
Note: Before you make a duplicate of already duplicated table/column it is important to save the metadata.
The third operation is “Remove”. This will allow you to remove any table/column from the metadata. It is advisable to remove the unnecessary columns which are not required.
Naming the metadata file: You can double click on the metadata file name (at the top) and give it another different file name. By default it is given a name like Metadata_1 etc. Alternatively, even when you are saving the metadata even then you have the option of giving it a specific name and path and then save.
Step 7: Info: Info tab allows you to change the metadata’s data source connection detail. For example, you have created metadata and reports from the development database, now you want the metadata to point to the production database. In that case, you can click on “Change Datasource” and change the metadata to now point to your production database.
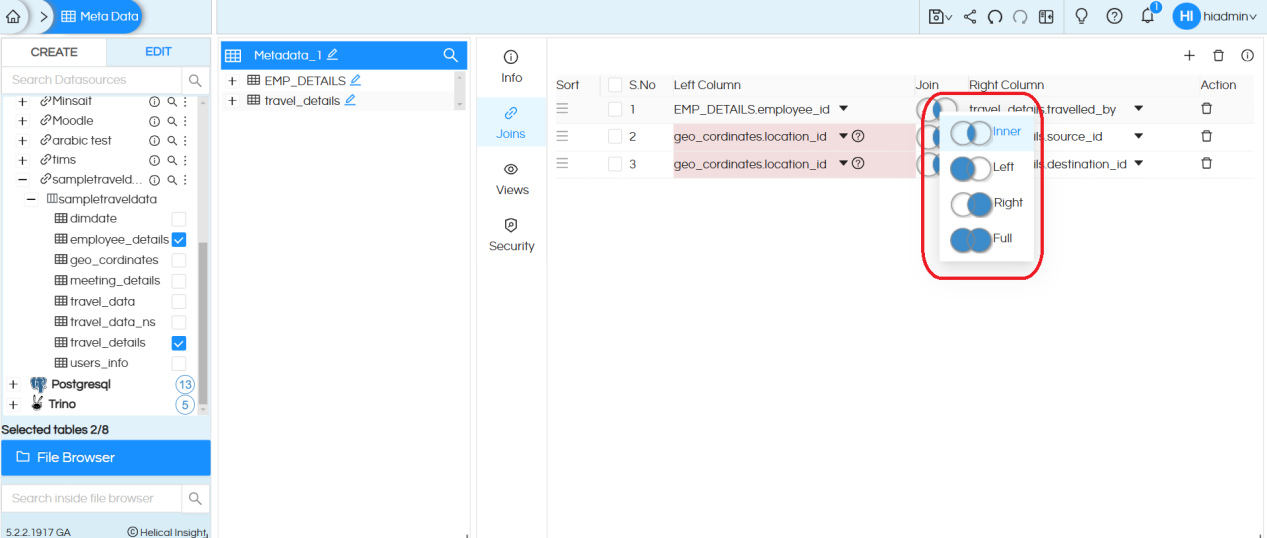
Step 8: Joins: Based on the kind of Primary Keys and Foreign keys present at the database it will show you list of joins. In case if there is any joining condition which is present on any column which is not part of the metadata it will appear as highlighted red (as shown below). Those can be deleted. You can also use “Delete Invalid Joins” functionality present near the “Add” button which will delete all the invalid joins in a single go.
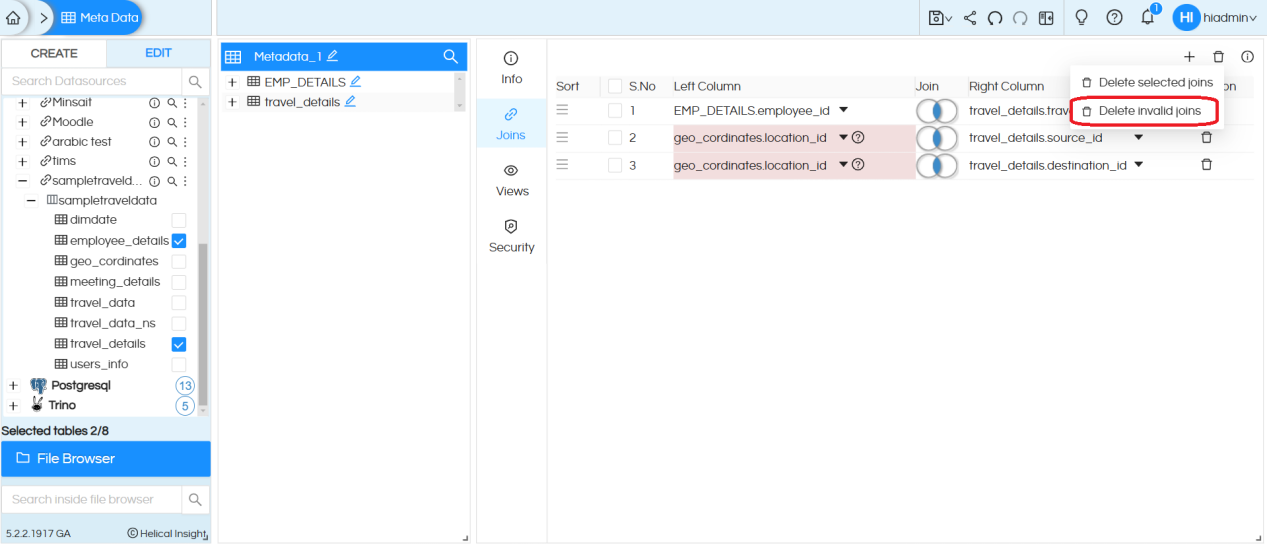
You can delete the already existing joins by pressing on delete button. You could also change the join type as well.
Also you can add more joins by clicking on “Add” Button, for specifying the columns you can either drag the columns from the metadata selection panel into the selection box or merely type the name of a column and then select from the drop-down. The sequence of joins can also be changed by dragging them (present next to the selection checkbox).
Note: that when we add joins here, this is happening virtually only at our metadata layer and those joins are not being added a the DB level.
Step 9: Views: In certain cases certain reports might require a lot of complex calculations. Hence in those cases “Views” can be used. Views allow you to write your own SQL queries and the output of that SQLQuery will be visible as a listing (view) along with tables and columns in the metadata. This view can also be used by an end user to create reports. Note that these views are not DB level views, they are just part of our Metadata only.
There are two types of views available: 1. Query 2. Dynamic Query
Please refer to the following blog for detailed information : Usage of views in Helical Insight
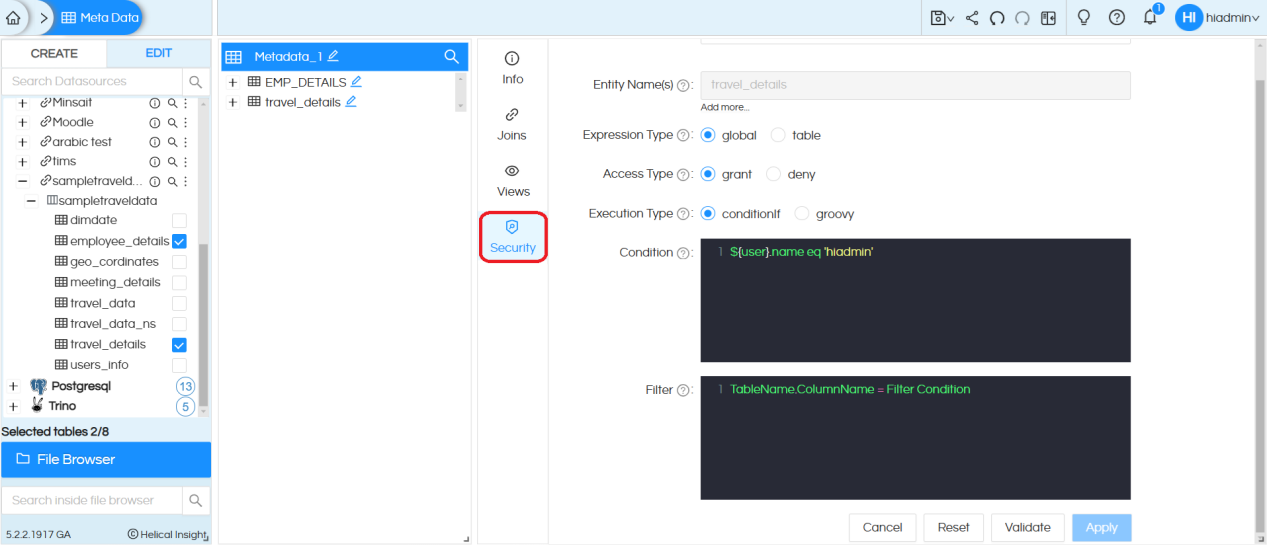
Step 10: Security: You can use the same metadata to create report/dashboard which will be shared with multiple users. In that case, we may want to make sure that even though same report/dashboard is shared with everyone they get to see their own data only. In those cases, metadata security conditions need to be implemented.
Table level, row level, and column level security conditions can be implemented over an organization, roles, user or profile.
To learn more about metadata security implementation click here
https://www.helicalinsight.com/data-security/
To learn metadata security conditions usage click here
https://www.helicalinsight.com/metadata-security/apply-metadata-security-condition/
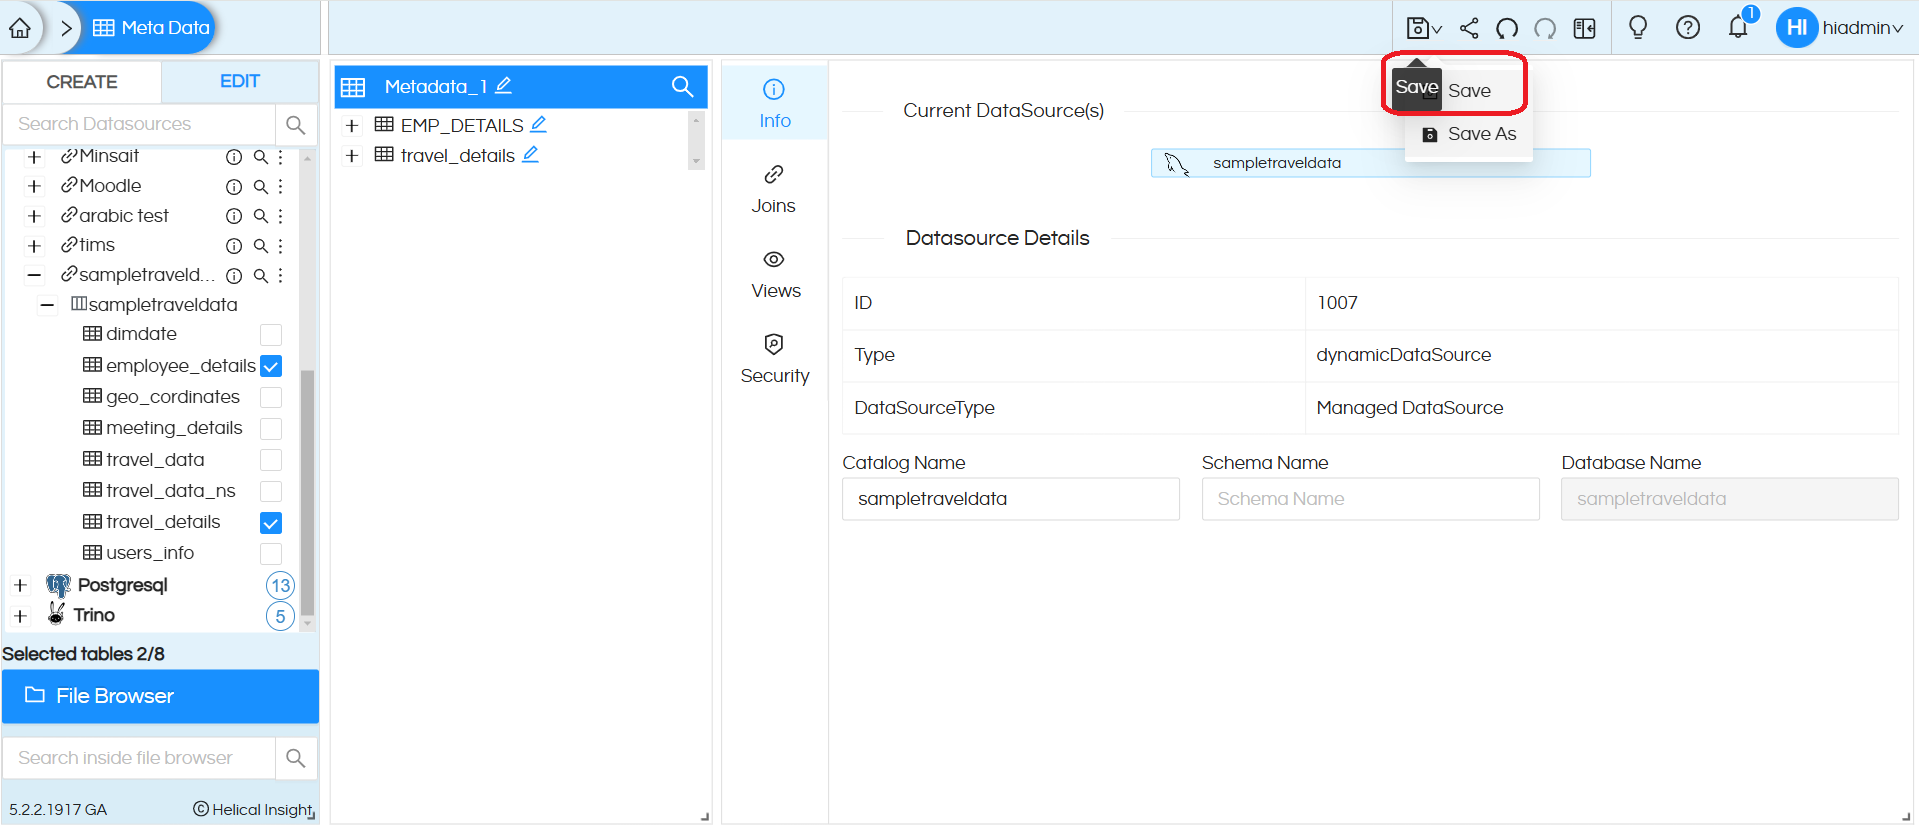
Step 11: Saving the metadata: Once the metadata is created with all the joins, security conditions, views, naming etc then you can click on “Save”, the file browser will appear. You can save the metadata in a folder of your choice. By right clicking in file browser you can also create your own folder inside which you can save the metadata. Read more about File Browser operations here.
Please note that if your metadata is having any invalid joins or blank joins then it will throw appropriate message.
Note: Save Metadata creates a copy of the tables and columns in the cache. Hence, saving metadata may take some time depending on the hardware size as well as the db performance and network lag.
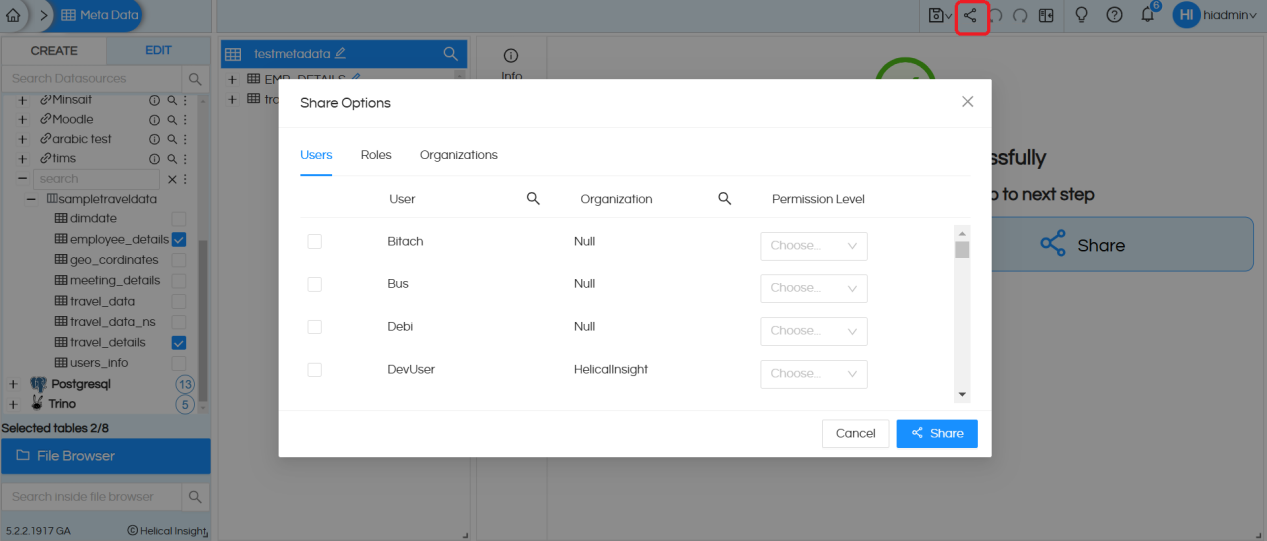
Step 12: Share: You can click on the Share button to share the metadata. If you want to share a report with a user it is also essential to share the metadata from which the report is created.
In order to share the metadata it is important that the metadata is saved first.
Once you click on the share you will have the option of sharing the metadata with an individual user, a role or an organization also. Please note that you can only share with a role/user who is part of your organization and not outside the organization. Whereas a superadmin can share it across anyone.
While sharing you can also specify the permission level.
You are also having the option of sharing from the file browser also. Please refer to
Sharing Metadata with Organization
Note: If the number of tables and columns in your database is huge, then the metadata page automatically becomes really huge and heavy it may cause the browser memory to be full. This in turn will slow down the page and might even cause crashing of the browser page. In order to overcome this, you could implement the following:
- At the database level, create a user with access to only limited number of tables depending on the reporting requirements, then use this specific user to connect to the database at helical insight datasources layer. Automatically, the performance at metadata will improve due to limited number of tables.
- Second option is on the datasources page, you can limit how much information gets displayed at the metadata layer (a sort of prefiltering). This can be done by going to “Advanced” option in the datasource connection.
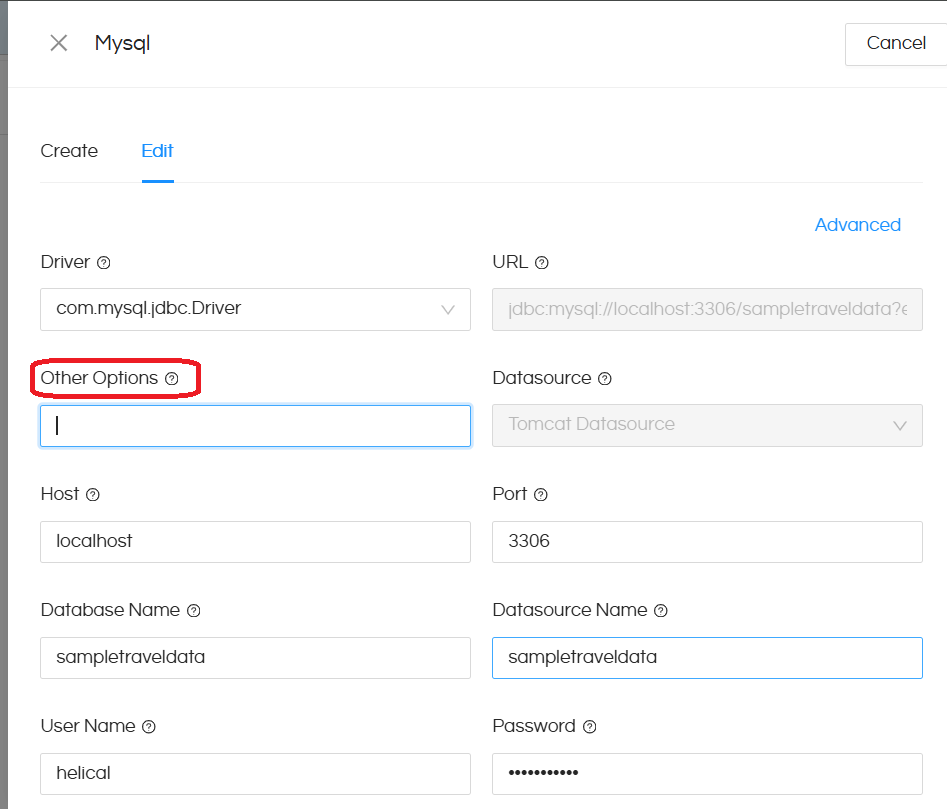
In the “Other Options” placeholder, you can add restricting strings such as below. Note that the below syntax might be a bit different for different databases. You can reach out to support@helicalinsight.com in case of any specific questions:
?HI_SCHEMA_CONTAINS=hi (this will show only the schema names that contain the string hi)
?HI_CATALOG_CONTAINS=t (this will show only the catalog names that contain t)
?HI_CATALOG=travel_data (this will show only travel_data catalog)
Similar strings and regular expression (regex) can be used to restrict the database tables, schema, catalogs that are visible at the metadata level.
So with above method you can initially restrict the size of listing on the metadata page so that it is fast and make initial metadata. Then you can edit the already created datasource to include other table/schema (using the above mentioned method), then edit the metadata created earlier (refresh the cache) and then select additional tables required and make it part of the metadata by using the merge option. This way your create-metadata browser page will never be so heavy and will work fine.
For more information you can email on support@helicalinsight.com
