Many a times there arise a need to add up additional objects to dashboard, other than reports that we have built up. We may need to add additional text to label up the objects or put up a description or elaborate a report. Other times we may have to add up the organization logo or other images to the dashboard. This is a simple task with Helical Insight 5.0.

This blog will show how to add up Image and text to your dashboard.

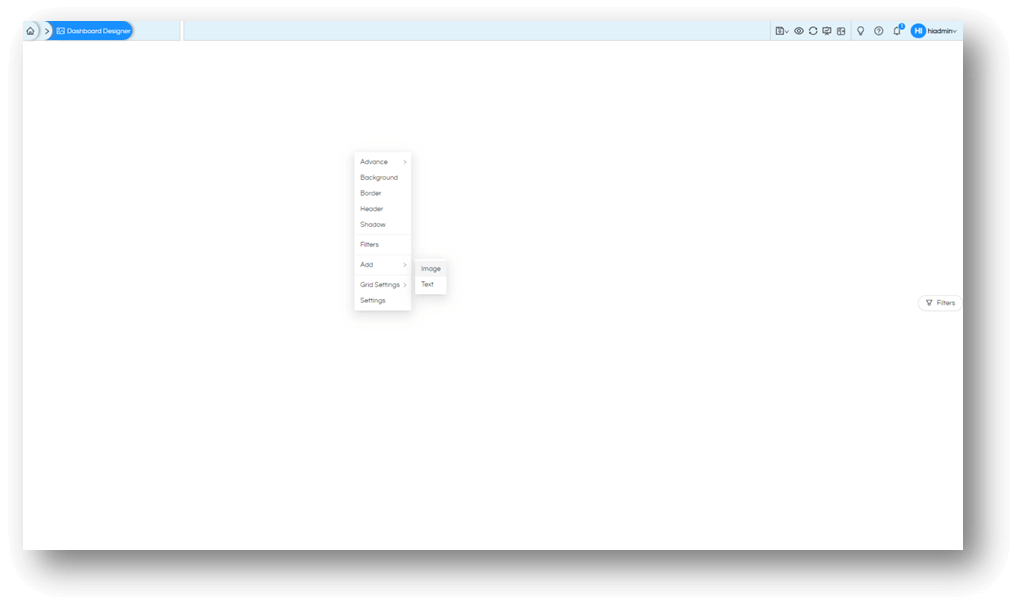
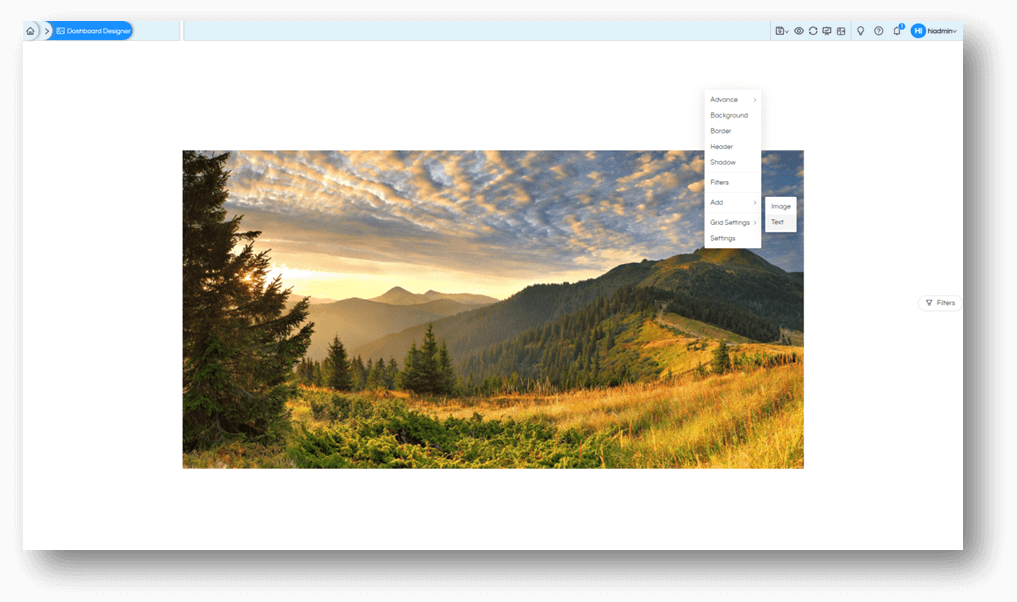
1. Adding Image to Dashboard

Step 1: Right-click on dashboard (blank area on dashboard where there is no other object). In the context menu, go to “Add” and click on “Image”. This will open panel with options related to image.

Adding Image and Text within Dashboard

Adding Image and Text within Dashboard

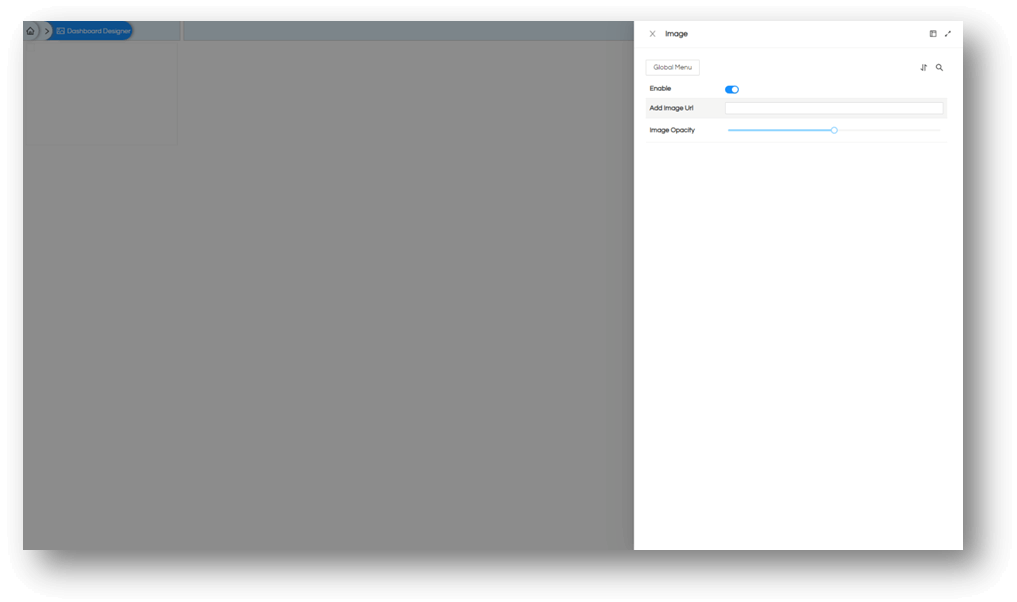
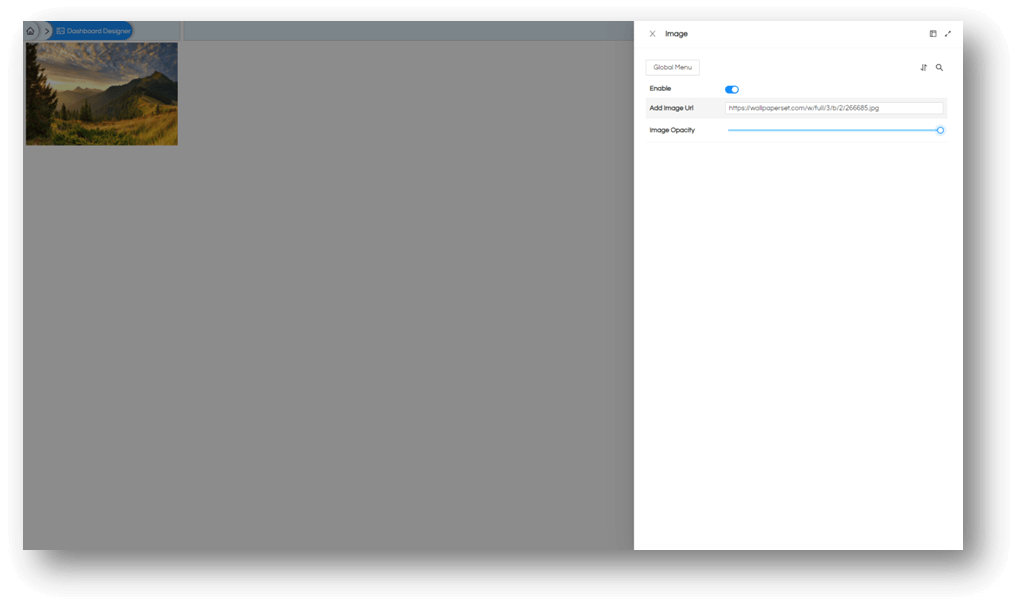
Step 2: In the options panel ensure that the options are enabled and add an image URL. This location can be a relative path to Helical Insight application like image that are kept within your system (then we can use syntax like getExternalResource? Followed by image path), or this could be an absolute path like a web URL of an image. If the image is accessible to this application, you will see it added to the dashboard as an object in itself.

With the slider option you can adjust the transparency of the image. Left being fully transparent, and right being fully opaque.

Adding Image and Text within Dashboard

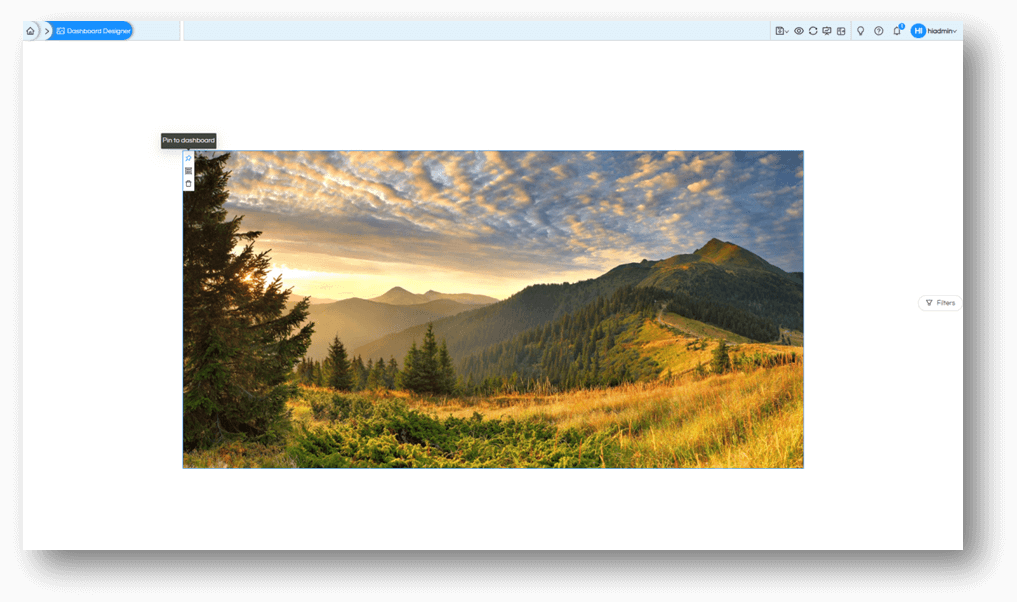
Step 3: Resize and re-position. Once your image is added to dashboard, resize, reposition, group it or pin it just like any other object on the dashboard.

Adding Image and Text within Dashboard

2. Adding Text to Dashboard

Step 1: Right-click on dashboard (blank area on dashboard where there is no other object). In the context menu, go to “Add” and click on “Text”. This will open panel with text editor and other options.

Adding Image and Text within Dashboard

Adding Image and Text within Dashboard

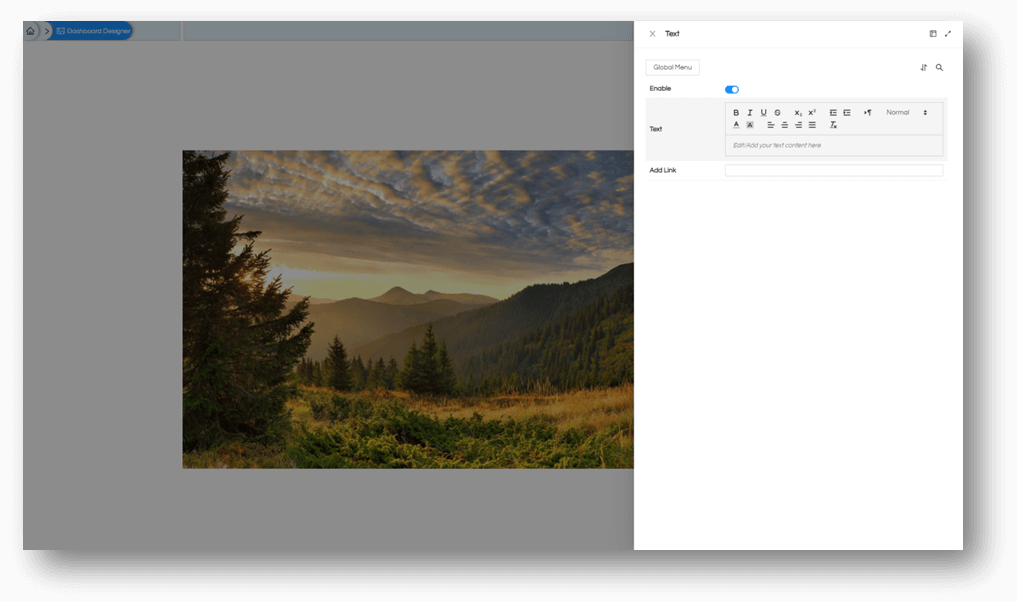
Step 2: In the panel ensure that the options are enabled and add the text you wish to write on dashboard, this is a multi-line text editor. You can format the whole text or part of it; the following options are available for text formatting

  • Bold: this makes the text appear as Bold (strong). This can be applied to the selected text.
  • Italics: this makes the text in italics (emphasize). This can be applied to the selected text.
  • Underline: this makes the text underlined. This can be applied to the selected text.
  • Strikethrough: this option lets you strike out the text by placing line in the middle of the character. This can be applied to selected text.
  • Subscript: this is used to make text as if it is a subscript. This can be applied to the selected text.
  • Superscript: this is used to make the text as if it is a superscript. This can be applied to the selected text.
  • Indentation: decrease or increase indentation of the text. This can be applied to the line of text.
  • Text Orientation: this can help you write text that follow right to left writing pattern. This is applied to the line of text.
  • Text Size: this can be used to make the text appear as if it is heading in HTML page, from H1 to H6. This is applied to the line of text.
  • Text Color: this will let you give a color to your text. This can be applied to the selected text.
  • Text Highlight Color: this will let you add highlight color to the text. This can be applied to the selected text.
  • Text Align: this helps you to align the text as Left, Centre, Right, Justified. This is applied to the line of text.
  • Delete Formatting: this allows you to remove any text formatting you might have applied. All text will return to normal text without any of the above formatting.

You can also make this text object as a hyperlink by adding a URL to the object.

Adding Image and Text within Dashboard

Step 3: Resize and re-position. Once your text object is added to dashboard, resize, reposition, group it or pin it just like any other object on the dashboard.

Adding Image and Text within Dashboard

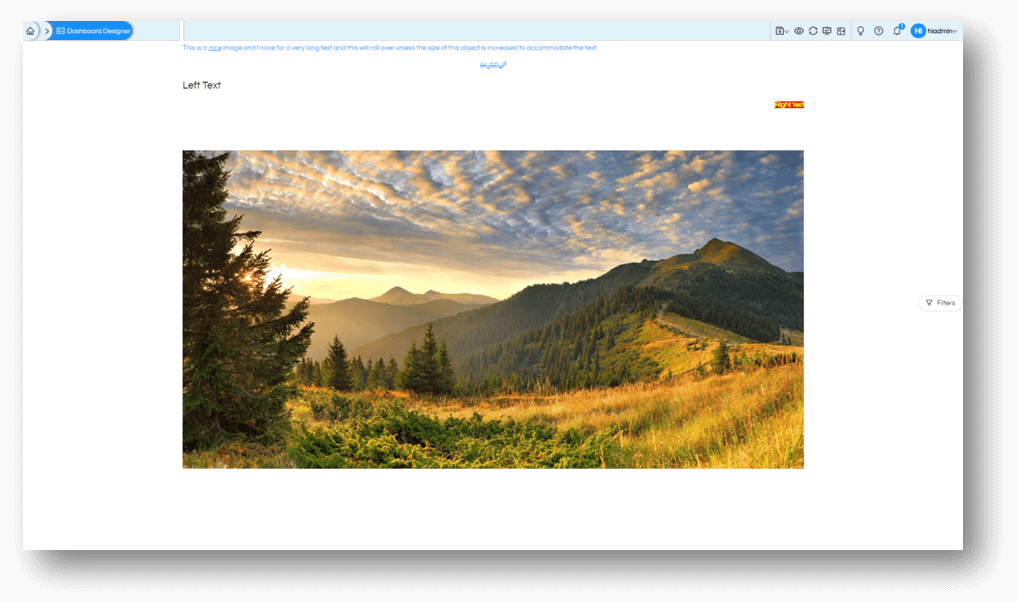
If you added any hyperlink, clicking on this object should take you to the mentioned location.

Adding Image and Text within Dashboard

Thank You,
Helical Insight

Helical Insight’s self-service capabilities is one to reckon with. It allows you to simply drag and drop columns, add filters, apply aggregate functions if required, and create reports and dashboards on the fly. For advanced users, the self-service component has ability to add javascript, HTML, HTML5, CSS, CSS3 and AJAX. These customizations allow you to create dynamic reports and dashboards. You can also add new charts inside the self-service component, add new kind of aggregate functions and customize it using our APIs.
Helical Insight, via simple browser based interface of Canned Reporting module, also allows to create pixel perfect printer friendly document kind of reports also like Invoice, P&L Statement, Balance sheet etc.
If you have a product, built on any platform like Dot Net or Java or PHP or Ruby, you can easily embed Helical Insight within it using iFrames or webservices, for quick value add through instant visualization of data.
Being a 100% browser-based BI tool, you can connect with your database and analyse across any location and device. There is no need to download or install heavy memory-consuming developer tools – All you need is a Browser application! We are battle-tested on most of the commonly used browsers.
We have organization level security where the Superadmin can create, delete and modify roles. Dashboards and reports can be added to that organization. This ensures multitenancy.
A first-of-its-kind Open-Source BI framework, Helical Insight is completely API-driven. This allows you to add functionalities, including but not limited to adding a new exporting type, new datasource type, core functionality expansion, new charting in adhoc etc., at any place whenever you wish, using your own in-house developers.
It handles huge volumes of data effectively. Caching, Pagination, Load-Balancing and In-Memory not only provides you with amazing experience, but also and does not burden the database server more than required. Further effective use of computing power gives best performance and complex calculations even on the big data even with smaller machines for your personal use. Filtering, Sorting, Cube Analysis, Inter Panel Communication on the dashboards all at lightning speed. Thereby, making best open-source Business Intelligence solution in the market.
With advance NLP algorithm, business users simply ask questions like, “show me sales of last quarter”, “average monthly sales of my products”. Let the application give the power to users without knowledge of query language or underlying data architecture
Our application is compatible with almost all databases, be it RDBMS, or columnar database, or even flat files like spreadsheets or csv files. You can even connect to your own custom database via JDBC connection. Further, our database connection can be switched dynamically based on logged in users or its organization or other parameters. So, all your clients can use the same reports and dashboards without worrying about any data security breech.
Our application can be installed on an in-house server where you have full control of your data and its security. Or on cloud where it is accessible to larger audience without overheads and maintenance of the servers. One solution that works for all.
Different companies have different business processes that the existing BI tools do not encompass. Helical Insight permits you to design your own workflows and specify what functional module of BI gets triggered