In this blog, we will see how to customize the color of any visualization in Helical Insight application. For reference we are taking example of a Grid Chart with option of Bar, we have also added a dimension to Color property of Marks.
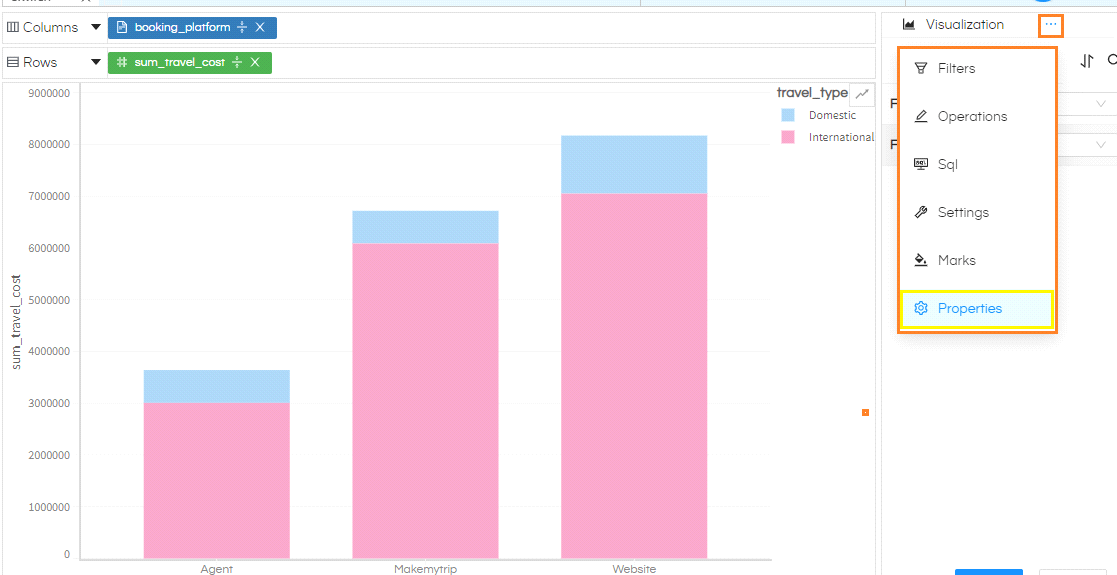
- Select meatball icon on top right. List of additional menu options will appear. Select ‘Properties‘ from this list.
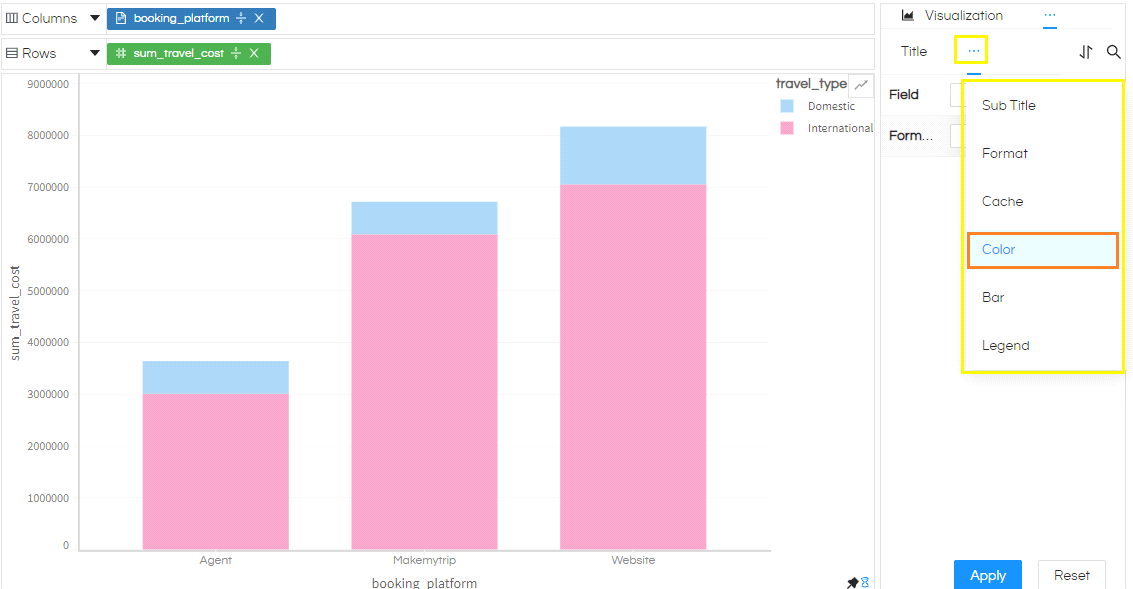
- Again, select the meatball icon within properties in front of Title. A list of additional options for Properties will appear. Select Color from here.
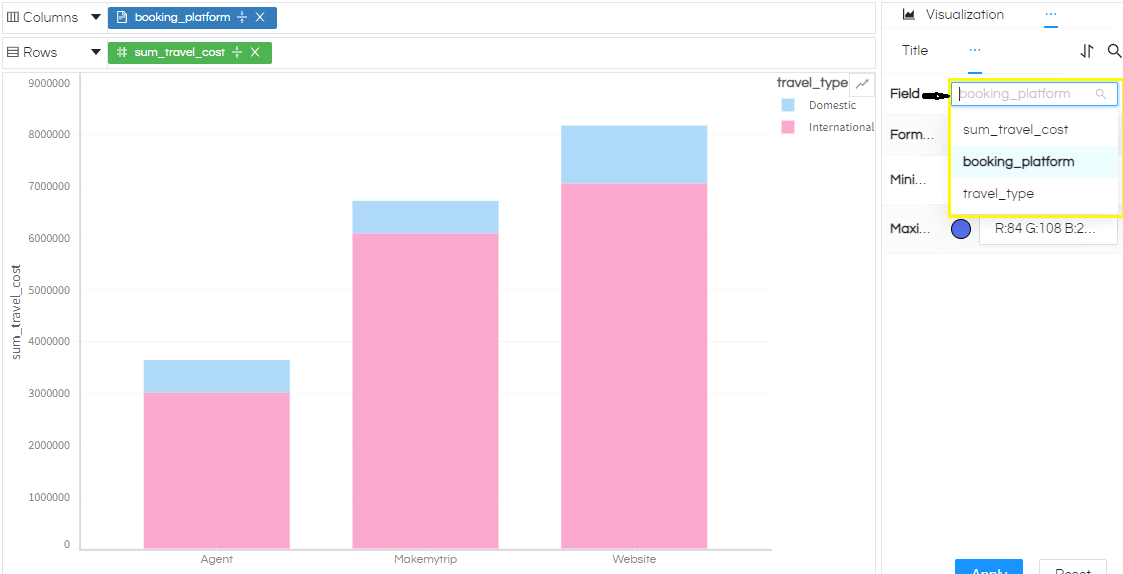
- In the Field, value all the selected fields are listed. Select the field for which you want to customize the color. In the example below, booking_platform is selected.
- In Form field select the way in which you want to apply the color, as
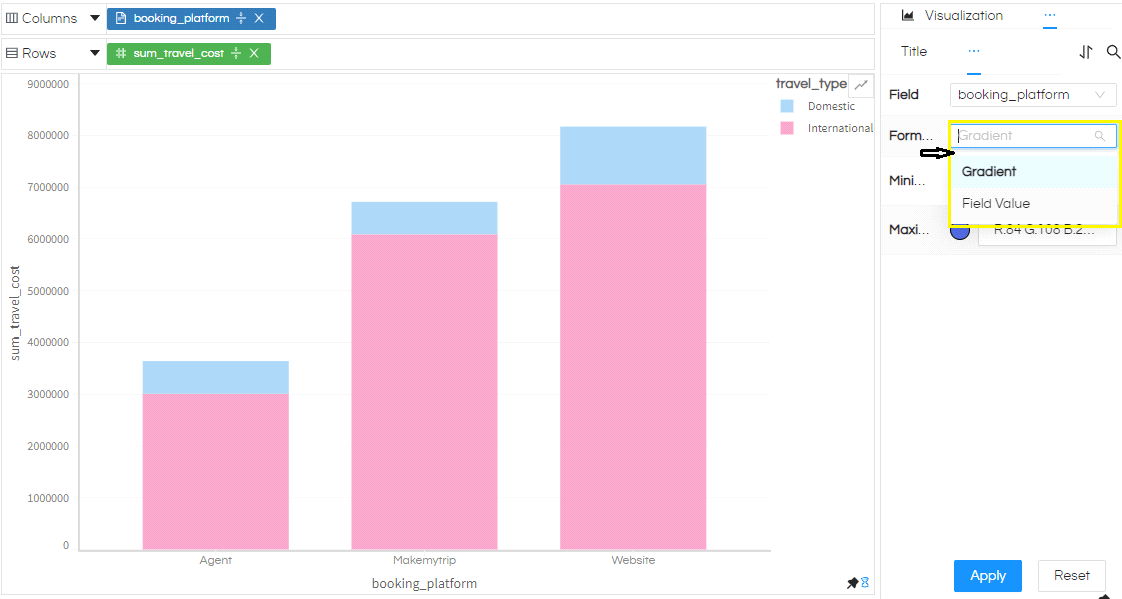
- Gradient: can be useful when we have range of continuous values i.e. measure. For example in this current use case for “sum_travel_cost” it will work fine.
- Field Value: can help when we discontinuous individual values
In above example travel_cost can have Gradient where each value will take color based on its value. While for travel_type and booking_platform can be Field Value where individual values can have its own color. Let us try to implement both on the same field to understand the difference
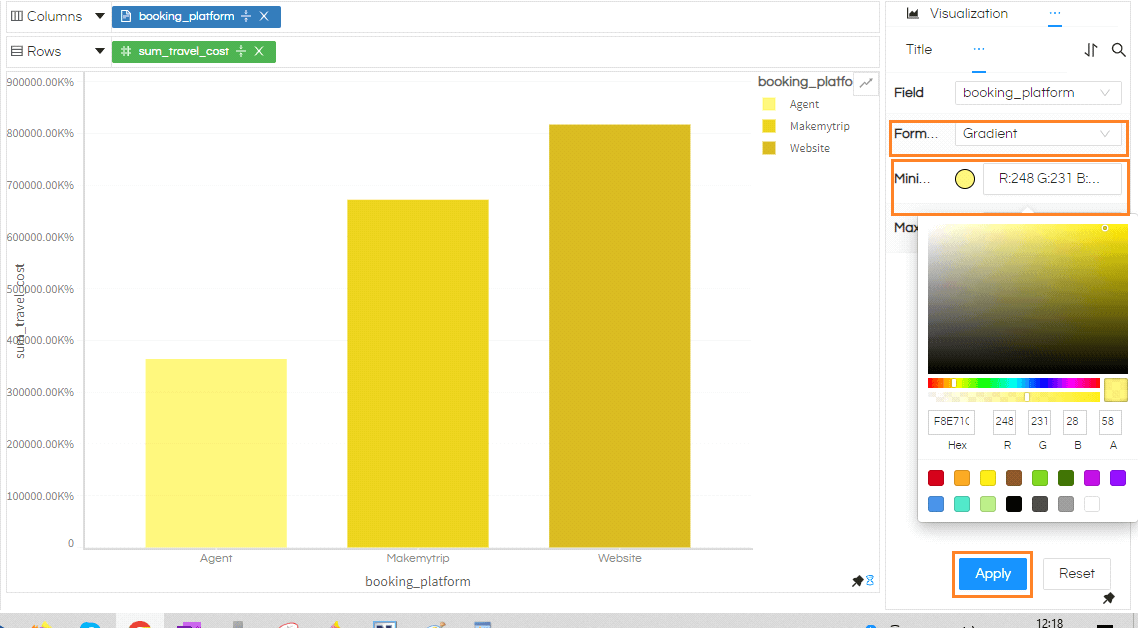
Gradient will impart the color where the intensity will vary from Minimum to Maximum. Choose any color from color pallet or if you have your color codes you can use the same for both Minimum and Maximum. In the example below, both minimum and maximum value are set. Select Apply once you are done with setting the color values.
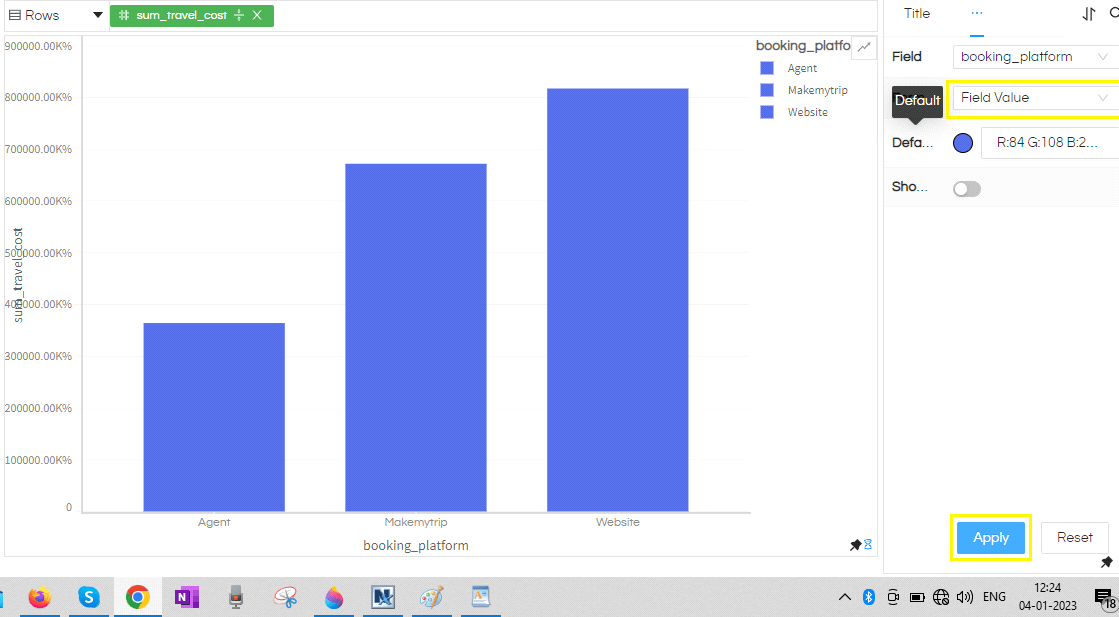
As discussed earlier we can also apply color to each value of booking_platform. For this Select Field Value in Field as highlighted in the image below. Default specifies the default colors to each of the bar in the graph (unless specified otherwise)
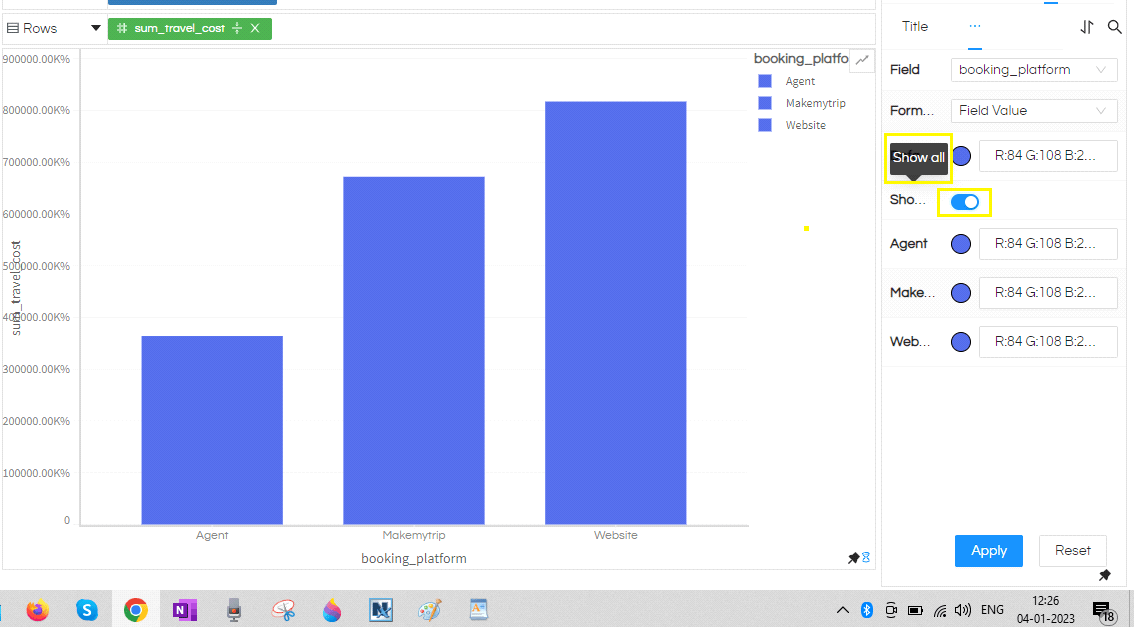
To provide individual values click on Show all slider to enable it. All value of booking_platform (as selected here) are listed for you to select color.
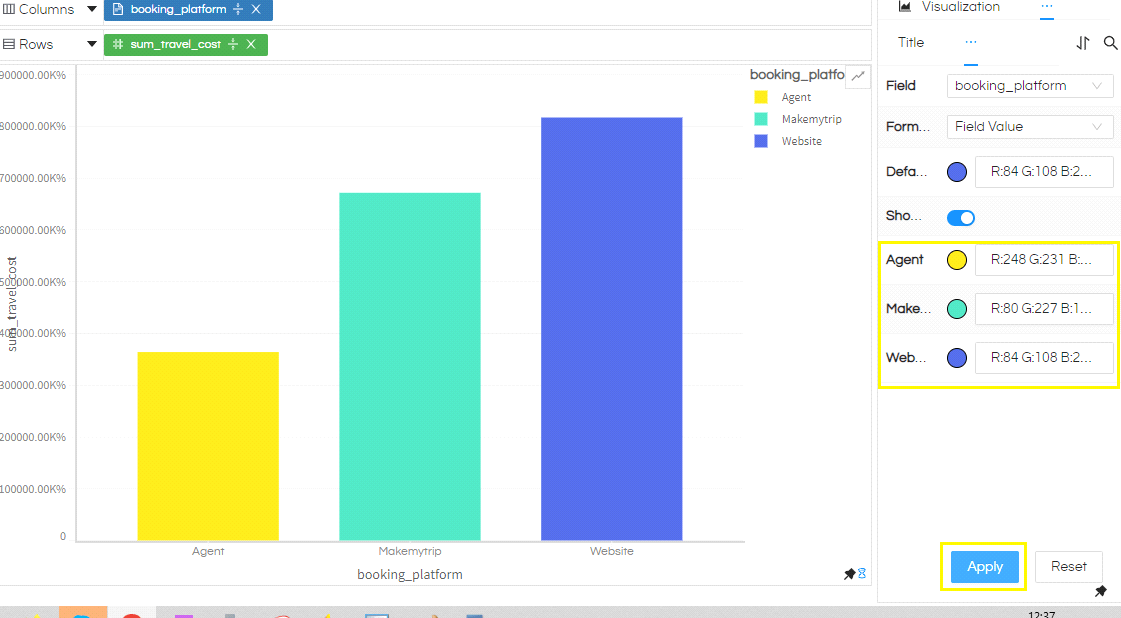
Just like before select the desired color for each of the values. Once done click Apply.
Reset will undo all the settings and restore default values, to reflect this on report always remember to select Apply, after Reset.
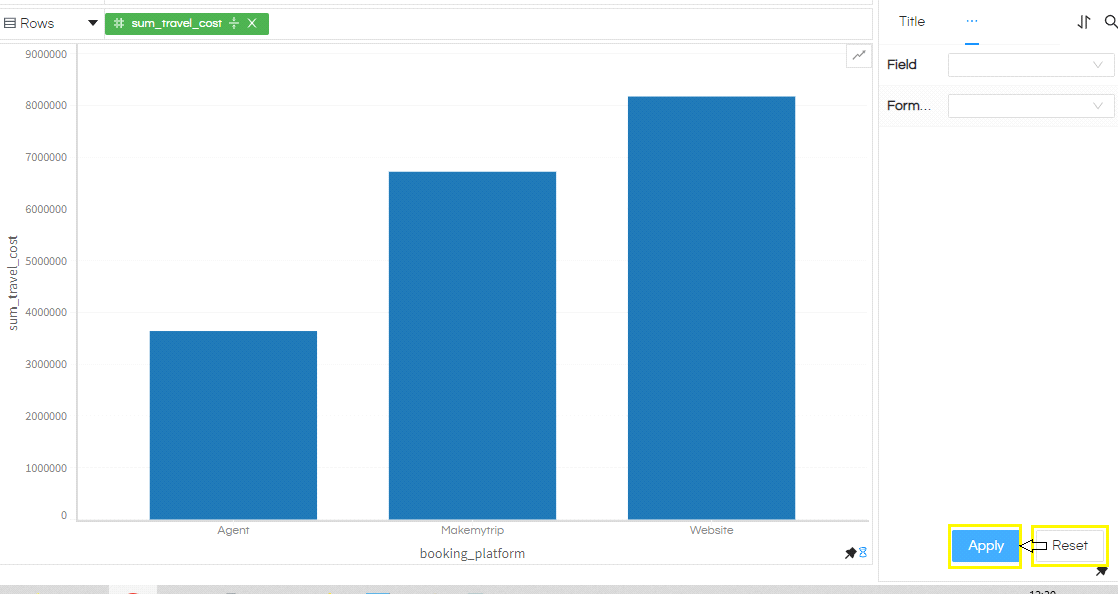
NOTE: If your data points is having “NULL” value then the color might not work properly. Also these color options works for Table, Crosstab, GridChart and “More Charts”.
Table and Cross Tab : Heatmap and Background color control
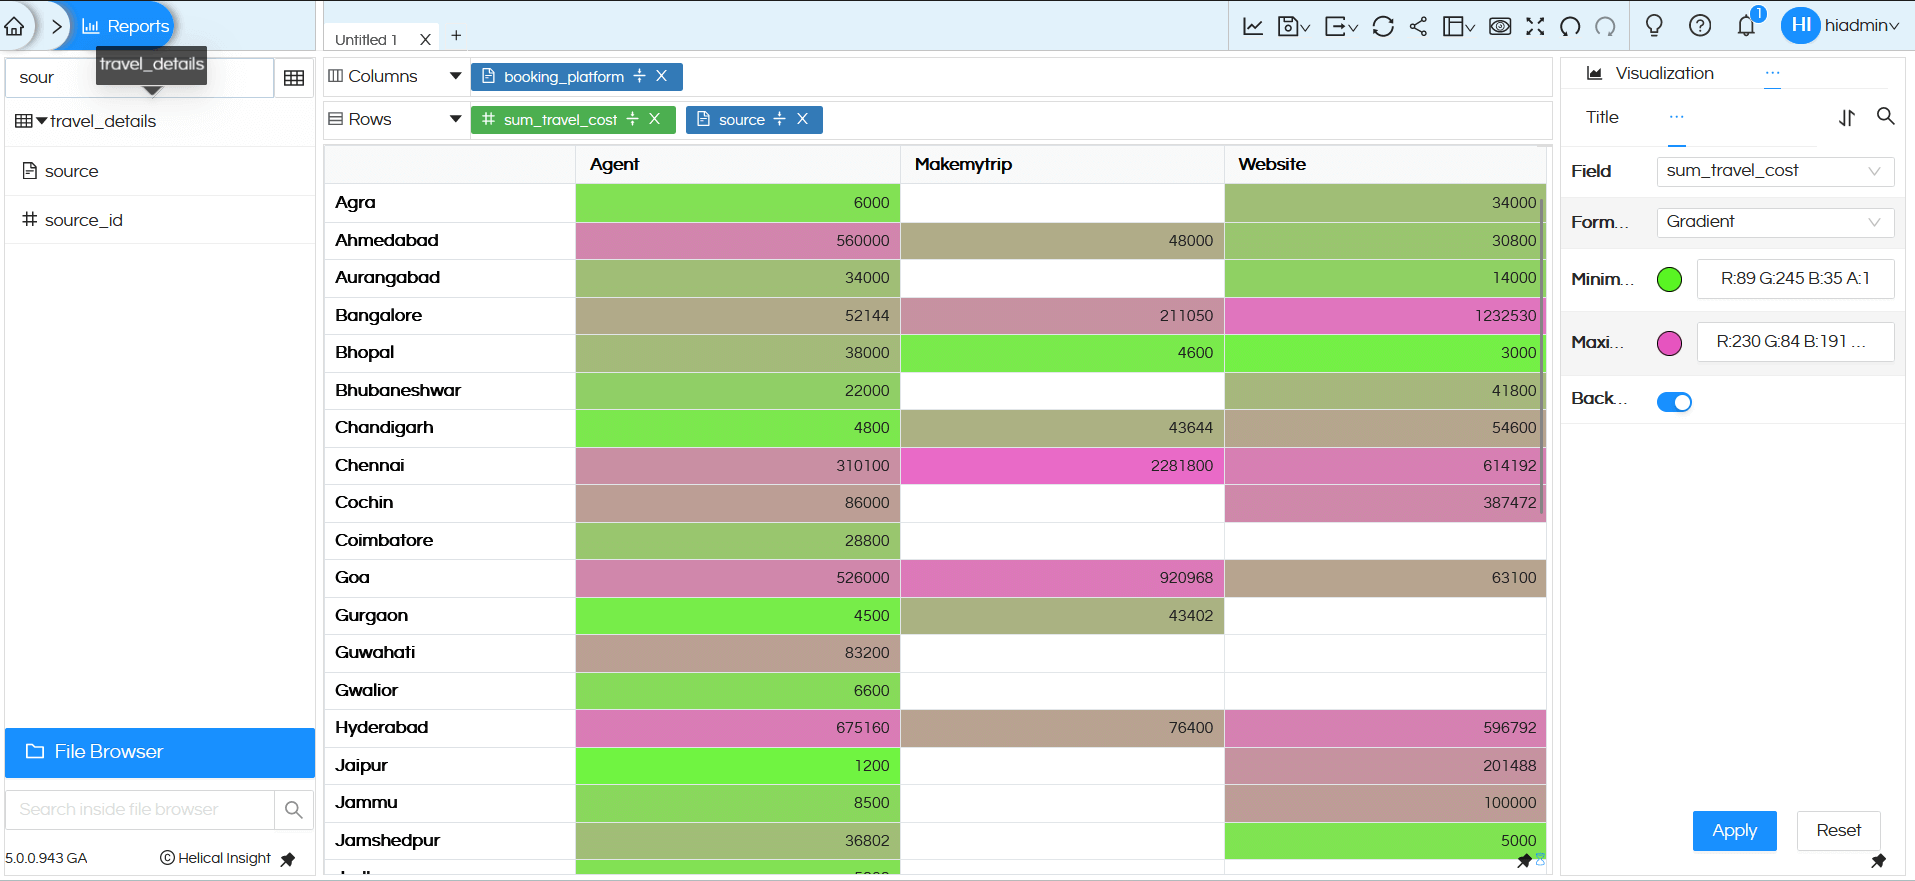
If you happen to use the color properties in case of table or cross tab visualiztion, you can change the the values as well as background color also based on certain conditions. These can even allow you to create sort of heatmap as well.
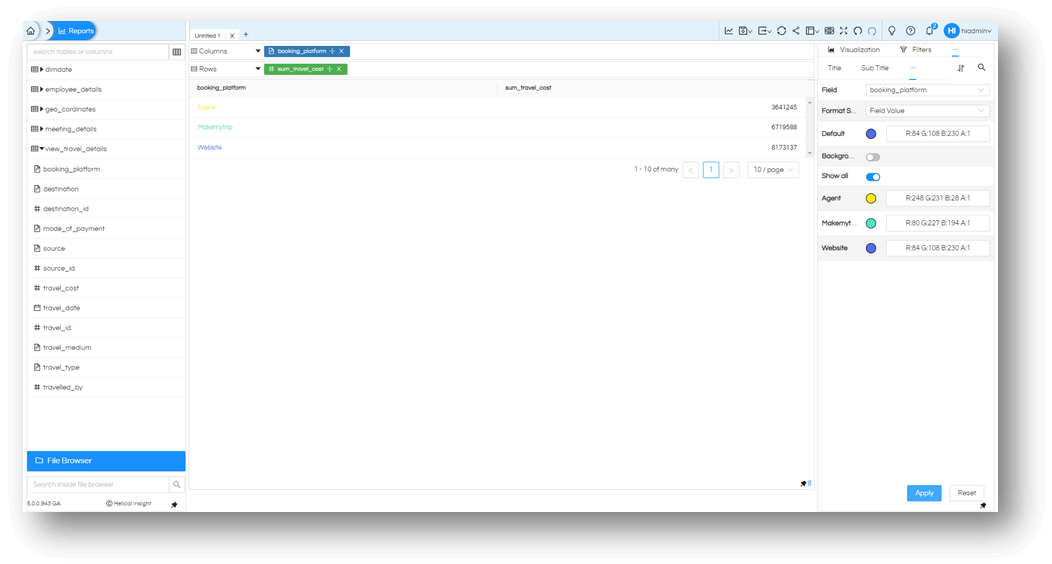
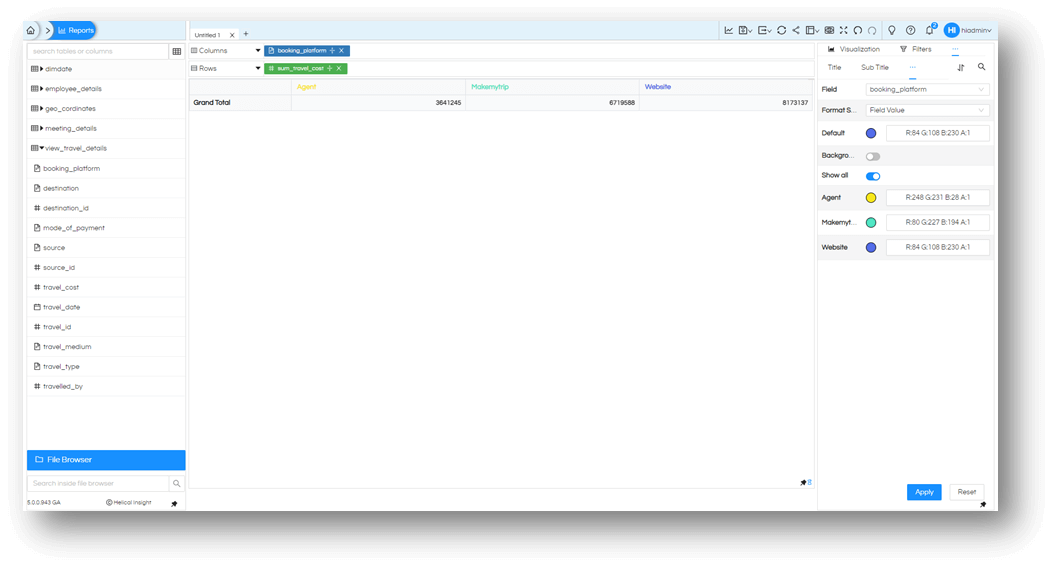
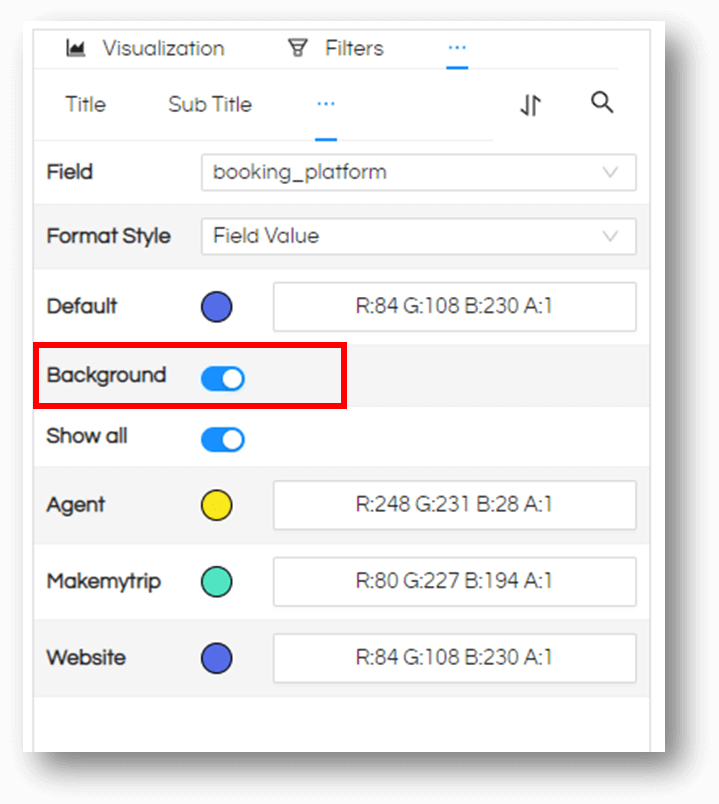
There is an option to change the color of the cell (i.e. background color) instead of changing the color of the value. All you need is to enable the Background slider. You can always hover over it and see more information about it.
And your changes will now work for the cell properties in the background of values instead of the value itself.
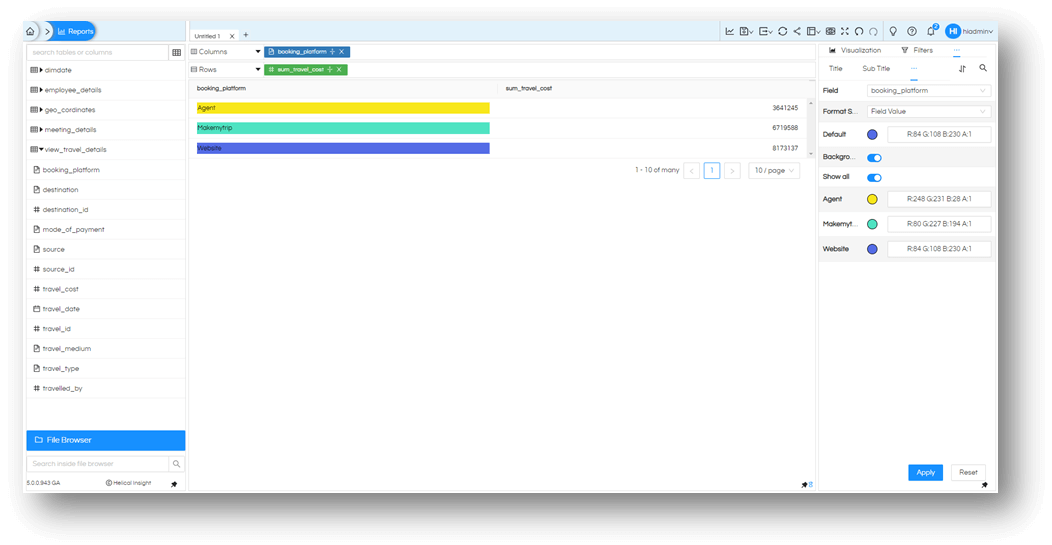
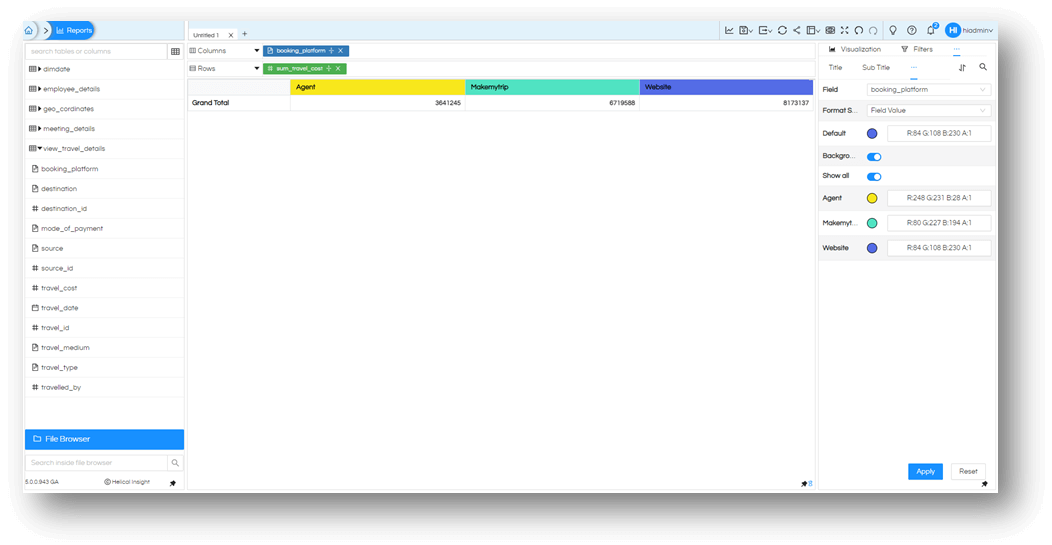
Note: This feature can be applied only to one field as of now. If you make changes to the other field, the first field will lose its changes.
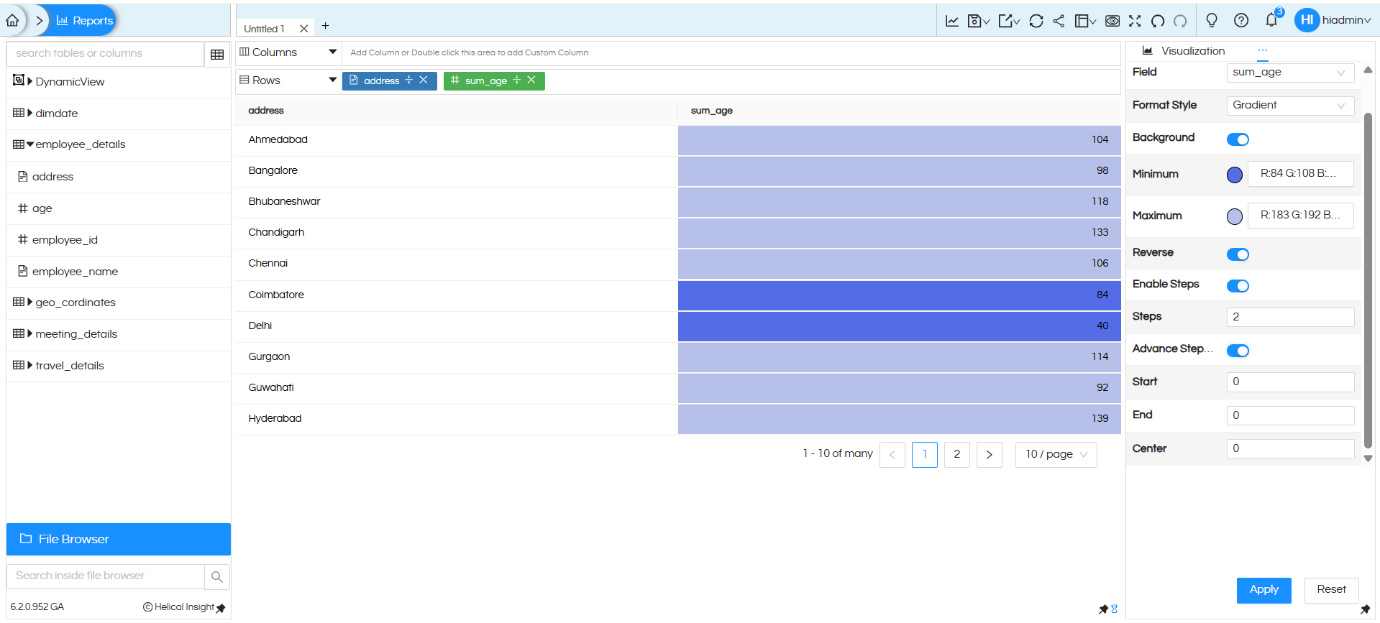
Additional Gradient Options (Available in Helical Insight 6.2.0.954)
From version 6.2 onwards, a few more options have been added which we have explained below.
When the Gradient format style is selected, additional configuration options are available to enhance color control:
-
Reverse:
This option reverses the gradient color range. The minimum color becomes maximum and vice versa. -
Enable Steps:
This divides the gradient into equal color steps instead of a continuous range.Note: Applicable only for numeric fields (i.e. which are in green color) and not applicable for dimensions (which are blue in color).
-
Steps:
When a color gradient is defined between minimum to maximum, this steps defined the number of color divisions between this gradient.By default earlier between the minimum value and maximum value the application automatically assigns the color dynamically.
However with this steps option, we can specify how many intermediate colors can be there between minimum and maximum and accordingly those colors gets assigned to the charts.
Minimum value required is 2.
-
Advance Step Options:
Enables manual control over the gradient range:- Start: Defines the starting value of the color range
- End: Defines the ending value
- Center: Defines the midpoint where the gradient is split into equal steps