Introduction: In this blog we are going to explain how to create a bar chart which represents the Source wise Cost of Travel with a filter based on Journey_type (multi-select). Please make sure you have gone through the blog “Introduction to Community Reporting Interface”

Steps to Creating Bar chart (Axis chart) with Multi Select Parameter in Helical Insight Community Reporting

  1. Data Source
  2. Dashboard Layout
  3. Parameter
  4. Report

1. Data source:

Create data source connection.

Here we are using connection type: plain JDBC

data source

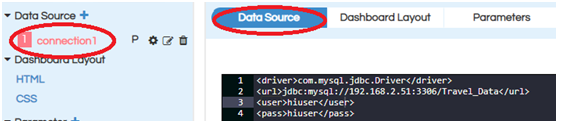
In the configuration of data source, provide the details as shown below.

<driver>com.mysql.jdbc.Driver</driver>   // sql driver 
<url>jdbc:mysql://192.168.2.51:3306/Travel_Data</url>  // jdbc url
<user>hiuser</user>  // database username
<pass>hiuser</pass>  // database password

Note: You can use any other kind of data source connection details. Rest of the steps are remaining the same.

2. Dashboard Layout:

In the dashboard layout we basically specify the layout of the report, dashboards, input parameters which we are creating. All the divs are specified here within which they get rendered.

Here we are creating 2 divs: client_name, client_wise

Input Parameters div is: client_name

Report div is: client_wise

When you click on dashboard layout a layout similar to below will appear:

Dashboard Layout

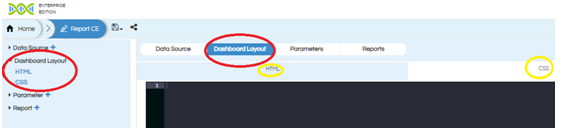
In the above screenshot we find two options (left side)

HTML and CSS.

If you click on HTML/CSS the place holder for the respective component will be displayed and highlighted in the Dashboard layout panel.

We can place the code related to layout in HTML and styling in CSS.

Dashboard layout:

HTML:

<div class = "col-sm-4 col-md-4 col-xs-4" id="client_name">Travel Type</div>
<div id="client_wise"></div>

CSS:

In CSS place holder we can add the CSS related to Bar chart customization as well as report customization like back-ground color, report border, border-radius, color, etc.

3. Parameters :

Parameters are used to filter the report data. These parameters can be single select, multiple select, date range, slider, date picker, etc. We can create multiple parameters for the single report/dashboard.

When you click on the add button, the parameter is created with default name parameter1.

parameters

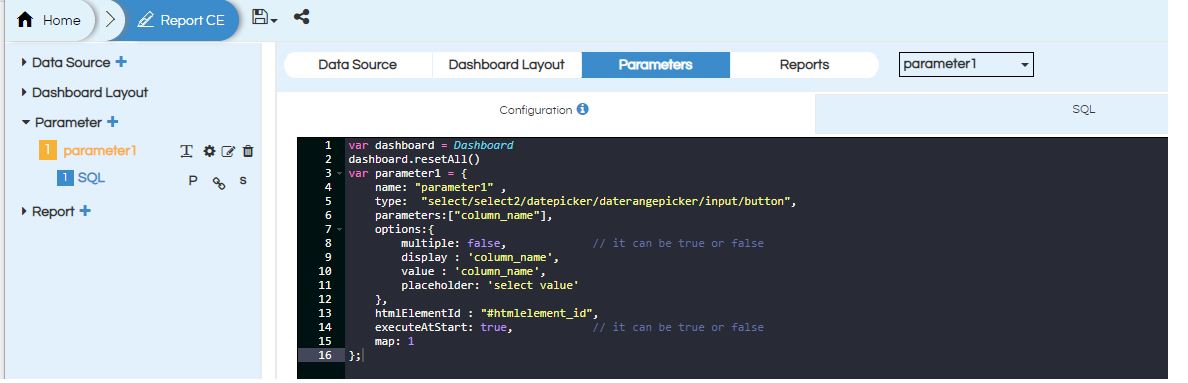
Click on “Pencil” icon and then rename the parameter as “Journey_Type”. We should place the code for Parameter configuration, parameter query in their respective place holders.

Click on apply button to save all the configurations.

In this sample we are creating parameter is “Multi-Select”

See the below screenshot for the configuration of this parameter.

Multi-Select Parameters

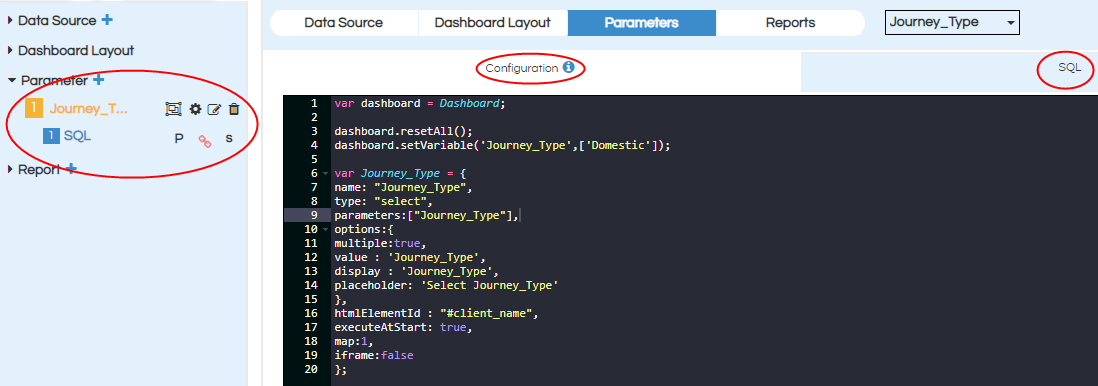
A.Journey_Type: (Multi-select)

Choose connection as “connection1”(previously created in data sources)

Here “Journey_Type” is a Multi-select input control, so we need to choose input type as “Collection” as shown in below image. By default it is always “String”.

Journey_Type Parameter

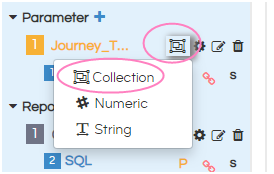
Note: For all multi-select parameters we should select “Collection” irrespective of parameter datatype. If it is a single select parameter we choose the type based on the datatype of parameters.

Configuration:

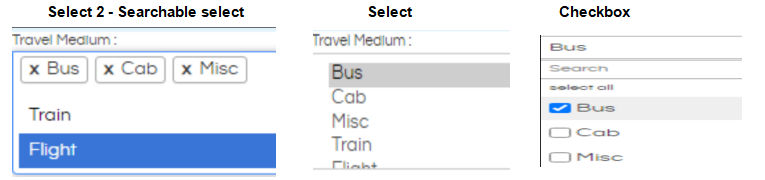
For multi-select parameters, you can either select parameter type as Select or Select2 or Checkbox. At the output level, you will see that the different parameter type gives different type of input parameter view.

checkbox

var dashboard = Dashboard;

dashboard.resetAll();
dashboard.setVariable('Journey_Type',['Domestic']);

var Journey_Type = {
name: "Journey_Type",
type: "select",
parameters:["Journey_Type"],
options:{
multiple:true,
value : 'Journey_Type',
display : 'Journey_Type',
placeholder: 'Select Journey_Type'
},
htmlElementId : "#client_name",
executeAtStart: true,
map:1,
iframe:false
};
SQL :

select distinct Journey_Type as Journey_Type FROM  `Travel_Data`.`Traval`

Note: If you do not have any parameters please make sure that you will have to add below code in the “Report” configuration.

var dashboard = Dashboard
dashboard.resetAll();

Report Configuration

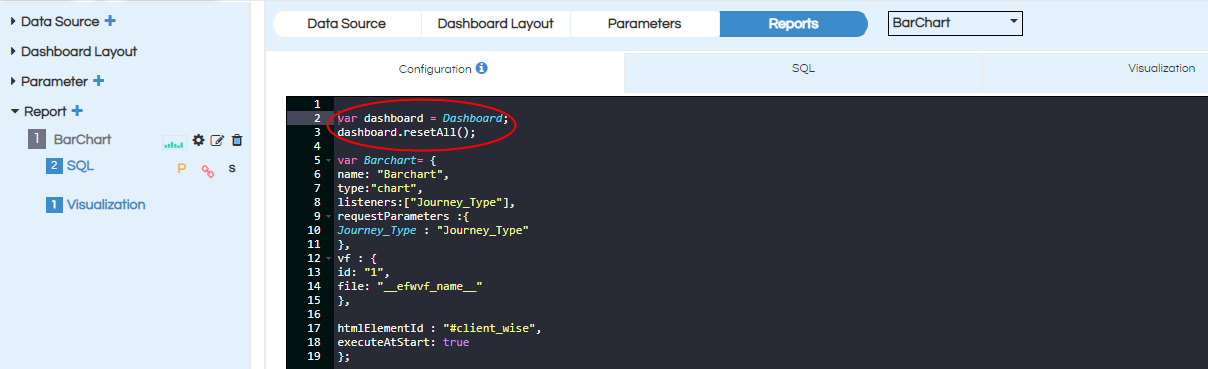
In case if you delete the first parameter then also you need to provide the above code in “Report” configuration.

Note: The configuration script is added only for the first parameter. For all the remaining parameters, this script should be copied and repeated with the necessary changes.

4. Report:

We can configure different visualizations to render in different divs in the dashboard layout by clicking on add report button (see the screenshot)

Reports

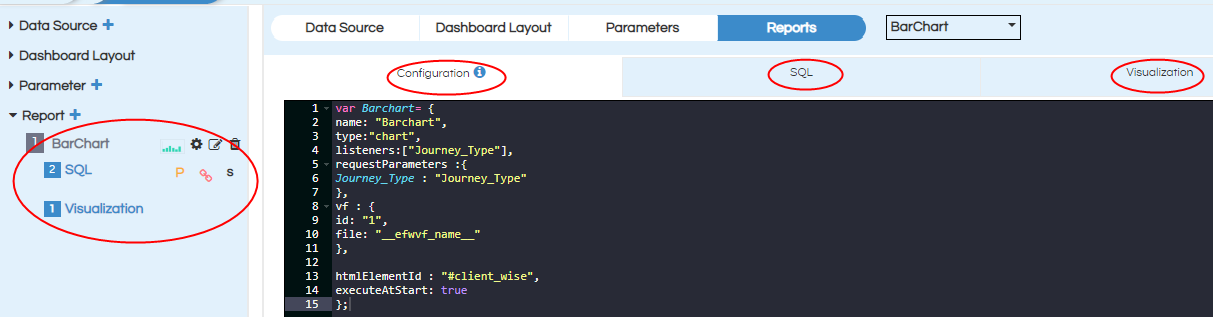
In the left panel, we find the report, SQL, Visualization related options.

Click on configure, On the right side we can see the place holders for report configuration, SQL, Visualization. Place the respective code apply click on apply.

Here we need to choose chart type as “Bar chart”, connection as “connection1” and parameter (Journey_Type).

Report Configuration: 
var Barchart= {
name: "Barchart",
type:"chart",
listeners:["Journey_Type"],
requestParameters :{
Journey_Type : "Journey_Type"
},
vf : {
id: "1",
file: "__efwvf_name__"
},

htmlElementId : "#client_wise",
executeAtStart: true
};
SQL :

	select 
		`Travel_Data`.`Traval`.`source` as `source`,
		sum(cost) as cost  
		from
		`Travel_Data`.`Traval` 
		where Journey_Type = ${Journey_Type} 
		group by
		`source` limit 10

Visualization :

<Dimensions>source</Dimensions>
<Measures>cost</Measures>

Note: After placing the configuration, SQL, Visualization then click on apply or (control+s)

After completing all the steps save the community edition report.

In the back end server location the following files will be generated:

  1. Efw (report view in the front end)
  2. Efwce (editable file in the front end)
  3. Efwvf
  4. Html
  5. Efwd

In the front end file browser, you will see the efw and efwce files as shown below

Front End File Browser

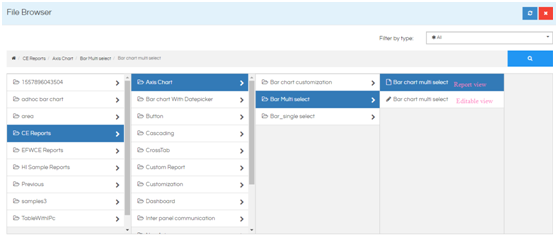
You can double click on the read mode report view file (with the extension EFW) and it will open like below.

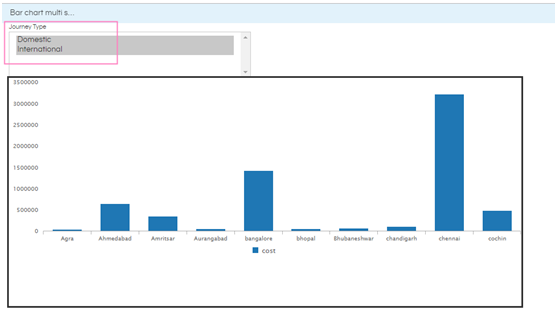
Bar chart with multi-select parameter Report View:

Bar Chart with Multi Select Parameters

For more details on EFWCE reporting refer the documentation :

EFWCE method of reporting in Helical Insight

For further assistance, kindly contact us on support@helicalinsight.com or post your queries at Helical Insight Forum

Helical Insight’s self-service capabilities is one to reckon with. It allows you to simply drag and drop columns, add filters, apply aggregate functions if required, and create reports and dashboards on the fly. For advanced users, the self-service component has ability to add javascript, HTML, HTML5, CSS, CSS3 and AJAX. These customizations allow you to create dynamic reports and dashboards. You can also add new charts inside the self-service component, add new kind of aggregate functions and customize it using our APIs.
Helical Insight, via simple browser based interface of Canned Reporting module, also allows to create pixel perfect printer friendly document kind of reports also like Invoice, P&L Statement, Balance sheet etc.
If you have a product, built on any platform like Dot Net or Java or PHP or Ruby, you can easily embed Helical Insight within it using iFrames or webservices, for quick value add through instant visualization of data.
Being a 100% browser-based BI tool, you can connect with your database and analyse across any location and device. There is no need to download or install heavy memory-consuming developer tools – All you need is a Browser application! We are battle-tested on most of the commonly used browsers.
We have organization level security where the Superadmin can create, delete and modify roles. Dashboards and reports can be added to that organization. This ensures multitenancy.
A first-of-its-kind Open-Source BI framework, Helical Insight is completely API-driven. This allows you to add functionalities, including but not limited to adding a new exporting type, new datasource type, core functionality expansion, new charting in adhoc etc., at any place whenever you wish, using your own in-house developers.
It handles huge volumes of data effectively. Caching, Pagination, Load-Balancing and In-Memory not only provides you with amazing experience, but also and does not burden the database server more than required. Further effective use of computing power gives best performance and complex calculations even on the big data even with smaller machines for your personal use. Filtering, Sorting, Cube Analysis, Inter Panel Communication on the dashboards all at lightning speed. Thereby, making best open-source Business Intelligence solution in the market.
With advance NLP algorithm, business users simply ask questions like, “show me sales of last quarter”, “average monthly sales of my products”. Let the application give the power to users without knowledge of query language or underlying data architecture
Our application is compatible with almost all databases, be it RDBMS, or columnar database, or even flat files like spreadsheets or csv files. You can even connect to your own custom database via JDBC connection. Further, our database connection can be switched dynamically based on logged in users or its organization or other parameters. So, all your clients can use the same reports and dashboards without worrying about any data security breech.
Our application can be installed on an in-house server where you have full control of your data and its security. Or on cloud where it is accessible to larger audience without overheads and maintenance of the servers. One solution that works for all.
Different companies have different business processes that the existing BI tools do not encompass. Helical Insight permits you to design your own workflows and specify what functional module of BI gets triggered