In this blog, we are going to see how to apply filter at dashboard level and various settings related to filter present on the dashboard.
There are 2 ways to apply filter at dashboard level.
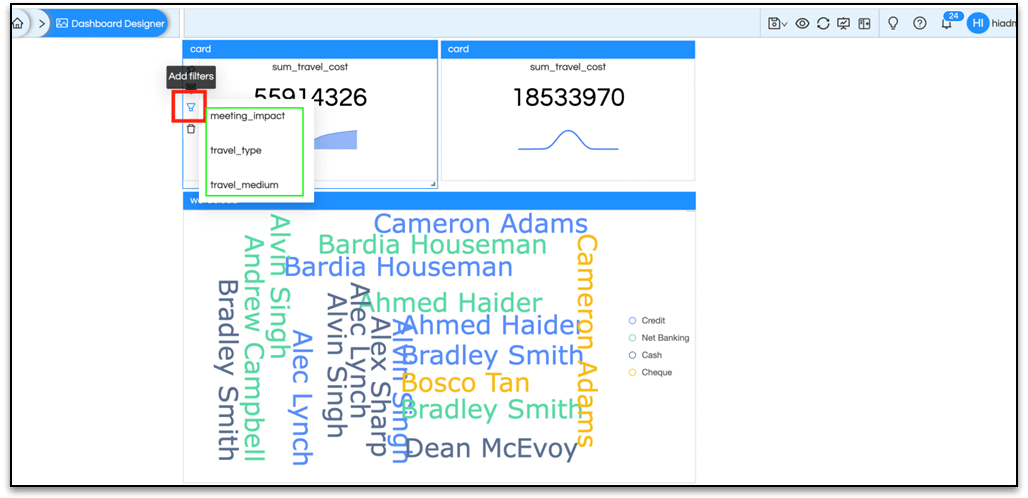
- Select the Filter icon on left side of report and you will see the filters related to that report. When u select any of the filters it will be added to the filter pane.
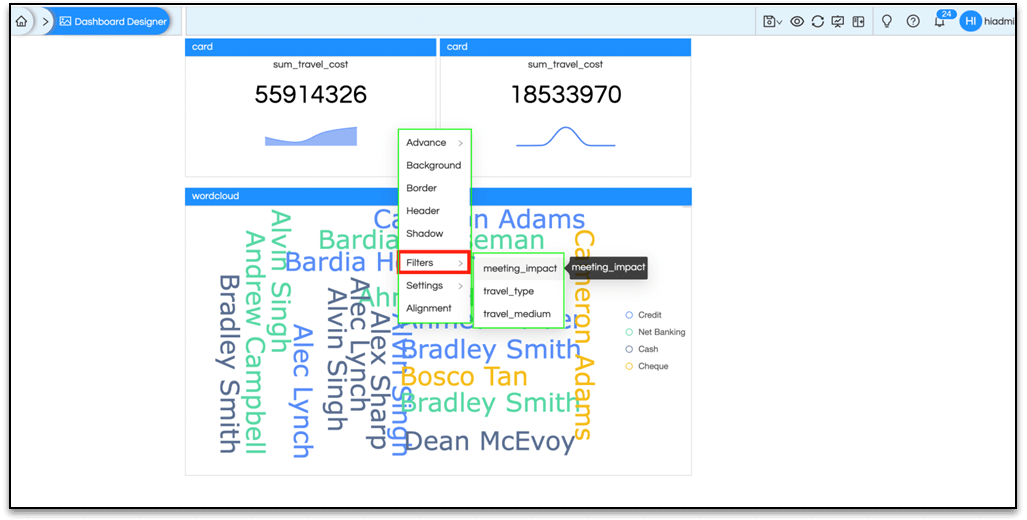
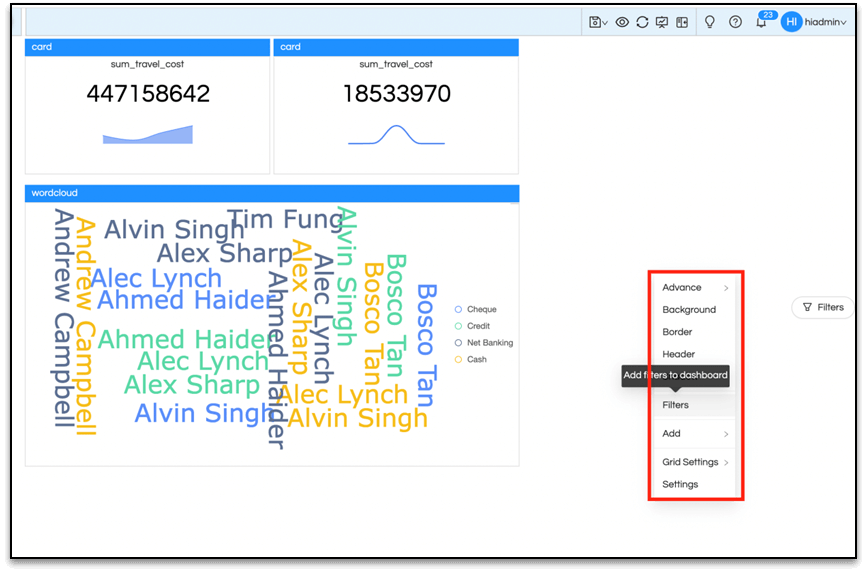
- Another method is to right click on the component. From the context menu select Filters and it will show the filters related to that report. Select the filter that you want to be added to the dashboard.
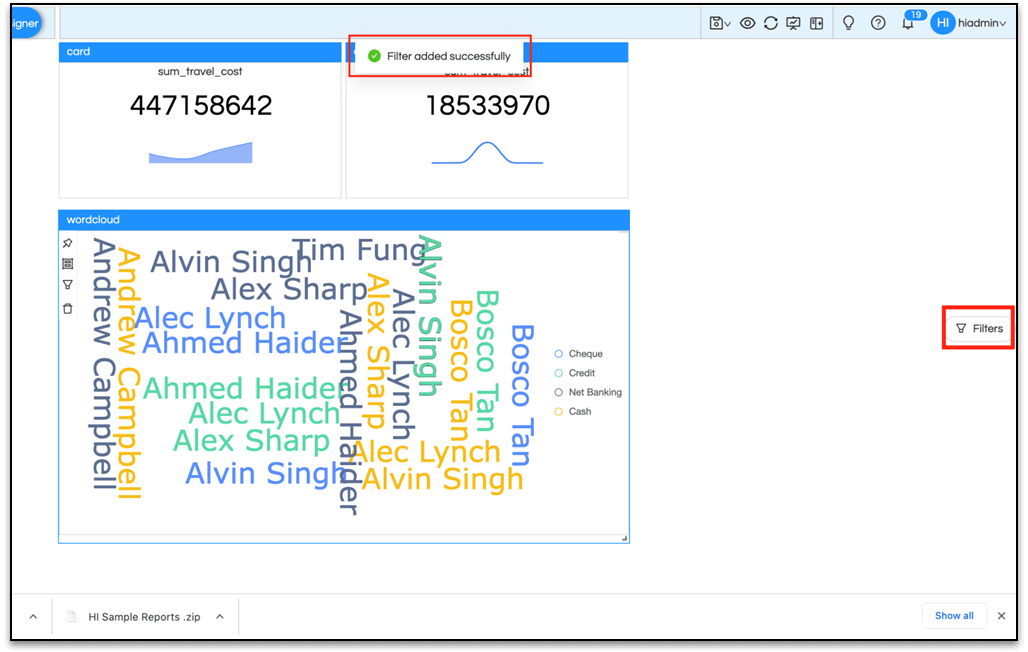
A notification will appear at the top showing that the filter had been added successfully as shown in the image below. Even though we added the filter from a single report, any other report present in the dashboard which has the same filter applied while designing the report, it will be able to listen and respond to it.
Now where is this filter getting added?
In the above image on the right side, in the middle, you will see Filters as highlighted. When you click on this, a filters pane will draw out as in the image below. This filter pane will show all filters added to the dashboard using any of the above 2 methods.
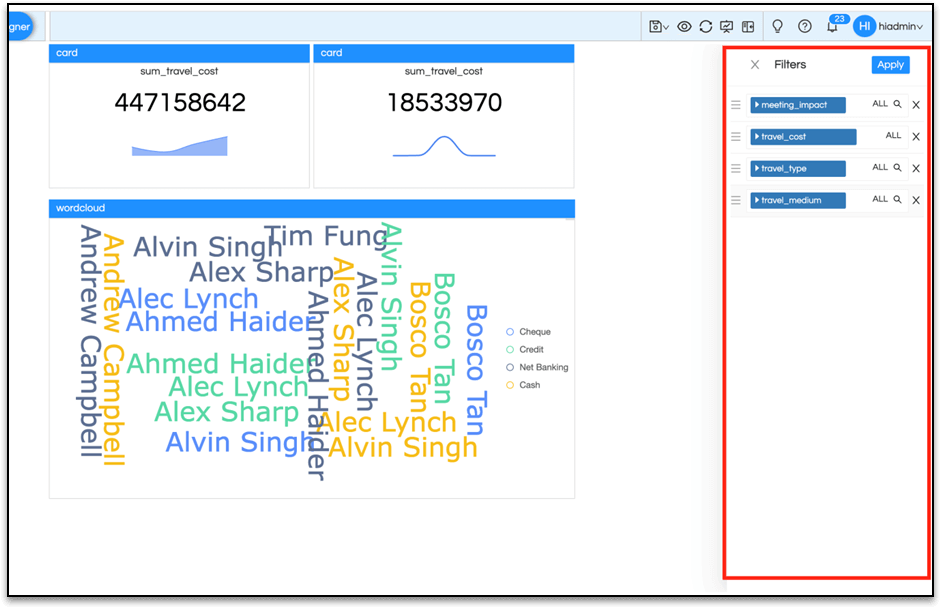
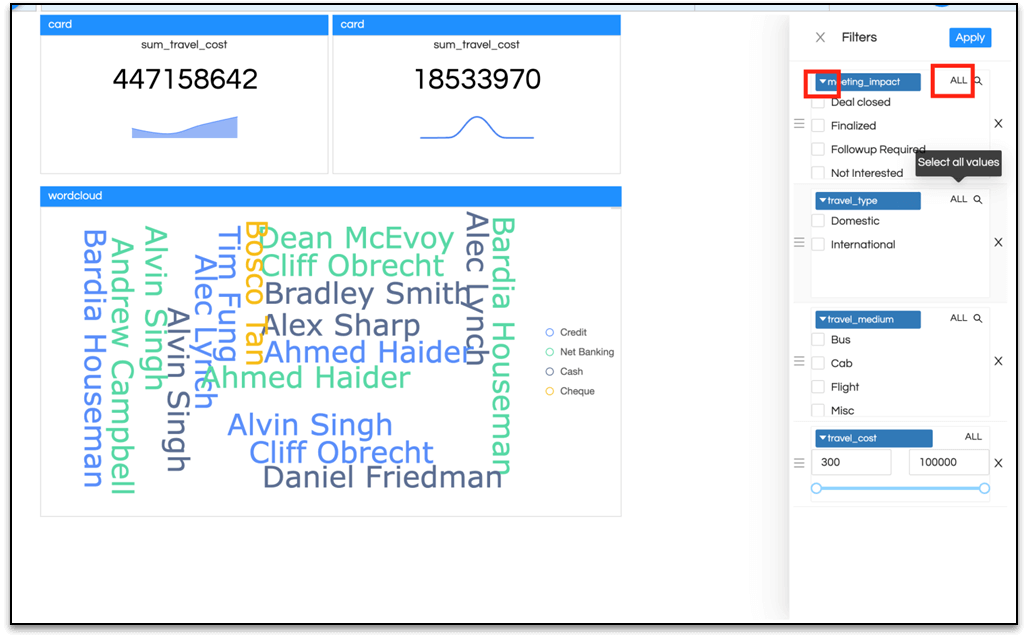
The triangles in front of filter names have been selected to show the filter values. By default all the filters have the setting ALL i.e, no filters are applied on the reports. If you select any filter value, then the reports listening to those filters will be updated on the dashboard.
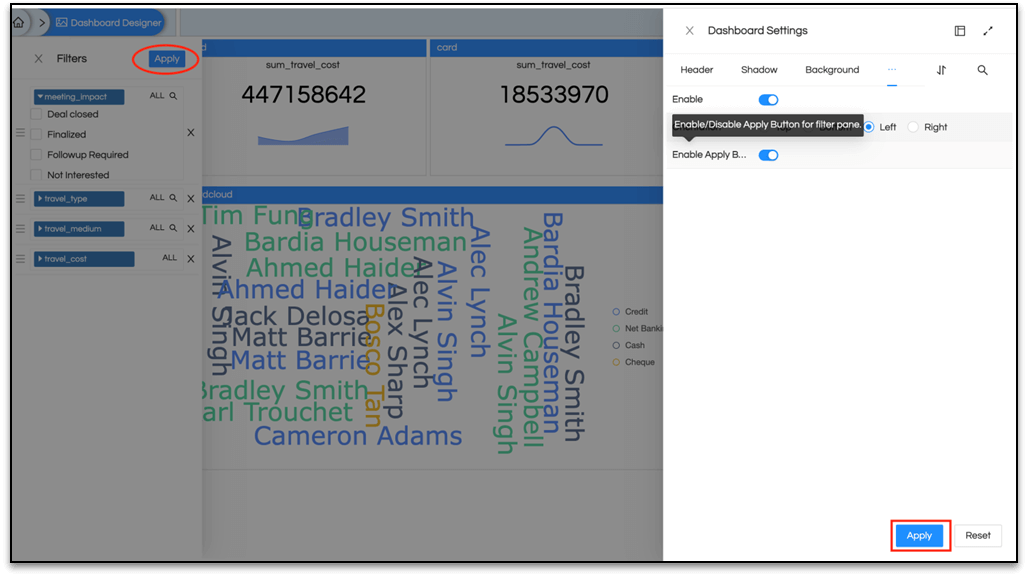
There are a lot of configuration and setting options which area present at the dashboard designer level related to filters. Right-click on the empty space in dashboard. From the resulting context menu, select Filters. A dashboard settings panel for filters will be seen on the right.
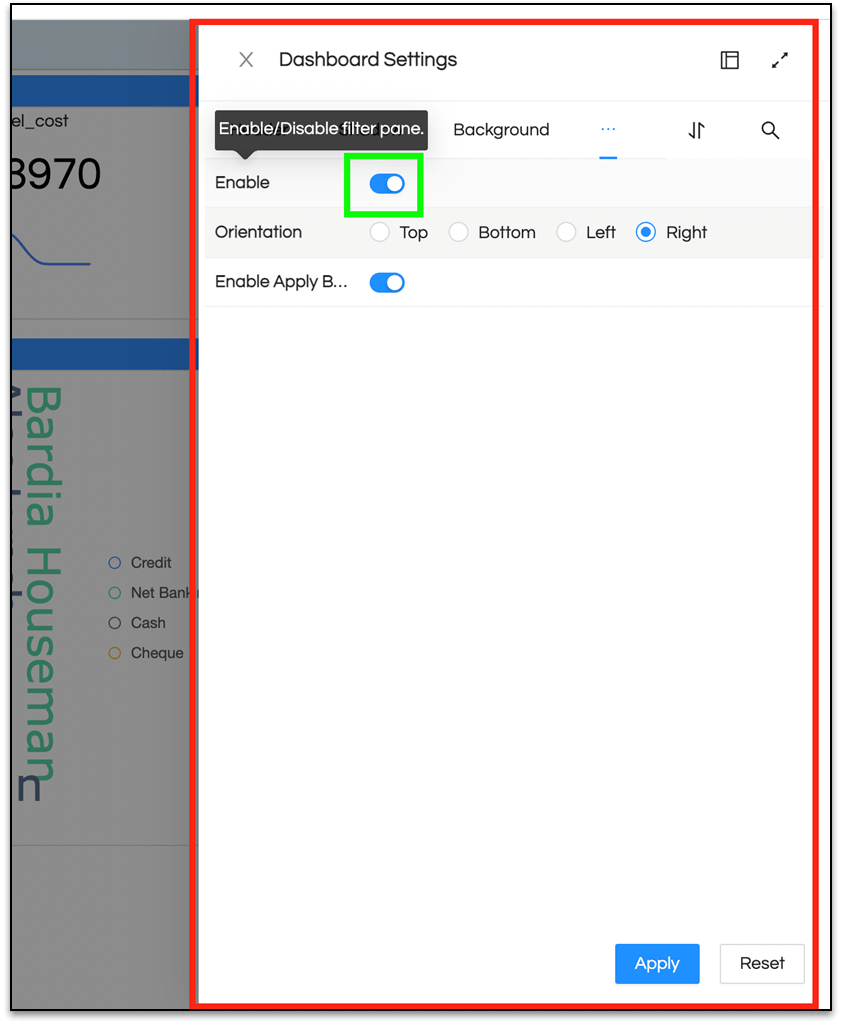
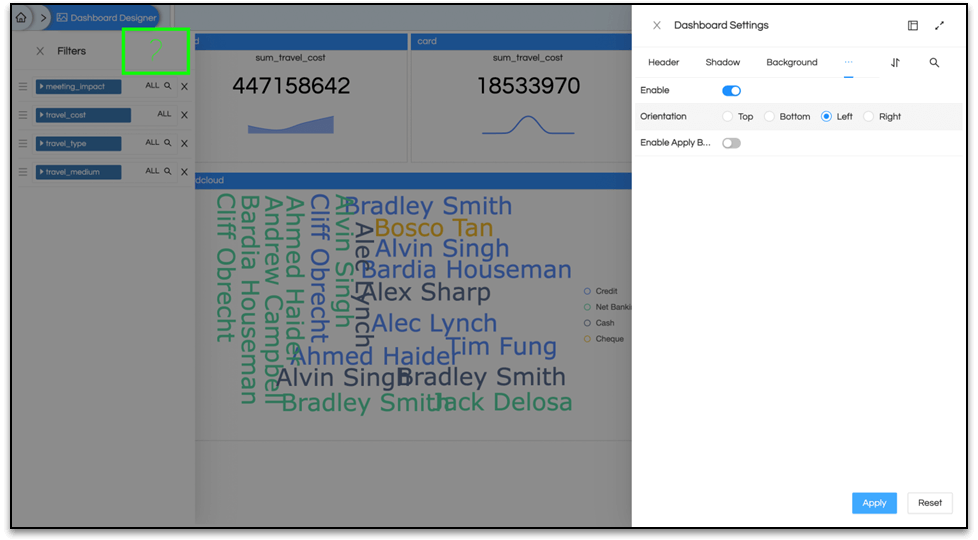
The first Enable button will enable the filter pane on the dashboard. If you disable it, then the filter icon highlighted in image 3 also disappears and you will not be able to get the results for selective filtered values.
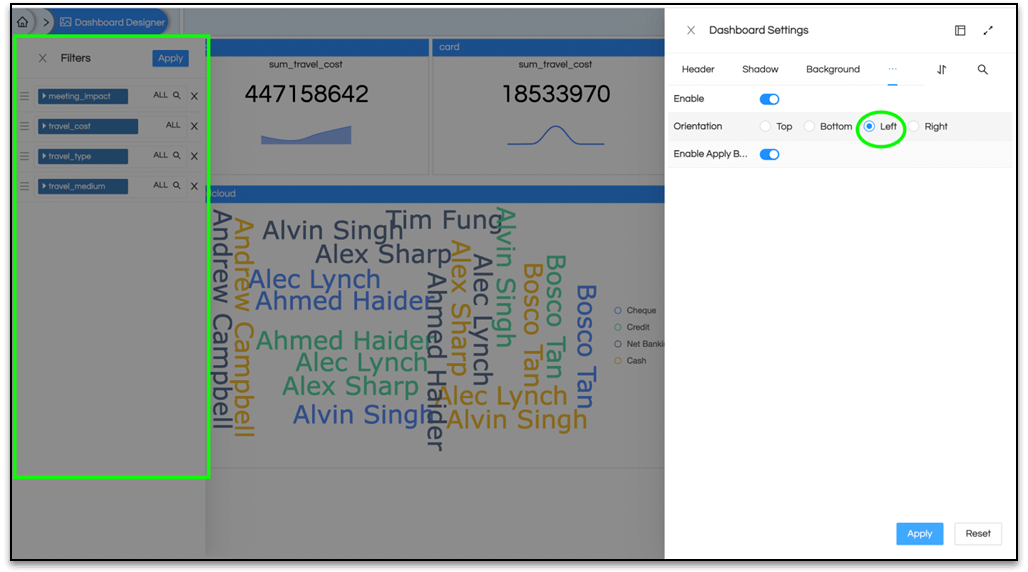
Orientation will orient the filter to the selected place on dashboard. In the setting below the filter pane can be seen on the left side.
The third setting for filter pane is Enabling/Disabling Apply Button for filter pane.
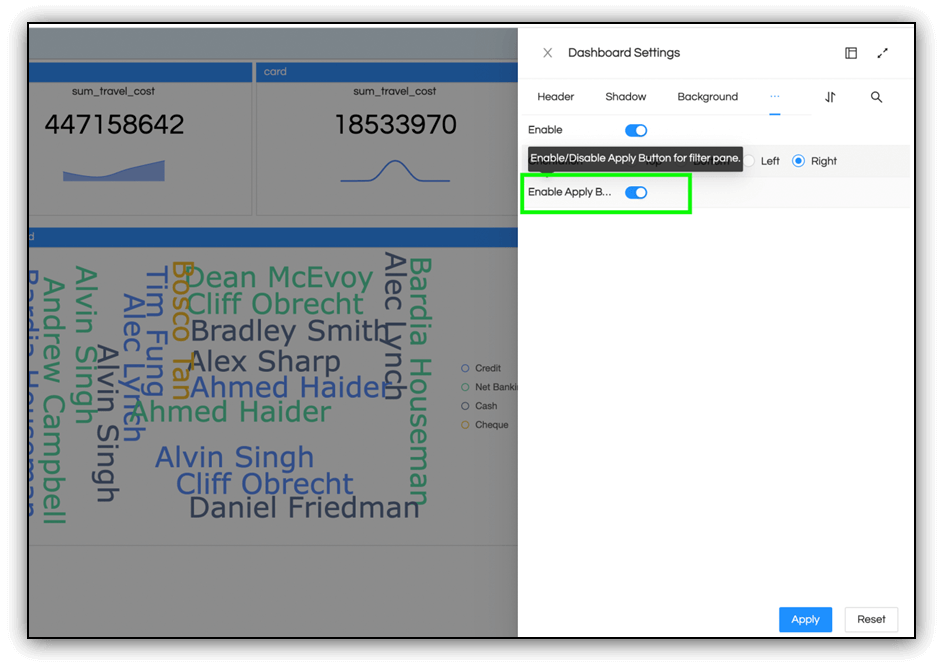
If this button is disabled, then the Apply button on top of the filter pane will disappear as shown here in the image below. So disabling this button will still update the reports whenever a filter value will be selected but it will now update without a confirmation. This is not a good practice as it will generate unnecessary long SQL. So it is advisable to Enable this button.
Note: Whenever a setting is applied on the dashboard, it will be executed only when we select the Apply button from bottom.