
Tableau has become a familiar business intelligence tool for organizations that rely on interactive dashboards, data visualization and self-service analytics. But as BI usage expands across departments, applications and customers, some organizations are beginning to reconsider the cost and flexibility of their existing setup.
The questions are practical. Can licensing costs be reduced? Is it possible to retain a familiar analytics experience without rebuilding every report from scratch? Can AI-powered analytics run with an organization's preferred language model? And can dashboards, operational reports and embedded analytics be managed through a single platform?
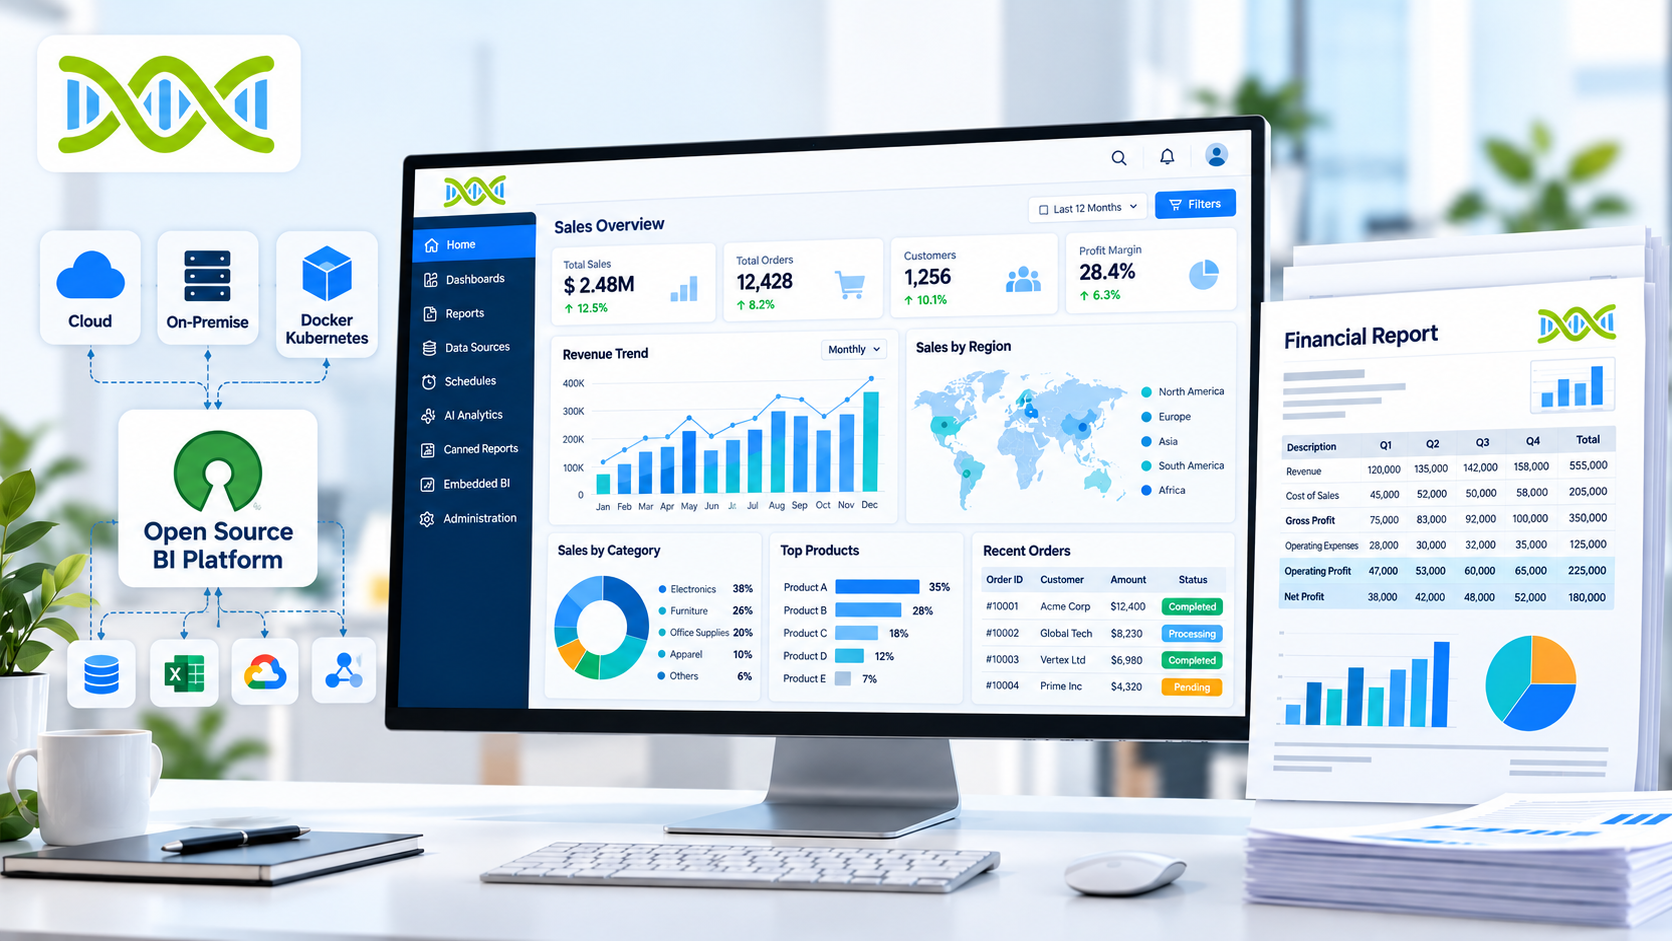
Helical Insight is a free, open-source business intelligence platform worth evaluating for organizations looking for a Tableau alternative. It combines interactive dashboards, self-service analytics, AI-powered conversational analytics, embedded BI and pixel-perfect reporting, with options for self-hosted deployment.
Here is a closer look at what matters when evaluating a move away from Tableau and how Helical Insight approaches these requirements.
Why are organizations looking for a Tableau alternative?
1. BI licensing costs can grow with usage
A BI deployment that begins with a small group of analysts can eventually reach hundreds or thousands of users. Different user roles, advanced capabilities, embedding requirements and deployment choices can all affect the overall cost.
For organizations that want to make analytics available to more employees or offer dashboards inside their own software products, licensing becomes an important part of the long-term decision.
Tableau offers several licensing and deployment options, including Tableau Cloud. However, organizations should assess the full cost of their particular deployment rather than looking at a single per-user price.
For businesses that want to expand analytics access without tying software licensing directly to every additional user, a free, open-source BI platform can be an attractive alternative.
2. Cloud strategy is not the same for every organization
Tableau Cloud provides a managed service, which can reduce the infrastructure and maintenance work associated with running BI software. For many organizations, that is an advantage.
Others prefer to retain control over their deployment environment, data access and upgrade schedule. Regulatory requirements, existing infrastructure, internal security policies and cloud strategy can all influence that decision.
A self-hosted alternative provides another option for organizations that want to operate their BI environment on their own infrastructure or within a chosen cloud environment.
The important consideration is not whether cloud or self-hosting is universally better. It is whether the deployment model fits the organization's needs.
3. Migration involves more than replacing a dashboard designer
Tableau users have often invested considerable time in dashboards, calculated fields, filters, data models and reporting workflows. Replacing the platform means considering all of these dependencies, not just recreating charts.
A migration project must also account for user permissions, scheduled reports, embedded dashboards, data connections and the experience of business users who rely on existing reports.
This is one reason organizations look for alternatives that provide familiar analytical interactions and practical migration assistance.
What about other open-source BI tools?
There are several established open-source and community-driven BI platforms. Tools such as Apache Superset, Metabase and Redash may be suitable for particular dashboarding and analytics requirements.
However, the term open source does not automatically mean that every capability an organization needs is included in the freely available edition.
Depending on the product, deployment and edition, organizations may need to evaluate additional licensing for advanced embedding, enterprise authentication, multi-tenancy, AI capabilities or commercial support. Some requirements may also involve integrating separate reporting tools or building custom functionality.
This does not make those platforms unsuitable. It simply means that a comparison should consider the complete requirements rather than just the availability of a free download.
For example, an organization that needs interactive dashboards, AI-assisted analysis, embedded analytics and print-ready financial reports has a different set of requirements from a team that needs only internal dashboards.
That is where a unified BI platform becomes relevant.
Meet Helical Insight: A free, open-source alternative to Tableau
Helical Insight is an open-source business intelligence and embedded analytics platform developed by Helical IT Solutions.
Its feature set includes interactive dashboards, self-service report creation, advanced filtering, drill-down analysis, AI-powered conversational analytics, embedded BI and a dedicated canned-reporting module.
The platform is also designed to be customizable, with integration and deployment options for organizations that need to incorporate analytics into their existing applications and infrastructure.
According to its official Community Edition page, Helical Insight makes its full feature set available in the free Community Edition, with commercial support and branding as the principal differences from the Enterprise Edition. Organizations should review the current licensing terms and distribution requirements before deployment.
For Tableau users, the interesting part is not simply that Helical Insight is open source. It is that several familiar analytical workflows are available alongside capabilities for reporting, AI and embedded applications.
Which Helical Insight features are similar to Tableau?
The Helical Insight article on Tableau alternatives describes a number of feature similarities. The following are particularly relevant when evaluating the user experience and migration requirements.
1. Grid charts
Grid-based visualizations allow users to arrange data across rows and columns, with charts displayed within the resulting layout.
Helical Insight supports grid-chart configurations in which different visualizations can be organized around selected dimensions and measures. This is useful when a single chart is not sufficient to compare several categories or business segments.
For example, a sales team could examine product performance across regions, with individual chart cells displaying trends or comparisons for each segment.
2. Marks options for visual analysis
Tableau users are familiar with the Marks card, which provides control over how data is represented within a visualization.
Helical Insight offers comparable analytical customization through options such as color, size, shape, labels, tooltips and detail, depending on the visualization.
These options allow users to communicate additional information without creating a separate chart for every measure or category.
For example, a sales chart might use color to distinguish product categories, labels to display revenue and tooltips to expose additional details when a user examines a data point.
The specific configuration and interaction model differ between products, but the underlying analytical objective is similar: make visualizations more informative and interactive.
3. Drill-down and drill-through
A dashboard often answers the first question but not the next one.
A manager might see that sales have fallen and then want to identify the affected region, city, product or customer segment. Drill-down and drill-through functionality help users investigate these questions without starting a new analysis from scratch.
Helical Insight supports hierarchical drill-down and drill-through workflows. Its filtering interactions also include options such as keeping selected values or excluding them from the analysis.
This makes it possible to move from a high-level KPI to a more detailed view of the underlying business data.
4. Cross-filtering and inter-panel communication
Dashboards are more useful when their visualizations work together.
Helical Insight's inter-panel communication functionality allows selections in one report or visualization to influence other panels in a dashboard, subject to the configured relationships.
For example, selecting a particular product category could help users examine associated sales, profitability and regional performance across the same dashboard.
This reduces the need to apply the same filters manually to multiple visualizations.
5. Advanced filtering and date-relative analysis
Business users rarely want to filter data only by selecting an item from a fixed dropdown.
They may need cascading filters, conditional filtering, date ranges, relative dates or options that change based on earlier selections.
Helical Insight supports advanced filtering configurations, including date-related options such as relative periods. Depending on the configuration, users can analyze periods such as the last seven days, the last 30 days or a selected quarter.
These capabilities are useful for operational dashboards, financial analysis and recurring business reviews.
6. Dashboards, data sources and visualization options
Helical Insight supports dashboard layouts that combine charts, tables, text and other report elements. It also supports a range of data connections and visualization options, with additional customization available through its extensible architecture.
For organizations evaluating a Tableau replacement, this means the assessment can extend beyond the appearance of individual charts to the broader requirements of data connectivity, dashboard interaction, integration and access control.
For a more detailed feature-by-feature overview, refer to the official Helical Insight versus Tableau feature article.
AI-powered BI with Bring Your Own LLM
AI is becoming an important consideration in business intelligence. Rather than requiring every business user to build a report manually, conversational analytics allows users to ask questions about their data in natural language.
Helical Insight provides an AI-powered module called Instant BI.
Users can ask questions about connected business data and receive results in formats such as charts and tables. This can help business users explore information without having to write SQL queries or understand every detail of the underlying data model.
Bring your own language model
One important feature is Bring Your Own LLM, or BYO-LLM.
Instead of being tied to a single AI provider, organizations can configure a supported language model according to their requirements. The choice of model, hosting arrangement and associated costs can therefore be considered as part of the organization's broader AI strategy.
Helical Insight also supports self-hosted deployment options. Where data residency and privacy are important, organizations can evaluate a deployment using their own infrastructure and an appropriately configured language model.
The exact data flow depends on the selected model and its deployment. Organizations should review the configuration and security documentation before connecting sensitive production data.
For more details, see the official Helical Insight Instant BI documentation.
This combination of conversational analytics and deployment flexibility is particularly relevant to organizations that want to explore AI without giving up control over their BI environment.
Tableau to Helical Insight migration: Reducing manual effort
One of the biggest concerns in any BI migration is the amount of rework involved.
Recreating every dashboard, rebuilding calculations and manually reproducing existing workflows can consume significant time. It can also introduce inconsistencies if different teams interpret the original reports differently.
Helical Insight's team offers automated utilities intended to assist with Tableau-to-Helical Insight migration and reduce repetitive manual work.
These utilities can be an important part of a migration plan, particularly when an organization has a large number of reports or dashboards to assess.
However, migration should begin with an inventory of the existing environment.
A practical assessment should identify:
- Existing Tableau workbooks, dashboards and reports.
- Data sources, custom SQL and calculated fields.
- Filters, hierarchies and drill-down workflows.
- User permissions, security rules and scheduled delivery.
- Embedded analytics and application integrations.
- Reports that require pixel-perfect or multi-page output.
Once the dependencies are understood, the migration team can determine which components can be handled by available utilities and which need manual adjustment or redesign.
The objective is to minimize migration rework while preserving the business logic and usability of existing reports.
Organizations considering a move should discuss their Tableau environment with the Helical Insight team to understand the available utilities, compatibility requirements and expected effort for their particular deployment.
Canned reporting: An important difference beyond dashboards
Interactive dashboards are excellent for exploring data. They are not always the right format for every business requirement.
Many organizations also produce documents that must follow a defined page layout, contain specific headers and footers, repeat column headings across pages, and display totals in a consistent format.
Examples include:
- Invoices and purchase orders.
- Bank and account statements.
- Salary slips.
- Profit-and-loss statements.
- Financial and compliance reports.
- Operational reports distributed to customers or management.
These are commonly referred to as canned reports or pixel-perfect paginated reports.
Why this matters when choosing a Tableau alternative
Tableau provides dashboards, visual analytics and reporting-related export capabilities. However, organizations that require highly formatted, multi-page business documents may need a separate reporting solution, depending on their specific requirements and existing Tableau setup.
That can mean maintaining separate tools for dashboards and document reporting, along with the associated templates, access controls and operational processes.
Helical Insight addresses this requirement with a dedicated Canned Reporting module. Its browser-based report designer supports the creation of formatted, multi-page documents with elements such as headers, footers, tables, calculations and images.
Reports can be designed for uses such as invoices, statements and financial documents, with export and distribution options available according to the configured report and product version.
For organizations that need both interactive dashboards and formal document reporting, having these capabilities within one BI platform can simplify the overall reporting architecture.
Read more about the Helical Insight Canned Reporting module.
Unified BI: Dashboards, AI and reporting in one platform
A BI environment often grows one requirement at a time.
A team starts with dashboards, adds scheduled reports, introduces embedded analytics, builds integrations and eventually explores AI-powered analysis. If each requirement leads to another tool, the organization must manage additional integrations, security models and operational processes.
Helical Insight takes a unified approach by bringing several of these capabilities together.
| Requirement | Helical Insight capability |
|---|---|
| Interactive analytics | Dashboards, charts, tables and filters |
| Self-service BI | Visual report and dashboard creation |
| AI-assisted analysis | Instant BI with BYO-LLM |
| Document reporting | Pixel-perfect, multi-page canned reports |
| Application integration | Embedded analytics and APIs |
| Access control | Role-based security and row-level controls |
| Deployment flexibility | Self-hosted and other supported deployment options |
| Report distribution | Exporting, scheduling and sharing capabilities |
The exact configuration will depend on the deployment, but the overall objective is straightforward: reduce the need to assemble a separate product for every BI requirement.
This is especially relevant for SaaS companies embedding analytics into their own products, enterprises standardizing their reporting stack, and organizations that want dashboards and formal reports to share a common BI environment.
Is Helical Insight the right Tableau alternative for your organization?
The answer depends on what you currently use Tableau for.
If the primary requirement is advanced visual exploration, compare the available chart types, analytical interactions, calculations and dashboard workflows with your existing workbooks.
If you are planning a migration, evaluate the available utilities against a representative sample of your dashboards and reports before estimating the effort for the full deployment.
If AI is a priority, test Instant BI with your preferred supported LLM and review how the integration handles permissions, data access and sensitive information.
If your business relies on formal documents, evaluate canned reporting with real examples such as financial statements, invoices or operational reports.
Also consider the practical aspects of deployment, maintenance, security, integrations and support. Open-source software can remove licensing costs without removing the need to operate and maintain a production BI environment.
The most useful comparison is one based on your actual workflows rather than a checklist of features alone.
Frequently asked questions
Is Helical Insight a free, open-source alternative to Tableau?
Helical Insight offers a free, open-source Community Edition. Its official Community Edition page states that the complete feature set is included, with commercial support and branding as the principal differences from the Enterprise Edition. Review the current release and licensing terms before adopting it.
Does Helical Insight have a UI similar to Tableau?
Helical Insight supports several familiar analytical workflows, including grid charts, visualization customization, drill-down, drill-through, filtering and interactive dashboards. Its interface is not identical to Tableau, so teams should evaluate the workflows that matter most to them.
Can I migrate from Tableau to Helical Insight?
Yes, a Tableau-to-Helical Insight migration can be planned around existing reports, data connections, calculations and dashboard requirements. The Helical Insight team offers automated migration utilities intended to reduce manual effort. The amount of automation and rework depends on the existing environment.
Does Helical Insight support AI analytics?
Yes. Its Instant BI module supports conversational analytics, allowing users to ask questions about connected data and receive analytical results. It also supports a Bring Your Own LLM approach using supported models.
Can Helical Insight run on our own servers?
Helical Insight supports self-hosted deployment options, including on-premises environments. The appropriate architecture depends on the organization's infrastructure, security requirements and chosen AI integration.
Does Helical Insight support pixel-perfect reporting?
Yes. Its Canned Reporting module is designed for formatted, multi-page documents such as invoices, financial statements, bank statements and other operational reports.
Why consider a unified BI platform instead of separate tools?
A unified BI platform can bring dashboards, self-service analytics, AI-assisted analysis, embedded BI and document reporting into a common environment. This can reduce tool sprawl and simplify integration, administration and reporting workflows.
Conclusion
For organizations reviewing their BI strategy, a Tableau alternative should offer more than lower licensing costs. It should provide the analytical workflows users need, a practical migration path and enough flexibility to support future requirements.
Helical Insight brings together a Tableau-like set of analytical interactions, AI-powered conversational analytics with BYO-LLM, migration assistance, embedded BI and pixel-perfect canned reporting in a free, open-source platform.
Its combination of dashboards and document reporting is particularly relevant for organizations that want to consolidate interactive analytics and formal business reporting.
The next step is to evaluate the platform using a representative set of your own reports, data sources and security requirements.
Explore Helical Insight: https://www.helicalinsight.com/
For organizations considering a Tableau migration, a discussion with the Helical Insight team can help establish which migration utilities are applicable and what a realistic migration plan would involve.
Community driven innovation via Helical Insight CE – Helical Insight
Compare Helical Insight Community and Enterprise Editions. Get every BI feature free forever with AI analytics, dashboards, reporting, and more.
Community driven innovation via Helical Insight CE – Helical Insight
Compare Helical Insight Community and Enterprise Editions. Get every BI feature free forever with AI analytics, dashboards, reporting, and more.