In the world of Business Intelligence (BI), accuracy is everything—but presentation matters just as much. Pixel perfect BI reporting is the art of designing reports where every element—text, charts, colors, margins, and alignment—is positioned exactly as intended, with zero compromises. These reports are essential when organizations need to meet strict compliance standards, deliver professional client-facing documents, or replicate official print-ready formats like invoices, statements, certificates, or regulatory forms.

Pixel perfect BI reporting delivers layout fidelity for compliance-ready and client-facing documents (invoices, statements, certificates, regulatory forms). Industries such as finance, healthcare, government and manufacturing rely on pixel-perfect outputs for brand integrity and legal accuracy.

Deliver pixel perfect reports with unmatched precision and presentation. Helical Insight—where every detail is deliberate, and every report inspires confidence.

Start Your 30-Day Free Trial

What is Pixel Perfect BI Reporting?

Pixel Perfect BI Reporting refers to reports designed with exact visual precision — where every line, chart, font and graphic element appears exactly as intended both on screen and in print. Unlike interactive dashboards, these reports prioritize layout fidelity and print-ready formatting.

Use cases: annual financial reports, invoices, medical records, regulatory filings, certificates, and any document where layout deviations are unacceptable.

Why businesses need pixel perfect reports

Presentation influences perception. Even correct data can lose credibility if the report looks inconsistent. Pixel perfect BI reporting solves this by guaranteeing:

  • Compliance-ready documentation — adhere to government or industry formatting without deviations.
  • Brand integrity — consistent logos, colors and typography in every output.
  • Print & digital parity — identical rendering on-screen and in exported PDF or print.
  • Client confidence — professional deliverables that strengthen trust.

Key features of pixel perfect BI reporting

  • Exact layout control: Fixed positioning and precise margins for consistent alignment across formats.
  • Multi-format output: Export to PDF, Excel, Word, HTML or images without layout loss.
  • Data integration: Pull live or scheduled data from multiple sources into a single template.
  • Dynamic content: Auto-populate recurring reports with updated figures, charts and tables.
  • Print-ready quality: High-resolution outputs suitable for professional publishing and official record keeping.

Deliver pixel perfect reports with unmatched precision and presentation. Helical Insight—where every detail is deliberate, and every report inspires confidence.

Start Your 30-Day Free Trial

Industries where pixel perfect reporting is essential

  • Finance & Banking: audit-ready balance sheets, statements and compliance packs.
  • Healthcare: patient records, lab reports and regulated documentation.
  • Government & Public Sector: official forms and statutory reports.
  • Manufacturing & Supply Chain: certificates, production logs and shipment documents.
  • Education & Certification Bodies: transcripts, certificates and result sheets.

Helical Insight: The best pixel perfect BI reporting platform

Helical Insight combines enterprise-grade precision with open-source flexibility — making it an ideal choice for organizations that require high-fidelity reporting without heavy licensing costs.

Why Helical Insight leads

  • Advanced layout precision: full control over every pixel for flawless presentation.
  • Flexible outputs: export to PDF, Excel, Word, images without losing layout integrity.
  • Cross-database joins: merge data from multiple sources into a single, unified report.
  • Dynamic & automated: schedule reports to auto-refresh and distribute updated PDFs.
  • Customizable templates: developer-friendly templates for bespoke, pixel-perfect designs.
  • Cost-effective open-source model: enterprise features with transparent pricing and extensibility.
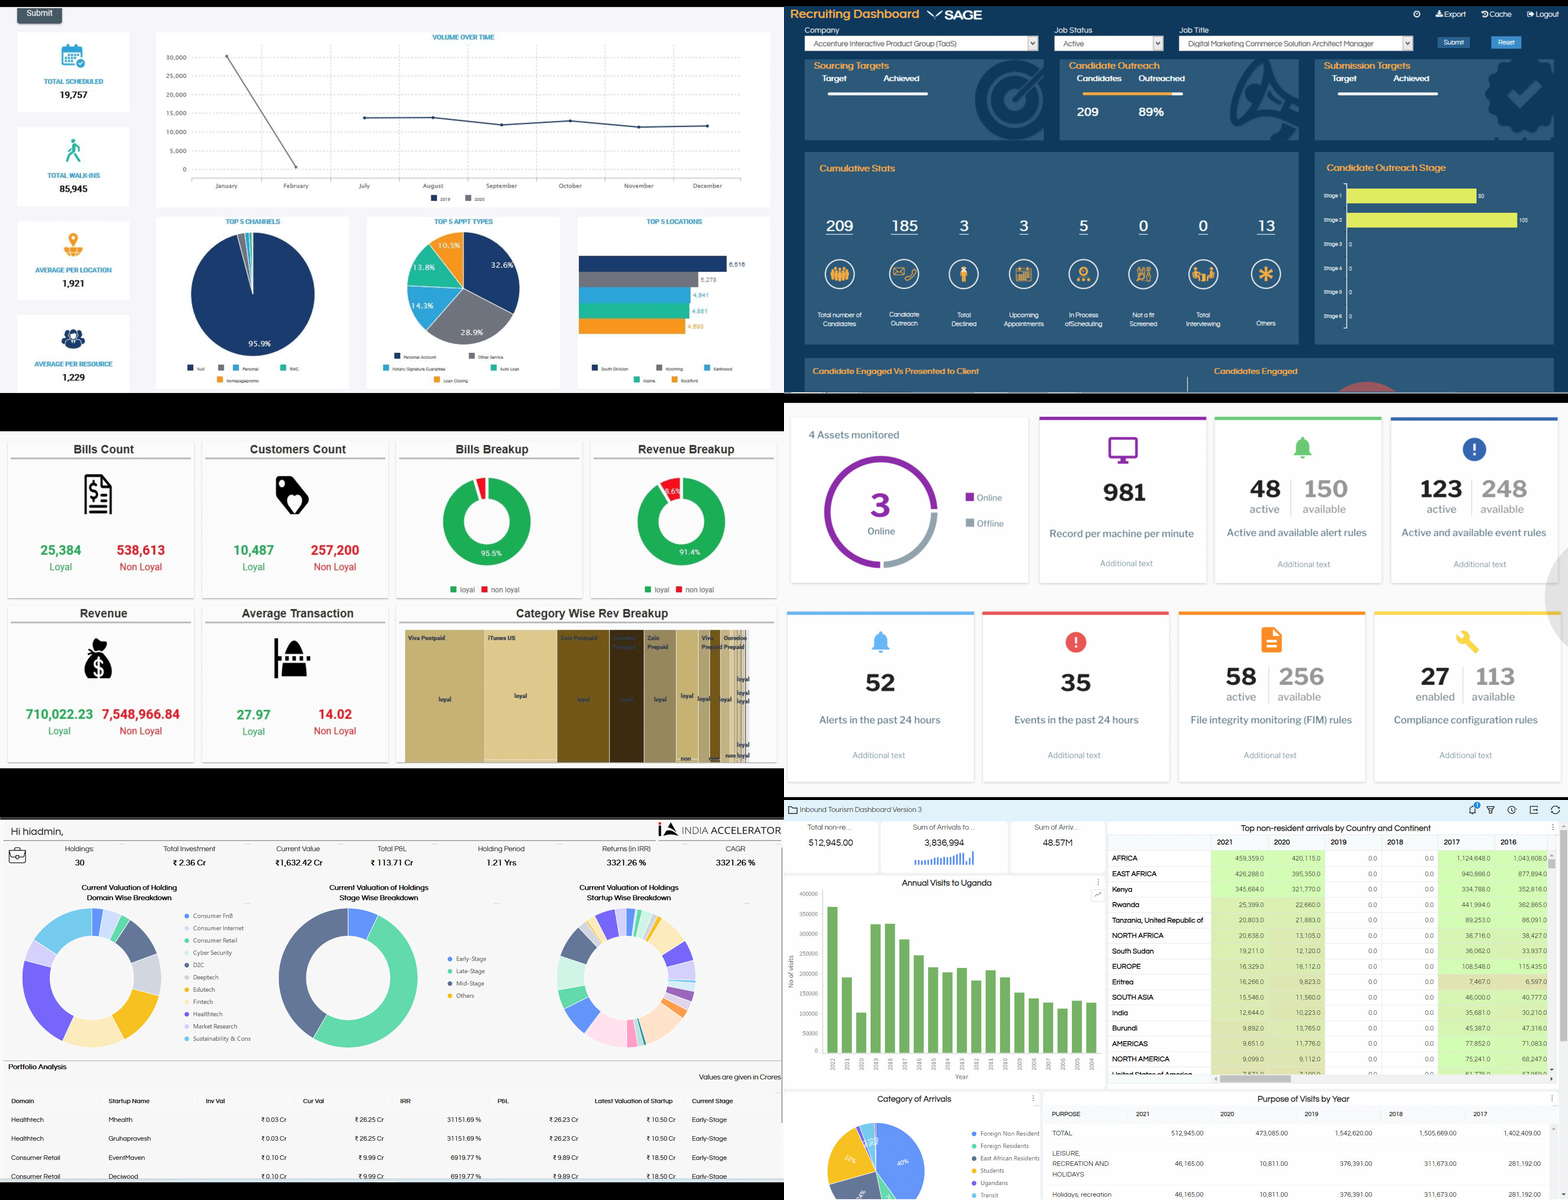
pixel perfect BI reporting

The future of pixel perfect BI reporting

Pixel perfect reporting is trending toward automation, AI-assisted layout generation, and cloud-native production. Natural language query (NLP) capabilities will enable non-technical users to generate pixel-perfect outputs from plain language prompts.

Helical Insight is already integrating NLP-driven BI alongside traditional pixel perfect features — bridging design perfection with data accessibility for modern enterprises.

FAQs: Pixel Perfect BI Reporting

What is Pixel Perfect BI Reporting and how does it work?

Pixel Perfect BI Reporting ensures every element in a report—text, charts, images, and tables—is placed with exact precision. This guarantees that both printed and digital versions look exactly as designed, maintaining consistency across formats.

Why do businesses need Pixel Perfect Reporting for data visualization?

Businesses use Pixel Perfect Reporting to deliver highly polished, accurate, and brand-compliant reports that build trust with stakeholders and comply with regulatory standards.

What are the benefits of Pixel Perfect BI Reporting over standard BI reports?

Pixel Perfect Reporting offers exact layout control, consistent design across platforms, compliance-ready formatting, and superior print quality compared to standard BI reports.

Which industries benefit the most from Pixel Perfect Reporting?

Industries such as finance, healthcare, government, manufacturing, and logistics rely on pixel perfect reports for professional, compliance-ready documentation.

How does Pixel Perfect Reporting ensure brand and compliance accuracy?

It allows precise placement of branding elements, adherence to corporate design guidelines, and fixed layouts for legal or regulatory compliance documents.

What file formats can Pixel Perfect BI Reports be exported to?

Pixel Perfect BI Reports can be exported to PDF, Excel, Word, PowerPoint, and various image formats for seamless sharing and printing.

What makes Helical Insight the best tool for Pixel Perfect BI Reporting?

Helical Insight offers unmatched precision, multiple export formats, open-source flexibility, cross-database joins, and cost-effective licensing, making it the ideal solution for pixel perfect BI reporting.

Is Pixel Perfect BI Reporting suitable for both print and digital formats?

Yes, Pixel Perfect BI Reporting ensures identical layouts in both print and digital outputs, making it ideal for presentations, reports, and compliance documents.

Leave a Reply

Helical Insight’s self-service capabilities is one to reckon with. It allows you to simply drag and drop columns, add filters, apply aggregate functions if required, and create reports and dashboards on the fly. For advanced users, the self-service component has ability to add javascript, HTML, HTML5, CSS, CSS3 and AJAX. These customizations allow you to create dynamic reports and dashboards. You can also add new charts inside the self-service component, add new kind of aggregate functions and customize it using our APIs.
Helical Insight, via simple browser based interface of Canned Reporting module, also allows to create pixel perfect printer friendly document kind of reports also like Invoice, P&L Statement, Balance sheet etc.
If you have a product, built on any platform like Dot Net or Java or PHP or Ruby, you can easily embed Helical Insight within it using iFrames or webservices, for quick value add through instant visualization of data.
Being a 100% browser-based BI tool, you can connect with your database and analyse across any location and device. There is no need to download or install heavy memory-consuming developer tools – All you need is a Browser application! We are battle-tested on most of the commonly used browsers.
We have organization level security where the Superadmin can create, delete and modify roles. Dashboards and reports can be added to that organization. This ensures multitenancy.
A first-of-its-kind Open-Source BI framework, Helical Insight is completely API-driven. This allows you to add functionalities, including but not limited to adding a new exporting type, new datasource type, core functionality expansion, new charting in adhoc etc., at any place whenever you wish, using your own in-house developers.
It handles huge volumes of data effectively. Caching, Pagination, Load-Balancing and In-Memory not only provides you with amazing experience, but also and does not burden the database server more than required. Further effective use of computing power gives best performance and complex calculations even on the big data even with smaller machines for your personal use. Filtering, Sorting, Cube Analysis, Inter Panel Communication on the dashboards all at lightning speed. Thereby, making best open-source Business Intelligence solution in the market.
With advance NLP algorithm, business users simply ask questions like, “show me sales of last quarter”, “average monthly sales of my products”. Let the application give the power to users without knowledge of query language or underlying data architecture
Our application is compatible with almost all databases, be it RDBMS, or columnar database, or even flat files like spreadsheets or csv files. You can even connect to your own custom database via JDBC connection. Further, our database connection can be switched dynamically based on logged in users or its organization or other parameters. So, all your clients can use the same reports and dashboards without worrying about any data security breech.
Our application can be installed on an in-house server where you have full control of your data and its security. Or on cloud where it is accessible to larger audience without overheads and maintenance of the servers. One solution that works for all.
Different companies have different business processes that the existing BI tools do not encompass. Helical Insight permits you to design your own workflows and specify what functional module of BI gets triggered