In this blog we are going to learn how to use Print When Expression. In this specific use case, we are having a filter. The filter is having unique filter value, we are checking the filter values which are assigned and based on that we will display either first image or second image. In this blog we have covered how we have done that.

Process:

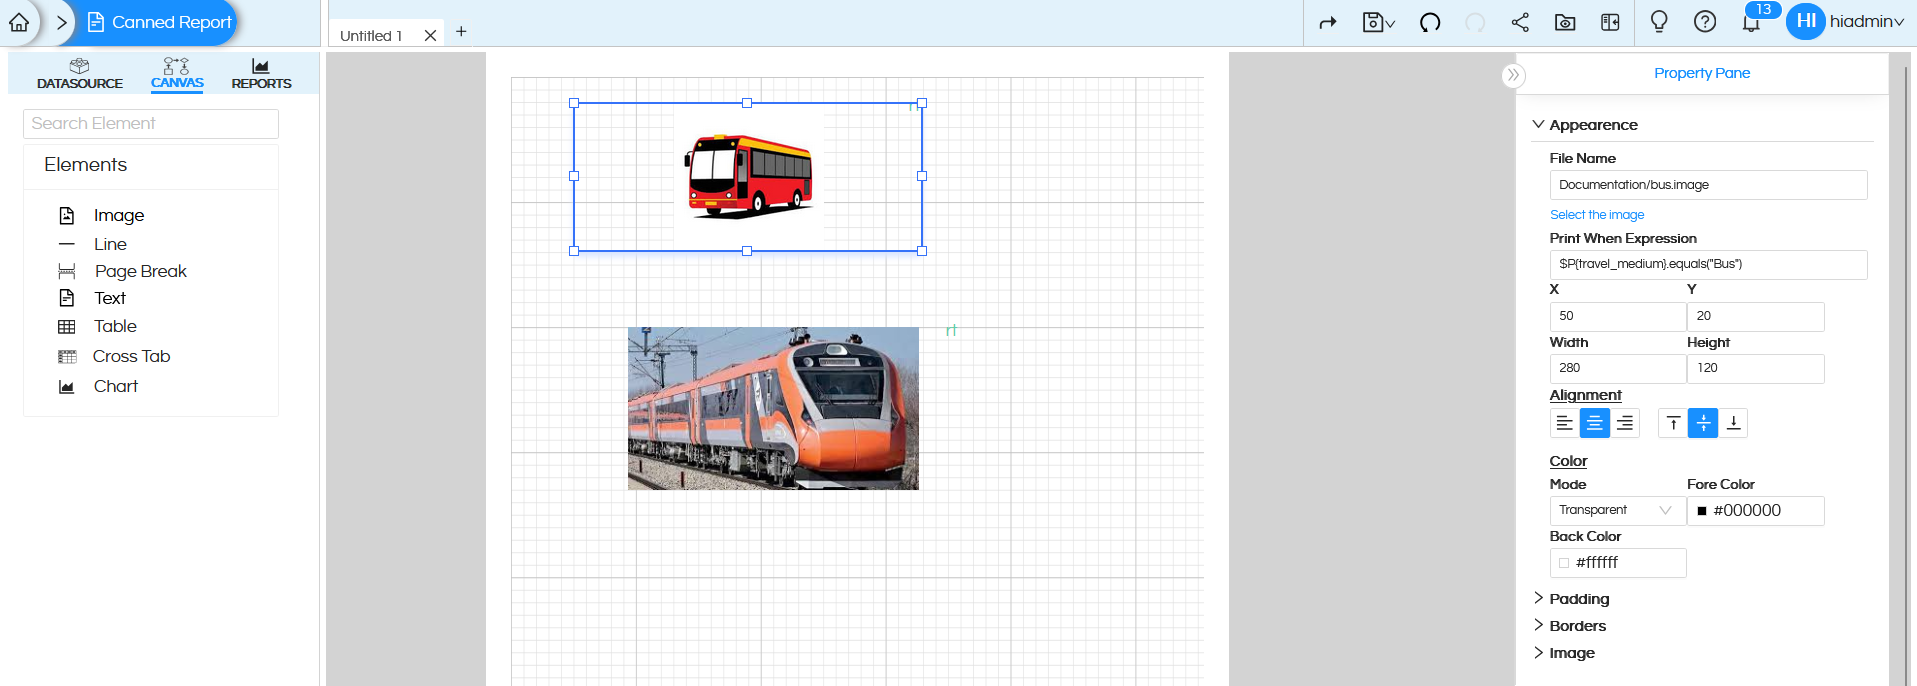
Drag and add two image components. To the first image add a Bus image and to the second one add a Train image.

To control which image is displayed, the Print When Expression property is used for each image based on the selected value of the travel_medium parameter. We are adding a filter called travel_medium and based on the selected value we will display that respective image.

For the Bus image, the Print When Expression is :

$P{travel_medium}.equals("Bus").

For the Train image, the expression is :

$P{travel_medium}.equals("Train").

These expressions evaluate the selected parameter value and determine which image should be shown.

Please refer the below link to know more about how to create the parameters:

https://www.helicalinsight.com/using-single-select-drop-down-input-parameter-filter-in-canned-reporting/

Print When Expression Usage on Image

(OPTIONAL) Both of the image components described above can even overlap with each other, hence ensuring that the image appears at exactly the same place based on the value selected. This is a more ideal usage.

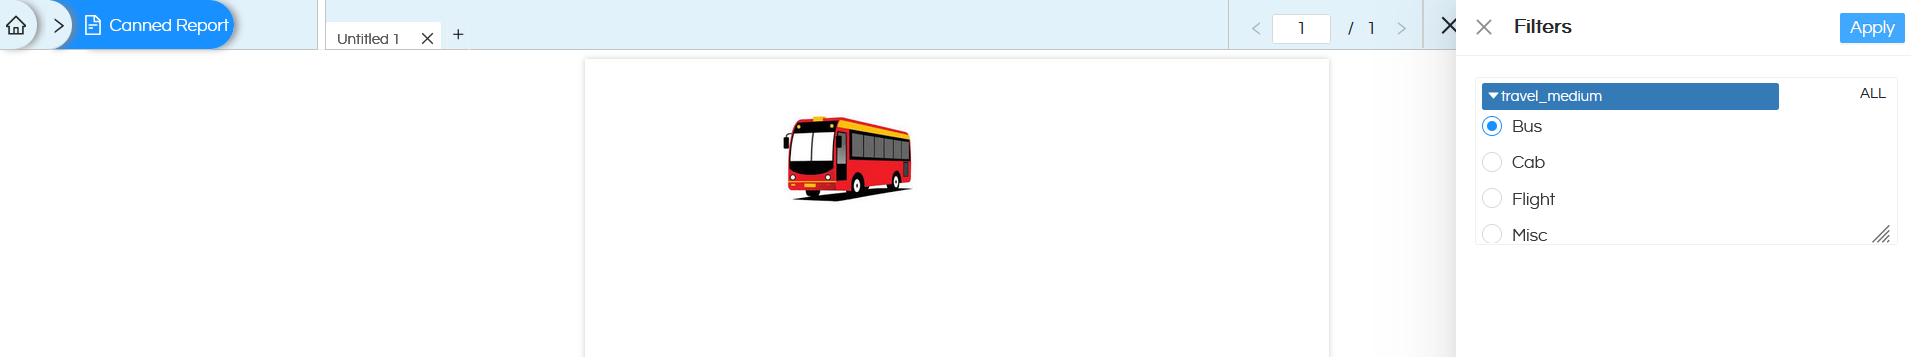
When a person selects a specific value, that respective travel medium is appearing. When the user selects “Bus” in the travel_medium parameter, the condition for the Bus image becomes true, so the Bus image is displayed. At the same time, the condition for the Train image becomes false, so the Train image is hidden.

Print When Expression Usage on Image

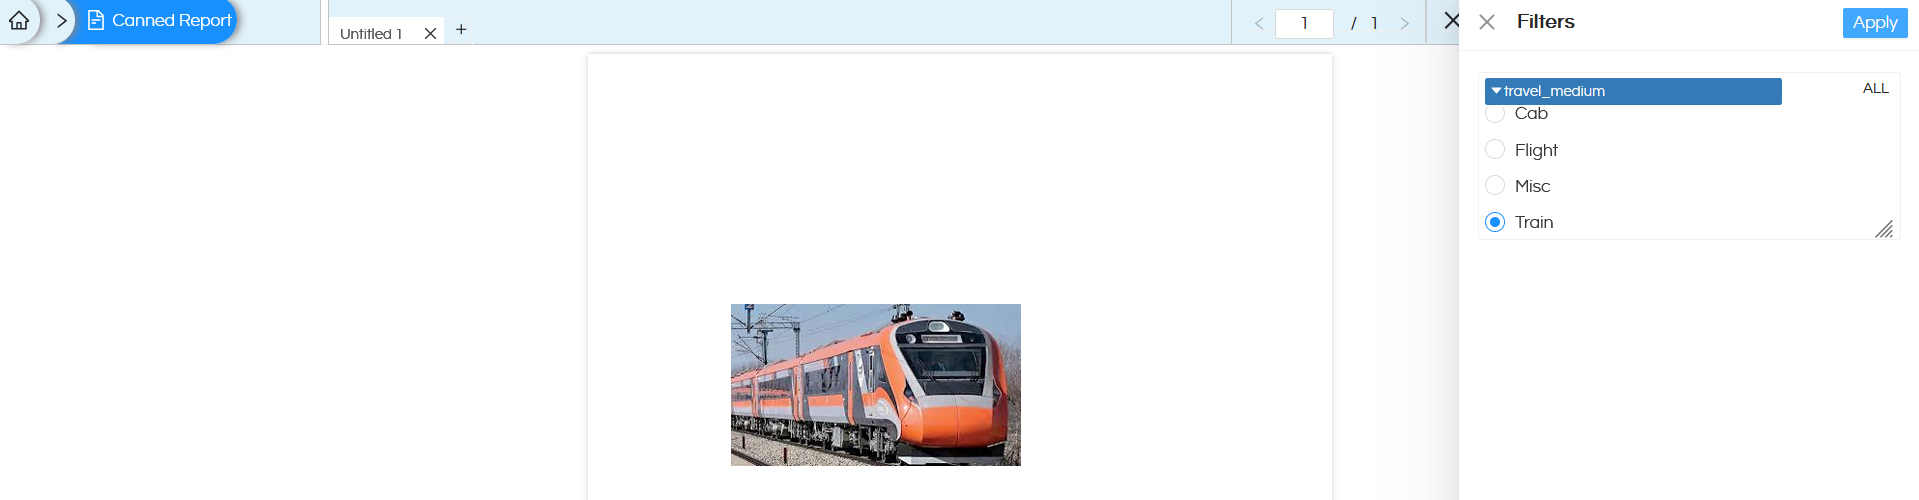
Similarly, when the user selects “Train“, the Train image is displayed and the Bus image is hidden.

Print When Expression Usage on Image

In simple terms, this approach allows you to show different images based on user selection. If the condition is true, the image is shown; if the condition is false, the image is hidden.

For example, selecting Bus will display the Bus image, and selecting Train will display the Train image.

So when we select Bus from the travel_medium parameter we get the bus image. If we select Train we get the train image.

Click here to read more about the usage of image component in canned report.

Leave a Reply

Helical Insight’s self-service capabilities is one to reckon with. It allows you to simply drag and drop columns, add filters, apply aggregate functions if required, and create reports and dashboards on the fly. For advanced users, the self-service component has ability to add javascript, HTML, HTML5, CSS, CSS3 and AJAX. These customizations allow you to create dynamic reports and dashboards. You can also add new charts inside the self-service component, add new kind of aggregate functions and customize it using our APIs.
Helical Insight, via simple browser based interface of Canned Reporting module, also allows to create pixel perfect printer friendly document kind of reports also like Invoice, P&L Statement, Balance sheet etc.
If you have a product, built on any platform like Dot Net or Java or PHP or Ruby, you can easily embed Helical Insight within it using iFrames or webservices, for quick value add through instant visualization of data.
Being a 100% browser-based BI tool, you can connect with your database and analyse across any location and device. There is no need to download or install heavy memory-consuming developer tools – All you need is a Browser application! We are battle-tested on most of the commonly used browsers.
We have organization level security where the Superadmin can create, delete and modify roles. Dashboards and reports can be added to that organization. This ensures multitenancy.
A first-of-its-kind Open-Source BI framework, Helical Insight is completely API-driven. This allows you to add functionalities, including but not limited to adding a new exporting type, new datasource type, core functionality expansion, new charting in adhoc etc., at any place whenever you wish, using your own in-house developers.
It handles huge volumes of data effectively. Caching, Pagination, Load-Balancing and In-Memory not only provides you with amazing experience, but also and does not burden the database server more than required. Further effective use of computing power gives best performance and complex calculations even on the big data even with smaller machines for your personal use. Filtering, Sorting, Cube Analysis, Inter Panel Communication on the dashboards all at lightning speed. Thereby, making best open-source Business Intelligence solution in the market.
With advance NLP algorithm, business users simply ask questions like, “show me sales of last quarter”, “average monthly sales of my products”. Let the application give the power to users without knowledge of query language or underlying data architecture
Our application is compatible with almost all databases, be it RDBMS, or columnar database, or even flat files like spreadsheets or csv files. You can even connect to your own custom database via JDBC connection. Further, our database connection can be switched dynamically based on logged in users or its organization or other parameters. So, all your clients can use the same reports and dashboards without worrying about any data security breech.
Our application can be installed on an in-house server where you have full control of your data and its security. Or on cloud where it is accessible to larger audience without overheads and maintenance of the servers. One solution that works for all.
Different companies have different business processes that the existing BI tools do not encompass. Helical Insight permits you to design your own workflows and specify what functional module of BI gets triggered