In the previous blog, we have learnt usage of image component where the image direct URL is provided or it is uploaded locally.

Starting with version 6.2.1 of open source BI Helical Insight, new methods for adding and displaying images have been introduced, enabling dynamic image rendering. That means you can have the images present in your database (as a path of the image or a BLOB file) which can then be dynamically rendered in the created canned report.

In this blog, we will explore both methods and demonstrate how to render images using each approach.

Method 1 (DB having Direct URL) :

In this method, the column/field should contain the direct URL of the image you want to render

  • In the above example, the emp_profile field contains direct image URLs that need to be rendered for each row. In the next step, we will use this field to create a basic card displaying employee details along with the corresponding image.
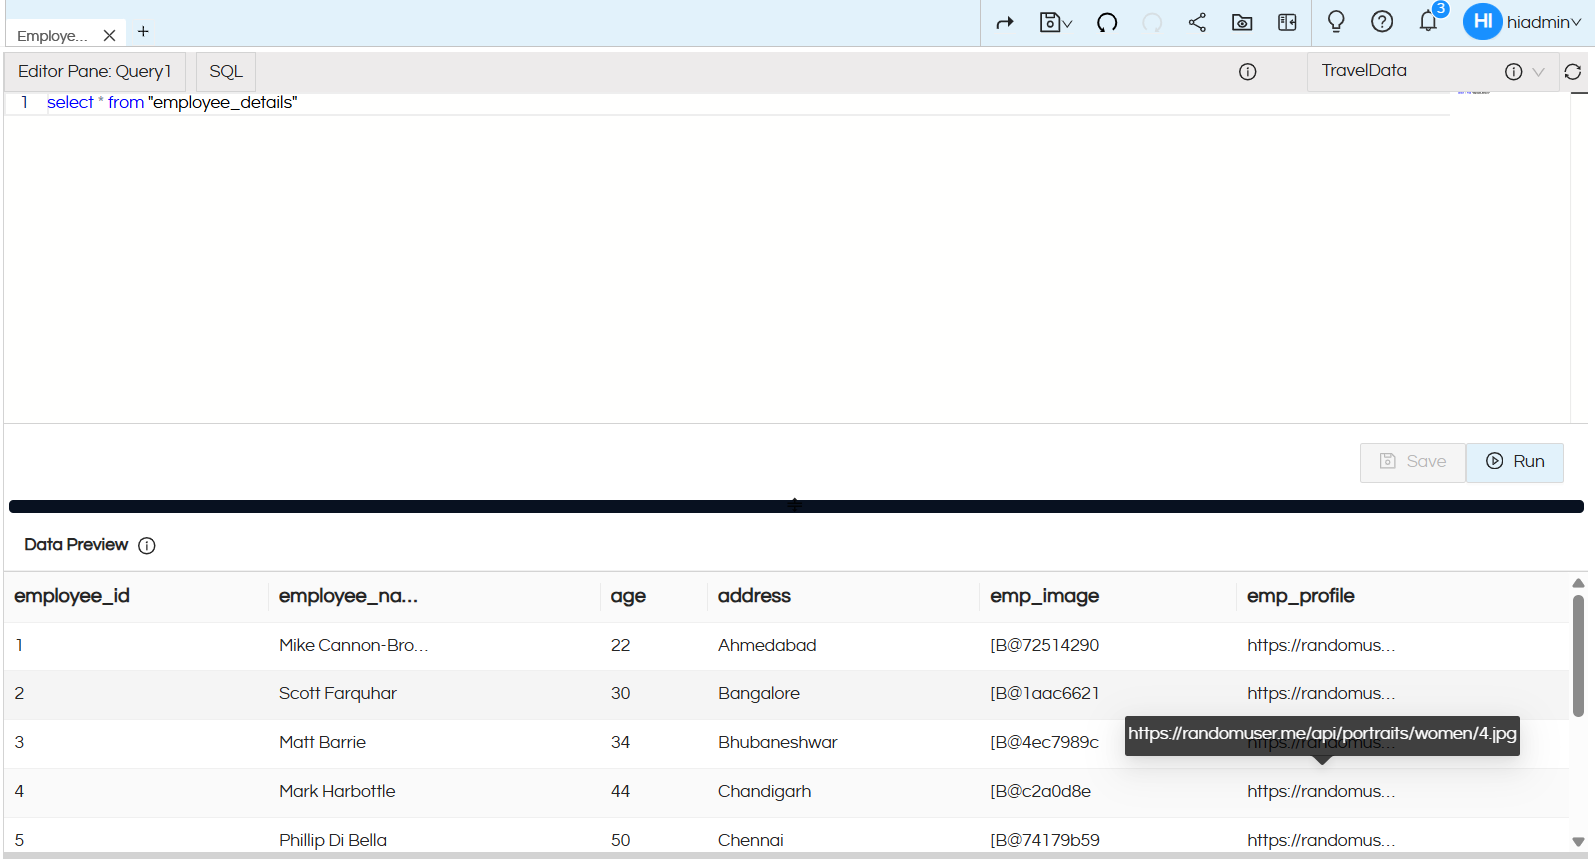
    Display Image stored in DB in Canned Report

  • Navigate to the Canvas section and add an Image component. You will see options similar to those shown in the image below.
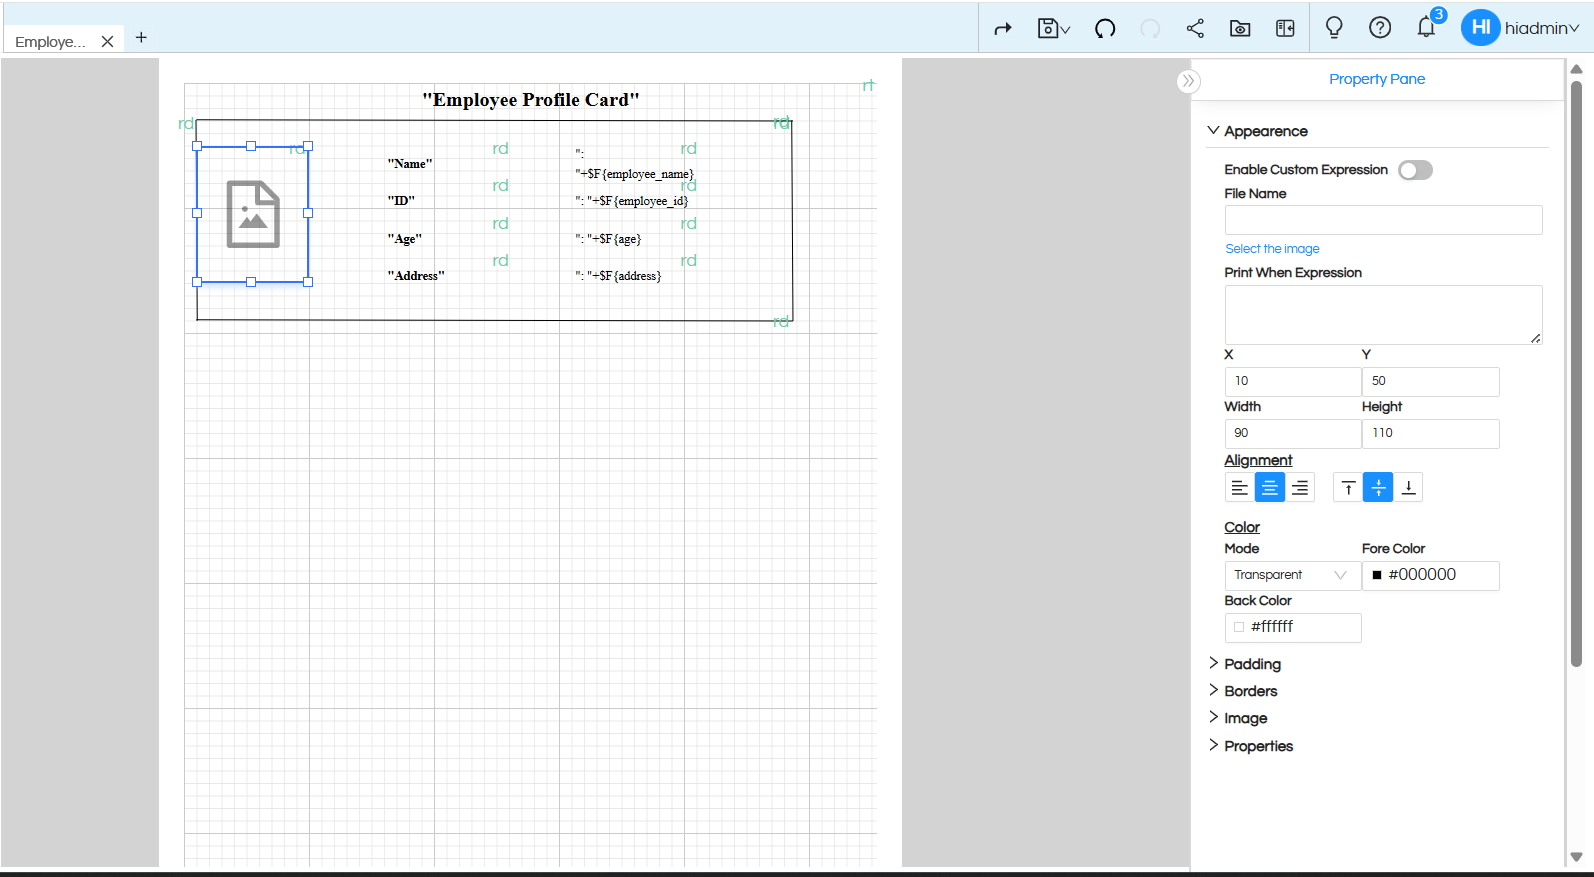
    Display Image stored in DB in Canned Report

By default, the Enable Custom Expression option is disabled. Enable this option to proceed.

A text input field will now be available. Click on it and navigate to the Fields section, where all fields retrieved from the query will be displayed.

Select the field containing the direct image URL, for example, emp_profile

Once the field is selected, its reference will appear in the input field. This indicates that the Image component is now dynamically retrieving the image URL from the database column instead of using a hardcoded value.

Click Preview to view the report, where images will be rendered dynamically for each corresponding row or card.

This is one method for rendering images in the report directly from data stored in the database.

Method 2 (Blob) :

The method and steps are the same as the process described above; the only difference is that the field contains image data in BLOB format instead of a direct URL (refer to the image below for reference).

Here, the emp_image field contains image data in BLOB format.

Select the emp_image field in the input text field, as shown in the image below.

Once the field is selected, its reference will appear in the input field. This indicates that the Image component is now dynamically retrieving the image value from the database column instead of using a hardcoded value.

Click Preview to view the report, where images will be rendered dynamically for each corresponding row or card.

Using Custom Expression :

In this document, we have covered two methods for adding and rendering images where the direct dbfields are being used. However, there are additional approaches available, such as rendering images using custom expressions or through direct filter values provided by the end user. The method of usage and steps are the same.

This approach is useful when you want to display images based on specific conditions. For example, in scenarios where you need to show different images (such as a “Right” or “Wrong” indicator) depending on the value of another column, you can dynamically render the appropriate image. If a person has passed, one image can be displayed, whereas a different image can be shown if they have failed.

In such cases, the custom expression method allows you to easily switch between images based on conditional logic.

Filter :

This approach is useful when you want to provide end users with the flexibility to render any image dynamically at runtime.

Calculation:

We can also do some calculations variables which can also be displayed.

Further reading: Print When Expression Usage on Image – Helical Insight

Please reach out on support@helicalinsight.com in case of any more questions.

Leave a Reply

Helical Insight’s self-service capabilities is one to reckon with. It allows you to simply drag and drop columns, add filters, apply aggregate functions if required, and create reports and dashboards on the fly. For advanced users, the self-service component has ability to add javascript, HTML, HTML5, CSS, CSS3 and AJAX. These customizations allow you to create dynamic reports and dashboards. You can also add new charts inside the self-service component, add new kind of aggregate functions and customize it using our APIs.
Helical Insight, via simple browser based interface of Canned Reporting module, also allows to create pixel perfect printer friendly document kind of reports also like Invoice, P&L Statement, Balance sheet etc.
If you have a product, built on any platform like Dot Net or Java or PHP or Ruby, you can easily embed Helical Insight within it using iFrames or webservices, for quick value add through instant visualization of data.
Being a 100% browser-based BI tool, you can connect with your database and analyse across any location and device. There is no need to download or install heavy memory-consuming developer tools – All you need is a Browser application! We are battle-tested on most of the commonly used browsers.
We have organization level security where the Superadmin can create, delete and modify roles. Dashboards and reports can be added to that organization. This ensures multitenancy.
A first-of-its-kind Open-Source BI framework, Helical Insight is completely API-driven. This allows you to add functionalities, including but not limited to adding a new exporting type, new datasource type, core functionality expansion, new charting in adhoc etc., at any place whenever you wish, using your own in-house developers.
It handles huge volumes of data effectively. Caching, Pagination, Load-Balancing and In-Memory not only provides you with amazing experience, but also and does not burden the database server more than required. Further effective use of computing power gives best performance and complex calculations even on the big data even with smaller machines for your personal use. Filtering, Sorting, Cube Analysis, Inter Panel Communication on the dashboards all at lightning speed. Thereby, making best open-source Business Intelligence solution in the market.
With advance NLP algorithm, business users simply ask questions like, “show me sales of last quarter”, “average monthly sales of my products”. Let the application give the power to users without knowledge of query language or underlying data architecture
Our application is compatible with almost all databases, be it RDBMS, or columnar database, or even flat files like spreadsheets or csv files. You can even connect to your own custom database via JDBC connection. Further, our database connection can be switched dynamically based on logged in users or its organization or other parameters. So, all your clients can use the same reports and dashboards without worrying about any data security breech.
Our application can be installed on an in-house server where you have full control of your data and its security. Or on cloud where it is accessible to larger audience without overheads and maintenance of the servers. One solution that works for all.
Different companies have different business processes that the existing BI tools do not encompass. Helical Insight permits you to design your own workflows and specify what functional module of BI gets triggered